1
Ruth Dassonneville
2012
Marc Hooghe
Election Forecasting under Opaque Conditions
A Model for Francophone Belgium, 1981-2010
International Journal of Forecasting, accepted
ABSTRACT
Election forecasting models assume retrospective economic voting and clear mechanisms of
accountability. Previous research indeed indicates that incumbent political parties are being held
accountable for the state of the economy. In this article we develop a ‘hard case’ for the
assumptions of election forecasting models. Belgium is a multiparty system with perennial
coalition governments. Furthermore, Belgium has two completely segregated party systems
(Dutch and French language). Since the prime minister during the period 1974-2011 has always
been a Dutch language politician, French language voters could not even vote for the prime
minister, so this cognitive shortcut to establish political accountability is not available. Results of
an analysis for the French speaking parties (1981-2010) show that even in these conditions of
opaque accountability, retrospective economic voting occurs as election results respond to
indicators with regard to GDP and unemployment levels. Party membership figures can be used
to model the popularity function in election forecasting.
KEYWORDS
2
1.
Introduction
Election forecasting techniques have become increasingly popular and sophisticated during recent years. A key assumption of election forecasting is that voting behaviour is largely retrospective, as voters base their decisions on an assessment of the performance, especially with regard to the economy, of the outgoing government (Lewis-Beck, 2005). Furthermore it is assumed that political actors can be held accountable for these conditions and that mechanisms of accountability are clear for voters: they can identify who should be held responsible for the current state of the economy (Nadeau et al., 2002). Although each one of these assumptions can be challenged on theoretical grounds, it has to be noted that election forecasting techniques have been developed in the context of majoritarian electoral systems. The earliest and most successful applications of election forecasting techniques therefore can be found in majoritarian systems like the US, where voters usually do not have any problems to identify what party is responsible for conducting the economy of the country. In a political system like Germany too, it is quite clear that the leader of the main governing party usually also acts as government leader, and thus can be held responsible for economic policy.
In this article, we suggest applying election forecasting to Belgium, a political system with highly proportional electoral rules, a high degree of political fragmentation, and of coalition governments. The presence of these coalitions might already be seen as a hindrance for the assumption of transparency that is central within the logic of accountability. We can make the case even harder, however, by using a unique feature of the Belgian political system. Belgium is one of the single countries in the world without nation-wide political parties: the party system is fully segregated between the Dutch and the French community in the country. While up to the 1980s, there was quite some informal coordination going on between Dutch and French party elites within the same ideological party families, the current emphasis on linguistic tensions within the country has had as a result that both party systems can be seen as fully autonomous. This makes the questions of transparency and accountability even more problematic. Can the
3 Dutch speaking Christian-Democratic Party be held responsible for the actions of the French-speaking Christian-Democratic Party, or the other way round?
The Dutch language community is the largest group within the Belgian system (ca. 60 per cent of the population) and from1974 up to 2011 the prime minister of the country has always been a member of the Dutch language community. This long period of Dutch language dominance rendered government accountability even more difficult within the French community. The position of the prime minister is usually highly visible: it receives very much media attention, and the prime minister is the central personalisation of a government. Knowing who the prime minister is, can therefore serve as a kind of cognitive short-cut to identify who is to be held responsible for government policy. Basically, we can therefore assume that for voters in the French language community of Belgium, this cognitive short-cut is not available.1 This is especially the case, as the media system (newspapers, television and radio) in
Belgium is also fully segregated according to linguistic lines. Media research has shown that Dutch language media report very sparsely on the activities of French language politicians and vice versa (Sinardet, 2007). The French language party system in Belgium therefore offers the context for a hard test of election forecasting. Given the fact that the country is governed by coalition governments, and given the absence of a visible prime minister in the French language community, it can be expected that conditions for a successful application of election forecasting will not be met within this party system. If, on the other hand, we would succeed in building a valid election forecasting model even in these circumstances, this lends weight to the theoretical and empirical relevance of election forecasting.
In this article, we first give an overview of the literature on election forecasting and the main assumptions in this field of study. Furthermore, we focus on whether these assumptions are valid within the electoral context of the French language community of Belgium. Taking into account these limitations, we continue
1 Since December 2011, Elio Di Rupo (Parti Socialiste) is prime minister of Belgium, the first French speaking
politician to chair a national government in 37 years. This development, however, does not have any effect on our observations for the period 1981-2010.
4 with the construction of the model, followed by some diagnostics and the main conclusions to be drawn from the forecasting models.
2.
Literature Review
Election forecasting has been on the rise since the 1980s (Lewis-Beck, 2005). Within the United States there has since been a real boom of models that aim to make accurate forecasts. Elections in the United States are always an opportunity to update models and to launch new forecasts (Campbell & Lewis-Beck, 2008; Campbell, 2004; Campbell, 2010). Less work has been done for European countries, although several forecasting models are available for the larger European democracies the United Kingdom, France and Germany (Lewis-Beck & Jêrôme, 2010). The number of articles forecasting elections in European countries is expanding though. Moreover, the forecasting models developed for countries outside the United States have further strengthened the claim of forecasting scholars that the technique is universal and that developing a forecasting model is possible in every electoral context, no matter how different or exceptional (Lewis-Beck & Jêrôme, 2010). On the other hand, the rise and spread of statistical election forecasting to different countries has also shown that models are heavily dependent on the particular electoral context for which they are developed. There is no single one-size-fits-all model, but the core variables in the election forecasting models have to be adapted to the characteristics of various electoral systems. Both the indicators chosen and time lags used differ from model to model, from scholar to scholar and from country to country. When deciding what indicators to include in a model, then, a scholar should judge according to the electoral context for which the forecasting model is developed (Lewis-Beck & Tien, 2011).
The predominantly US context in which the first statistical election forecasts were developed has had a major influence on the main assumptions and applications of the method. The core model for election forecasts proves this point:
5 The assumption is that the electoral score of the main incumbent party will be determined by the popularity of that party and by the state of the economy in the period prior to the elections. The main model in election forecasts focuses on the incumbent and might therefore be called a government approval model (Lewis-Beck, 2005). Within electoral systems with two main parties, as the United States, this operationalisation is straightforward and politically relevant. When this dichotomy between incumbent and opposition is not that clear, as is the case in multiparty contexts, more complex forecasting models are needed (Arzheimer & Evans, 2010). Furthermore, the election forecasting model is heavily dependent on the impact of the economy on the vote: Statistical election forecasting is clearly rooted in the tradition of economic voting. The central assumption, in line with the tradition of scholars as V.O. Key (1966), is that voters hold the incumbent accountable for the state of the economy. The incumbent is believed to be rewarded for economic prosperity and punished in times of economic downturn (Lewis-Beck, 2006). This mechanism is mostly taken for granted, but critical voices have arisen about its applicability in other democratic systems. It is then argued that the degree to which voters reward and punish according to the economy depends to a considerable degree on the clarity of responsibility within a particular political context (Anderson, 2000; Nadeau et al., 2002; Powell & Whitten, 1993). If the outgoing government is supported by more than one party, it is not always self-evident for voters who is responsible for the state of the economy.
The Belgian electoral system offers an extremely hard case for the efforts to ascertain whether election forecasting techniques can also be used outside the context of a clear majoritarian democracy. First, in Belgium, there is no single incumbent party to be judged for its performances by the voters. Since 1954, the country has always been governed by coalition governments. Those governments consist of parties with different ideological perspectives and from different language groups (Deschouwer, 2009). Belgium is characterized by a multiparty system and is even known as one of the most fragmented party systems worldwide. In 1999 the Effective Number of Parties (ENP) reached 9.1 for Belgium (De Winter et al., 2006). One of the elements contributing to this high level of party fragmentation, is the complete
6 separation of the party system along linguistic lines, since the traditional parties all split into a Flemish and a Walloon party between 1968 and 1978 and new political parties too are situated at only one side of the linguistic divide (De Winter et al., 2006).
Previous research has shown that even in multiparty contexts, it is possible to develop accurate and meaningful election forecasts (Norpoth & Gschwend, 2010; Arzheimer & Evans, 2010; Bellucci, 2010). The main issue for scholars in such a context is to determine what electoral result is to be modeled. Different approaches to solve this dilemma have been taken up so far. For French presidential elections for example, Nadeau and his colleagues (Nadeau et al., 2010) took the vote share of left-wing candidates as the dependent variable in a two-step forecasting model. Arzheimer and Evans (2010) forecasted the vote shares of different French parties at the same time by means of a seemingly unrelated regression (SUR) model. For the Italian multiparty case, Bellucci (2010) modeled both the summed vote share of all government parties and the vote share of the main party in government, which holds premiership. For German Bundestag elections, Norpoth and Gschwend (2010) took this first approach and targeted their forecast at the vote share of the governing coalition. The expectation therefore is that in a multiparty system like Belgium too, some form of election forecasting is possible.
Second, being rooted in economic voting theory, the tradition of election forecasting assumes that voters reward and punish incumbent parties according to the state of the economy. The degree to which voters reward and punish incumbents is dependent on how clear accountability within a country is (Powell & Whitten, 1993; Anderson, 2000). Voters reward and punish incumbents in a more straightforward way when it is clear who the incumbent is, when there is a large incumbent party and when there are not too much alternatives to choose from (Anderson, 2000). Within Belgium, the transparency of accountability appears to be rather low. In the clarity of responsibility index developed by Nadeau and his colleagues (2002), Belgium has the lowest score of eight countries included.2 Given the strong party fragmentation
2 Their index includes the governing party target size, ideological cohesion of the governing coalition, the longevity
of the government and the number of political parties with at least three percent of the seats in the legislative assembly.
7 and the rapid turnover with regard to government coalitions, it can therefore be expected that for Belgian voters it is not always easy to identify who to hold accountable for the state of the economy. Despite this lack of transparency, some empirical research still indicates that economic voting does take place in the Belgian context (Geys & Vermeir, 2008).
The complexity of the Belgian federal system, however, still poses another challenge for electoral accountability. Bellucci (2010, p.65) has argued that within Italy voters primarily hold the largest party in the ruling coalition accountable for government performance. While junior coalition parties might be held accountable to some extent, the burden of incumbency (whether positive or negative) is carried by the largest party, that also happens to be the party of the prime minister. Research has shown that in France too, the prime minister is most often seen as the personification of the economic policy being pursued. In times of a cohabitation, for example, with a president and a government from rivaling political parties, French voters are able to identify the prime minister as the one responsible for the economy (Lewis-Beck, 1997). For the electoral performance of the Dutch language political parties within Belgium, too, it has been shown that the party of the prime minister is being held accountable much more strongly than junior coalition parties (Hooghe & Dassonneville, 2013). For the Dutch language voters, however, it is quite clear who the prime minister is, because between 1974 and 2011 the Belgian prime minister has always been Dutch-speaking. For the French speaking voters of the country, on the other hand, this cognitive short cut is much less readily available. Even if they know the party of the prime minister, the electoral rules of the country effectively prohibit them from voting for that specific party. Even if they would assume that the prime minister is responsible for the state of the economy, it is not clear what effect this could have on their electoral preference.
3.
Constructing the forecasting model
Previous research has made clear that despite large differences between political systems, it is possible to develop accurate forecasts in different countries (Lewis-Beck & Jêrôme, 2010). Although the Belgian
8 political context is very different from the U.S. political context, in which election forecasting as a method originated, we therefore aim at developing a forecasting model for Belgian Francophone parties. We start from the main government approval forecasting model, but adapt it in such a way as to take into account the specific context in which the Belgian Francophone parties operate.
Because of the central assumption of the presence of a reward and punishment mechanism, we develop a model that forecasts the vote share of incumbent parties (Lebo & Norpoth, 2006; Lewis-Beck, 2005). According to the main model, the vote share should be a function of the popularity of the incumbent parties and of the economy (see Eq. 1). The focus of this article is on the vote shares of the Francophone incumbent parties. Francophone political parties compete both in Wallonia (population: 3,400,000) and in the bilingual greater Brussels area (population: 1,100,000). Electoral results in Brussels tend to show a specific dynamic and electoral results there are very different from those in Wallonia (Deschouwer, 2009). For this reason we only focus on the federal electoral results of the Francophone parties within the Walloon region. The incumbent parties included in the analysis can be found in Table 1.
Table 1: Elections and incumbent parties included in the analysis 1981-2010
Election Incumbent Parties
8 Nov 1981 PSC, PS 13 Oct 1985 PSC, PRL 13 Dec 1987 PSC, PRL 24 Nov 1991 PSC, PS 21 May 1995 PSC, PS 13 Jun 1999 PSC, PS 18 May 2003 MR, PS, Ecolo 10 Jun 2007 MR, PS 13 Jun 2010 MR, PS, cdH
PSC/cdH: Christian-Democrats; PRL/MR: Liberals; PS: Socialists; Ecolo: Greens. Source: Deschouwer (2009) and complemented for most recent election.
It is customary to operationalise the popularity function in election forecasting by using commercially available election polls. This might lead to some methodological and theoretical problems however, since predicting election results by means of election polls is to some extent tautological if the aim of the election poll is exactly to predict electoral results. Furthermore, reliable political polls from commercial agencies are only scarcely available for a long period of time, which is a prerequisite for forecasting.
9 However, it has been shown that membership figures perform equally well as a proxy for the popularity of a political party (Hooghe and Dassonneville 2013). Introducing party membership as an independent variable in a model forecasting election results assumes that members are of (continued) importance for political parties. This is what authors as Paul Whiteley (2011) or Susan Scarrow (1996) argue when they stress the importance of grassroots membership for parties despite a trend towards professionalisation and centralization of parties and campaigns. If party members indeed function as a necessary and important link between parties and society in general and contribute to the electoral success of parties then party membership should be linked to election results, and the number of members a party has expresses indirectly the support for that party within society. In order to control for the fact that party membership in general is in decline, we do not include the raw number of party members, but rather the proportion of all party members that belongs to a specific party. For party membership we have access to a three-decades time series of figures for the main political parties.3 Although it might be argued that political parties have
a tendency to inflate their reported membership base, it has to be noted that this three decade time series shows a remarkable consistency. Even if parties would exaggerate the figures, they at least do so in a very consistent manner over the entire observation period (Van Haute, 2011).
Our aim is to develop a forecasting model, therefore there should be some lead time between the measurement of the independent variables and the dependent variable. When evaluating forecasting models, this time lag is even an important criterion (Lewis-Beck, 2005). Lagging the independent variables in a forecasting model allows us to predict election results beforehand. Furthermore, it also implies the inclusion of time, which is assumed to be necessary for the electorate to react to the variables expected to explain their voting behavior. While some lead time is thus necessarily included in a forecasting model, we do not want to include figures from too far back in time. First, because data for such a long period back in time are not available (the party membership time series starts from 1980 onwards) and second because forecasting from too far back in time might be called irrelevant
10 Beck, 2005). Party membership figures are available in yearly accounts, intuitively using the data from the year before the election year therefore would seem the best option. This provides some lead time but is still sufficiently close to the election to be theoretically linked to the electoral results. A formal test comparing the performance of different lead times furthermore confirmed that the party membership figures from the year before the election provide the best model fit.4 Using party membership figures from
one year before the election is theoretically most sound, as this is a time lag in line with previous forecasting research and it provides the best statistical fit when compared with longer lead times. For these reasons we use a one-year lag time for the party membership variable.
In Table 2 we estimate the relation between party membership popularity and election results (in vote shares) for all federal elections from 1981 onwards.5 The dependent variable is a party’s vote share in an
election, the single independent variable explaining the election result is the party membership variable. Because election results in a certain election year are not independent we control for the impact of election-year clusters when running the regressions. In a first regression we estimate the regression for all four parties (cdH, Ecolo, MR and PS) in each of the elections, allowing for an analysis with 35 units of observation. Table 2 shows that the party membership variable is indeed significantly related to the electoral results of the Francophone Belgian political parties. As the main aim of this article is to develop a valid forecasting model for Francophone parties within Belgium and because we start from the main model in forecasting literature, we focus on incumbent parties only. In Table 2 we therefore also test whether the relation between membership popularity and electoral results is still significant when eliminating opposition parties and thus considerably reducing the sample size. The results given in Table 2 indicate that, even when the we focus on incumbent parties only, party membership is strongly and significantly related to the vote shares of Francophone political parties. While the explained variance is
4 We ran separate regressions explaining the electoral results of the incumbent parties in federal elections with
membership figures from one, two, three and four year before the election respectively. The data from one year before the election resulted in the highest R² (0.70) and the lowest SEE (4.62).
5 The party membership time series starts in 1980. Figures on M can be found in Appendix 1. For Ecolo, no figures
11 slightly lower for the incumbent parties only, we still manage to explain 70 per cent of the variance, by including this single item of party membership.
Table 2. Entries of regression model predicting federal election results by means of party membership popularity (1981-2010)
Dependent variable Adj.R² SEE B Robust
Std. Err. p-value N
Vote Share Party (all
parties included) 0.80 4.49 0.41 0.05 0.000
35
Vote Share Party (only incumbent parties included)
0.71 4.62 0.33 0.06 0.001 20
Entries are the results of regression models with each time one independent variable. Dependent: election results of incumbent parties. Source: Deschouwer (2009) and complemented for most recent elections (see Appendix 1). Robust standardized errors are adjusted for 9 year clusters (1981, 1985, 1987, 1991, 1995, 1999, 2003, 2007 and 2010)
Having established that party membership popularity is a good measure for incumbent parties’ popularity, we now proceed with the second of the two main independent variables in the forecasting model. As evident from the theoretical part of this article, the economy is central in forecasting literature. For the Francophone political parties in Belgium, however, it is not self-evident to model this accountability because there has not been a French speaking prime minister in the country during the period of observation.
Therefore we will test several scenarios in which different parties are modeled to be rewarded or punished to a larger degree than other parties. For testing these different scenarios we make use of linear regression techniques. We estimate incumbent parties’ vote shares as a function of a macro economic indicator. After determining what economic indicator(s) to include in the model, we model different degrees of accountability by means of dummy variables. The model fit of these linear models then gives an indication about the way in which the reward-punishment mechanism is at work within the Walloon electoral context.
Belgium is a country with multiple levels of governance and different governments. Competences regarding economic issues too are situated at different levels. While the regions are responsible for
12 economic affairs, the monetary policy, labor market and social security are a competence of the federal state (Deschouwer, 2009). When including a macro-economic indicator into the forecasting model we should therefore mind the level at which policy reflected in this indicator is decided. As we are forecasting federal elections but confine the electoral scores to one region (Wallonia), we therefore test the effect of the economy by means of both a ‘national’ and a ‘regional’ economic indicator. As an indicator for the Belgian economy as a whole we make use of GDP growth rates. These figures are available in both quarterly and annual figures since 1981.6 Furthermore, we include regional unemployment rates to take
into account the economy in the Walloon region more specifically. Although labor market policy is a federal competence, unemployment is mostly framed as a regional matter in the media and is seen as specific for the regions (Geys & Vermeir, 2008). Regional unemployment figures are available at annual rates on the Eurostat website from 1983 onwards.7
A sufficient time lag between the measurement of the independent variables and the dependent variable is essential when developing a forecasting model. A lead time of about six months usually produces accurate forecasts and it constitutes a sufficient amount of time before the election to enable forecasting election results (Lewis-Beck & Tien, 2011). Furthermore a six month time frame allows for the electorate to react to the economy (Stegmaier & Lewis-Beck, 2009), which is what we assume to explain the link between macro-economic indicators and electoral results. Regional unemployment rates are only available at annual rates and therefore we include the figures of the year before the election. This implies that the time lag differs from case to case, depending on what month the election is held. For most elections the time lag is about six months. Although GDP growth rates are available at quarterly level, for reasons of coherence we include them at annual rates too. As such, the time lag for both economic indicators is identical, and differences in performance of both indicators for forecasting elections cannot be due to the moment of measuring both variables but can only be ascribed to the indicator as such. Although data
6 See Appendix 2. Source: Eurostat (http://epp.eurostat.ec.europa.eu), because there is a break in the Eurostat series
of GDP growth rates for 1995, the figure for this year comes from the OECD database (http://stats.oecd.org/)
13 availability would allow us to test whether the effect of GDP growth rates is perhaps more pronounced when using a shorter time lag, we rather test different scenarios of accountability than the effect of different time lags in this analysis. Although there is no agreement on the perfect time lag to be used in election forecasting (Lewis-Beck & Stegmaier, 2000), because a lead time of about six months is in line with most of the findings in this field of research (Lewis-Beck & Stegmaier, 2000; Lewis-Beck & Tien, 2011) we feel confident that this lag time should not distort the findings of economic accountability. Since the time lag differs from case to case, depending on the month in which the election was organized, we test whether weighing the data according to the specific time lags makes a difference. Therefore we use the same method as Bélanger and Gélineau (2010) have used when analyzing economic voting within Canada.8 Although this method is very useful to adjust data when only yearly accounts are available,
within the context of forecasting we can merely use it as an indication of the validity of the yearly data. The weighing makes use of data from the election year, not yet available beforehand and therefore not useful for forecasting. Because data for both indicators are not available before 1981, we lose some cases in the analysis and can no longer include the electoral results of 1981.
As mentioned before, in multiparty contexts and when coalition governments are formed, different parties are often regarded as either more or less accountable for the economy compared to other parties (Bellucci, 2010; Lewis-Beck, 1997). Therefore we consider four different scenarios in which possible differences in accountability between incumbent parties are taken into account.
First, as inhabitants of Wallonia could not vote for the party of the prime minister during the period of observation, we might expect all incumbent Francophone parties to be held equally accountable for the economy (Scenario 1). In such a case the trend for all incumbent parties should be the same.
8 They weigh yearly macro-economic data according to the election month. A yearly index is calculated that is
constructed with information both from the year before the election and from the election year. Depending on the timing of the election, either the election year or the year before has more weight.
14 Second, we might expect voters to consider the largest incumbent political party within their region as mainly responsible for the state of the economy (Scenario 2). If this would be the case, the largest incumbent party might be the only party rewarded and punished for the economy, while the other incumbent parties are not.
A third scenario is that Walloon voters see that party as responsible for the state of the economy which belongs to the same party family as the Flemish prime minister (Scenario 3). When the Belgian prime minister is a liberal, the PRL/MR should thus be the party to be credited or blamed for the economy. If a Flemish Christian-Democrat is prime minister, PSC/cdH should be treated likewise. It has to be mentioned again that this mechanism might be at work, even if there are no formal ties anymore between the Flemish and the Walloon Christian-Democrats.
In a fourth and final scenario we only consider the Francophone Socialists as the leading party whenever they are incumbent (Scenario 4). This party, historically the strongest party in the Walloon region, might therefore be considered to be the leading party, with a vote share oscillating between 30 and 40 percent of the vote. In general, research has shown that the Parti Socialiste is seen as the ‘natural’ defender of Walloon interests in the ongoing power struggle between the two language communities in Belgium (Delwit, 2009).
We test the presence of the four scenarios through the inclusion of dummy variables into the regression model. For the party that is expected to be regarded as responsible for the economy, the dummy-value is one when we focus on the impact of GDP growth rates and unemployment rates on electoral results. The other incumbent parties score zero on the dummy variable and are not expected to be rewarded or punished according to the economy.9
To test whether accountability for the economy is indeed different among the Francophone incumbent parties, the four scenarios are tested. We do so by including each of the interactive terms of the dummy
15 variable for the four scenarios and the economic indicators in a linear regression model with vote shares as the dependent variable (Table 3).
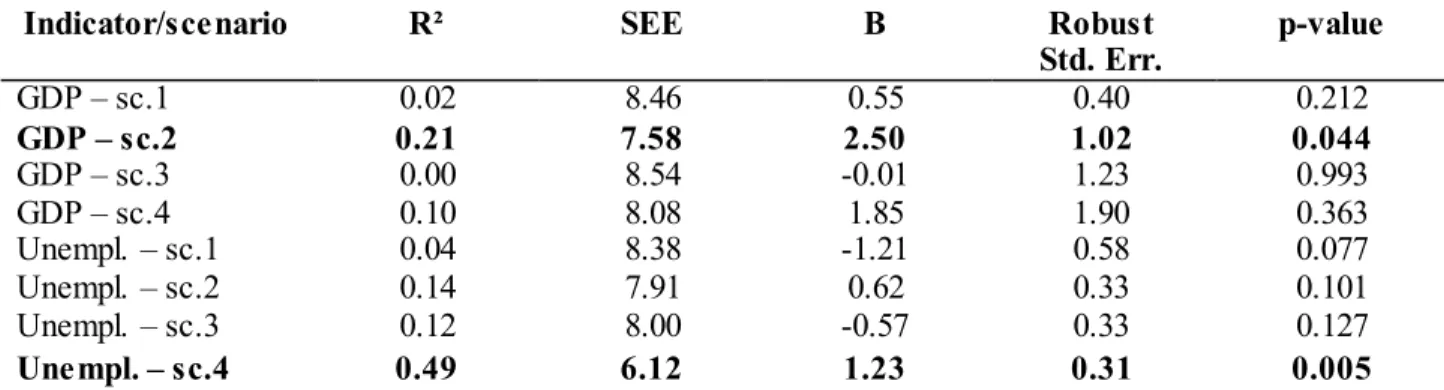
As is clear from the entries of the regression models in Table 3, when all incumbent parties are treated equally accountable, none of the economic indicators is significantly related to the election results (Scenario 1). This result can either mean that Walloon voters do not reward or punish their incumbent parties according to the state of the economy, or it can mean that the reward and punishment effect is not detected because only one party or a subset of parties is seen as responsible for the economy. Scenario two is marginally significant but only for GDP growth rates and scenario three does not produce sound results. According to the regression results in Table 3, it is clear that the scenario that produces by far the best model fit is the one in which we expected the Francophone Socialists to be regarded as the leading Francophone party in government (Scenario 4). There seems to be a reward-punishment-mechanism at work, but only so for the Francophone Socialists and with regard to unemployment.
Table 3. Optimal economic indicator (interactions) for forecasting election results of Francophone incumbent parties
Indicator/scenario R² SEE B Robust
Std. Err. p-value GDP – sc.1 0.02 8.46 0.55 0.40 0.212 GDP – sc.2 0.21 7.58 2.50 1.02 0.044 GDP – sc.3 0.00 8.54 -0.01 1.23 0.993 GDP – sc.4 0.10 8.08 1.85 1.90 0.363 Unempl. – sc.1 0.04 8.38 -1.21 0.58 0.077 Unempl. – sc.2 0.14 7.91 0.62 0.33 0.101 Unempl. – sc.3 0.12 8.00 -0.57 0.33 0.127 Unempl. – sc.4 0.49 6.12 1.23 0.31 0.005
Entries are the results of regression models with each time one independent variable. Dependent: election results of incumbent parties. GDP are annual GDP growth rates of the year before the election. Unempl. are regional
unemployment rates of the year before the election. Dummy values for the different scenarios can be found in Appendix 4. For each regression model, N = 18. Significant results are indicated in bold. Sources: Eurostat, OECD and Deschouwer (2009) and complemented with most recent election results (see Appendices 1 and 2). Robust standardized errors are adjusted for 8 year clusters (1985, 1987, 1991, 1995, 1999, 2003, 2007 and 2010)
These results mean that the Socialist Party, historically the largest and most influential Walloon party, is held accountable for the economy while the other incumbent parties are not. As can be seen in Appendix 3, when testing the different scenarios interacted with economic variables weighted according to the
16 election month, scenario four stands out as the best option there as well. When weighing the economic indicators, GDP growth rates are also significantly related to election results within a scenario 4 specification. These tests too point to unemployment rates as the best indicator for economic accountability in Francophone Belgium, however.
As we focus on electoral results in the Walloon region only and since Table 3 indicates that the best fitting model is one in which we consider the Socialist Party as responsible for the economy, we can also include regional election scores for the Walloon parliament. These elections can be considered as first order elections as well and were held on separate moments in time in 2004 and 2009 (Deschouwer, 2009).10
While at the federal level Walloon voters could not vote for the party of the prime minister from 1974 up to 2011, at the regional level there is a head of government, being the prime minister of the regional government for whom inhabitants of the Walloon region can vote. Both in 2004 and in 2009, this has been a politician from the Socialist Party. Including the 2004 and 2009 elections results allows us to increase the sample size for estimating the model, but this addition is also theoretically justifiable. Table 4 reports all the cases/parties included in this pooled sample of federal and regional elections.
Table 4: Elections and incumbent parties included in the analysis 1981-2010 (pooled sample)
Election Level Incumbent Parties
8 Nov 1981 Federal PSC, PS 13 Oct 1985 Federal PSC, PRL 13 Dec 1987 Federal PSC, PRL 24 Nov 1991 Federal PSC, PS 21 May 1995 Federal PSC, PS 13 Jun 1999 Federal PSC, PS
18 May 2003 Federal MR, PS, Ecolo
29 Jun 2004 Regional MR, PS, Ecolo
10 Jun 2007 Federal MR, PS
07 Jun 2009 Regional PS, cdH
13 Jun 2010 Federal MR, PS, cdH
PSC/cdH: Christian-Democrats; PRL/MR: Liberals; PS: Socialists; Ecolo: Greens. Source: Deschouwer (2009) and complemented for the most recent elections .
10 When federal and regional elections were on the same day (as in 1995 and 1999), we include the results of the
17 Before effectively adding the regional election results to the sample, we test whether the selected economic variables, GDP and unemployment, interacted with the Scenario 4-dummies are (still) significantly related to the election results when we include the 2004 and 2009 election results of the incumbent parties in the sample. As can be seen in Table 5, when including the regional election results into the sample for testing the forecasting model, unemployment is still and even more strongly significant. Assuming scenario 4 to be at work, GDP growth rates are still not significantly related to election results for the pooled sample.
Table 5. Optimal economic indicator (interactions) for forecas ting election results of Francophone incumbent parties (pooled sample of federal and regional election results)
Indicator/scenario R² SEE B Robust
Std. Error p-value
GDP – sc.4 0.12 8.50 2.36 1.98 0.265
Unempl. – sc.4 0.53 6.18 1.40 0.27 0.001
Entries are the results of regression models with each time one independent variable. Dependent: election results of incumbent parties. GDP are annual GDP growth rates of the year before the election. Unempl. are regional
unemployment rates of the year before the election. For each regression model, N = 23. Significant results are indicated in bold. Sources: Eurostat, OECD and Deschouwer (2009) and complemented for the most recent elections (see Appendices 1 and 2). Robust standardized errors are adjusted for 10 year clusters (1985, 1987, 1991, 1995, 1999, 2003, 2004, 2007, 2009 and 2010).
For each of the main elements in the classical government approval forecasting model, we have found a proxy that is significantly related to the vote shares of the Francophone incumbent parties in Belgium. The popularity of the parties among party members is significantly related to election results. Furthermore, we have found that unemployment rates in the year before the election are significantly related to the electoral results when interacted with a dummy that assumes that the Socialist Party is considered to be the leading party among the incumbents. We now proceed with the model, by including all these elements simultaneously into one single linear regression model. Since unemployment rates and GDP growth rates are both dependent on the economic situation those variables are highly correlated. Therefore and for reasons of parsimony we add only one economic indicator in the model and opt for unemployment. Most importantly, this variable clearly performed best in the single-variable models. When plugged into a
18 forecasting model, it is clear that the signs of the indicators are in the expected direction. In line with the thesis of voters rewarding and punishing incumbents, the unemployment variable has a negative sign. This indicates that, with increasing unemployment rates, less votes are cast for the Francophone Socialists when they are in government. Party membership on the other hand, has a positive sign indicating that the parties that are more popular among party members also get a higher vote share.
Vote Share Incumbent P arties = 8.67** + .67 M*** - 1.59 (U*PS).** [Eq. 2]
(3.80) (5.65) (-2.90)
Adj. r² = 0.81; SEE = 4.05; D-W = 2.12; N = 23; MAE = 3.2
The numbers between parentheses are t-ratios. Sign.: ***=< 0.001; **=<0.01; *= <0.05 (one-tailed test) M = the percent of party members per party in the year before the election; U = the unemployment rate in the year before the election; PS = a dummy variable, one for the Socialist Party, zero for the other parties. Cases are clustered
into 10 election years (1985, 1987, 1991, 1995, 1999, 2003, 2004, 2007, 2009 and 2010)
Based on the results in Equation 2 we can now estimate the vote shares for all the cases within the sample (see Table 6).
19
Table 6. Forecasting electoral results of Francophone incumbent parties
Date Party Predicted (1) Result (2) Error (1)-(2)
13-Oct-1985 PSC 19.7 22.6 -2.9 13-Oct-1985 MR 25.8 24.2 1.6 13-Dec-1987 PSC 19.7 23.2 -3.5 13-Dec-1987 MR 28.0 22.2 5.8 24-Nov-1991 PSC 19.4 22.5 -3.1 24-Nov-1991 PS 40.9 39.2 1.7 21-May-1995 PSC 20.0 22.5 -2.5 21-May-1995 PS 34.7 33.7 1.0 13-Jun-1999 PSC 18.7 16.8 1.9 13-Jun-1999 PS 31.1 29.2 1.9 18-May-2003 Ecolo 10.6 7.4 3.2 18-May-2003 MR 25.5 28.4 -2.9 18-May-2003 PS 33.8 36.4 -2.6 29-Jun-2004 Ecolo 10.5 8.5 2.0 29-Jun-2004 MR 24.4 24.3 0.1 29-Jun-2004 PS 33.0 36.9 -3.9 10-Jun-2007 MR 21.6 31.1 -9.5 10-Jun-2007 PS 29.5 34.2 4.7 7-Jun-2009 cdH 21.1 16.6 4.6 7-Jun-2009 PS 33.9 32.8 1.1 13-Jun-2010 cdH 21.1 14.6 6.5 13-Jun-2010 MR 21.2 22.2 -1.0 13-Jun-2010 PS 33.2 37.6 -4.4
Entries are the result of the regression model in Eq. 2. First: Date of the election, second column: party, third column: predicted result, next: real election result, Source: Deschouwer (2009); last column:
difference between predicted and observed result. PSC/cdH: Christian-Democrats; PRL/MR: Liberals; PS: Socialists; Ecolo: Greens.
4.
Diagnostics
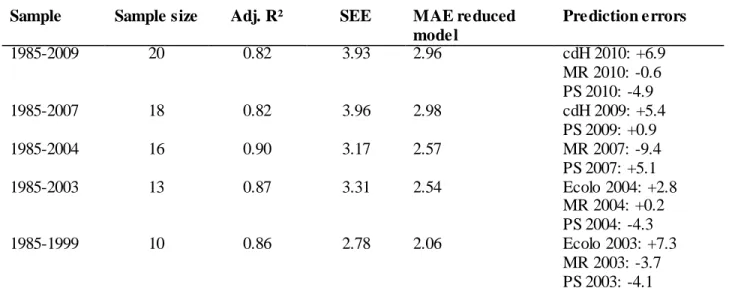
To assess the quality of the forecasting model constructed, we continue with some diagnostics. One of the main tools for doing so is by means of out-of-sample estimations and predictions. In this manner, we test whether the model still produces accurate forecasts when the sample size is considerably reduced. One of the main variables in the model is party membership. It might be argued that party membership becomes less important because party membership figures are in decline over the last decades. We therefore stepwise reduce the sample size by leaving the oldest cases out. By means of these newly fitted models we then predict the next election. Apart from the adjusted R², the standard error of estimates and the mean absolute error we also report the errors of the elections forecasted with the reduced models in Table 7. Even when the sample size is considerably reduced, the adjusted R² statistics and the MAE indicate that
20 the reduced models perform quite well. Nevertheless, the prediction errors are rather high. These errors indicate that although we succeeded in developing a forecasting model for Francophone incumbent parties, the predictive power of this model is rather low.
Table 7. Model diagnostics: out-of-sample predictions
Sample Sample size Adj. R² SEE MAE reduced
model Prediction errors 1985-2009 20 0.82 3.93 2.96 cdH 2010: +6.9 MR 2010: -0.6 PS 2010: -4.9 1985-2007 18 0.82 3.96 2.98 cdH 2009: +5.4 PS 2009: +0.9 1985-2004 16 0.90 3.17 2.57 MR 2007: -9.4 PS 2007: +5.1 1985-2003 13 0.87 3.31 2.54 Ecolo 2004: +2.8 MR 2004: +0.2 PS 2004: -4.3 1985-1999 10 0.86 2.78 2.06 Ecolo 2003: +7.3 MR 2003: -3.7 PS 2003: -4.1
To assess whether there is a systematic trend over time in the errors of the forecasts from the model (Eq. 2), we analyze whether there is a significant correlation between the absolute errors of the model and a time variable. We do so because results in Table 7 indicate that the model fit of the forecasting models (adjusted R²) increases when most recent elections are left out of the sample. This time variable is constructed with the formula T = Election Year - 1985 (the first election year in the period of observation). We do so for the full model and for models with either party membership or unemployment as the single independent variable. As such we can assess whether the explanatory power of the full model or of one of the main predictors varies over time. As can be observed in Table 8, for none of the models, the errors significantly increase or decrease over time. This implies that the model is quite robust over time and does
21 not lose predictive power. During the entire period, party membership and the state of the economy remain important predictors for electoral results.11
Table 8. Pearson correlation absolute error of forecasting models and time variable
The rather low explanatory power of the model might be caused by the fact that we could only establish a significant reward-punishment-mechanism for the Socialist Party. Therefore, the predictions for the other incumbent parties are dependent on the party membership variable only.
5.
Discussion
The core of literature on election forecasting contains models that assume voters to reward and punish incumbents according to the economy. The assumption made in economic voting theory however, is that voters know pretty well who to hold accountable for the economy. Within Belgium and especially in the Francophone part of the country, clarity of responsibility is rather low due to the specific political and electoral context.
The forecasting model developed in this article however, indicates that the election results of the Francophone Socialist Party are significantly related to unemployment rates in the year before the election. High unemployment rates are associated with smaller vote shares. These findings on an aggregate level, might indicate that at the individual level, voters in Wallonia see the Socialist Party as the one responsible for the economy. For other incumbent parties, a similar relation between electoral results and economic indicators is not significant. We might therefore conclude that, although Walloon voters cannot vote for the party of the prime minister, they do treat an incumbent party for which they can vote as
11 Additionally, graphical representations of the forecasting errors over time and a graphical assessment of the
residuals show no clear trend in the model fit over time.
Model Pearson correlation p-value
Full model 0.19 0.390
Party membership only model 0.34 0.116
22 the leading party in government. Within the Walloon electoral context this is the Socialist Party, historically the largest and most influential party within this region, that is seen and considered as such. This finding is highly relevant for the study of Belgian federalism. Earlier studies have shown that the specific constellation of the Belgian federal system provides the main party in each language community with a unique role. Both in the Flemish and in the French community, the party that traditionally is the largest party (Christian Democrats in the Flemish case, and Socialists in the French) is seen as the main representative of the community, and they are also granted a veto power (Hooghe & Deschouwer, 2011). The current analysis confirms this notion, as it has been shown that no matter the specific political constellation, the Socialist Party in the Walloon region apparently is held accountable for what happens in the region. Within a federal system like Belgium, the electoral strength at the regional level apparently matters more strongly than the weight of a political party at the federal level. While in the past the Socialist Party has been accused of ‘profiting’ from high unemployment figures in the Walloon region to install a system of clientelism, the current analysis clearly demonstrates that the Parti Socialiste is in fact punished by voters for a rise in unemployment levels.
Furthermore, the strong correlation found between party membership ratios and electoral results once more indicates that party membership figures can be a valid alternative as the popularity variable in a forecasting model, especially when no approval rating data or data from electoral polls are available.
This analysis also suffers from some important limitations, however. The fact that we found economic variables only to be significantly related to the election results of the Francophone Socialists indicates that they are considered as the leading party in government. While this is an interesting and theoretically relevant finding, it also implies that the model fit and predictive power of the model is far from impressive. We also have to acknowledge that while the election forecasting assumption can still be tested, even in a hard case like the Walloon region of Belgium, results are far less convincing than in electoral system with clear systems of accountability. Only the traditionally main incumbent party (the
23 Socialist Party) apparently is being held accountable for the state of the economy and we did not find any effects for junior coalition partners.
Acknowledgements
An earlier version of this article was presented at the 6th ECPR General Conference (Reykjavik, 25-27
August 2011). We thank Eric Bélanger, Michael Lewis-Beck and the other conference participants for their comments. We are also very grateful to the two anonymous reviewers of this journal for their remarks and insights. Ruth Dassonneville thanks the FWO Research Foundation for its generous support.
References
Anderson, C. J. (2000) Economic voting and political context : A comparative perspective. Electoral
Studies, 19(2/3), 151-170.
Arzheimer, K. & Evans, J. (2010) Bread and butter à la française: Multiparty forecasts of the French legislative vote (1981-2007). International Journal of Forecasting, 26(1), 19-31.
Bélanger, E. & Gélineau, F. (2010) Does perceived competence matter? Political parties and economic voting in Canadian federal elections. Journal of Elections, Public Opinion and Parties, 20(1), 83-101.
Bellucci, P. (2010) Election cycles and electoral forecasting in Italy, 1994-2008. International Journal of
Forecasting, 26(1), 54-67.
Campbell, J. E. (2004) Introduction - the 2004 presidential election forecasts. PS Political Science &
Politics, 37(4), 733-735.
Campbell, J. E. (2010) Forecasts of the 2010 midterm elections. PS Political Science & Politics, 43(4), 625-626.
Campbell, J. E. & Lewis-Beck, M. S. (2008) US presidential election forecasting: An introduction.
24 De Winter, L., Swyngedouw, M. & Dumont, P. (2006) Party system(s) and electoral behaviour in
Belgium: From stability to balkanisation. West European Politics, 29(5), 933-956.
Delwit, P. (2009) Les partis politiques en Belgique., Bruxelles, Éditions de l'Université Libre de Bruxelles.
Deschouwer, K. (2009) The politics of Belgium. Governing a divided society, Basingstoke, Palgrave Macmillan.
Geys, B. & Vermeir, J. (2008) Institutions, economic performance and political support: New evidence from Belgium, 1984-2007. Wissenschaftszentrum Berlin.
Hooghe, M. & Dassonneville, R. (2013) Party members as an electoral linking mechanism. An election forecasting model for political parties in Belgium, 1981-2010. Party Politics, 19.
Hooghe, M. & Deschouwer, K. (2011) Veto players and electoral reform in Belgium. West European
Politics, 34(3), 626-643.
Key, V. O. J. (1966) The responsible electorate: Rationality in presidential voting 1936-1960, Cambridge, Harvard University Press.
Lebo, M. J. & Norpoth, H. (2006) The PM and the pendulum : Dynamic forecasting of British elections.
British Journal of Political Science, 37(1), 71-87.
Lewis-Beck, M. S. (1997) Who's the chef? Economic voting under a dual executive. European Journal o f
Political Research, 31(3), 315-325.
Lewis-Beck, M. S. (2005) Election forecasting: Principles and practice. British Journal of Politics and
International Relations, 7(2), 145-164.
Lewis-Beck, M. S. (2006) Does economics still matter? Econometrics and the vote. Journal of Politics, 68(1), 208-212.
Lewis-Beck, M. S. & Jêrôme, B. (2010) European election forecasting: An introduction. International
Journal of Forecasting, 26(1), 9-10.
Lewis-Beck, M. S. & Stegmaier, M. (2000) Economic determinants of electoral outcomes. Annual Review
25 Lewis-Beck, M. S. & Tien, C. (2011) Election forecasting. In Clements, M. P. & Hendry, D. F. (Eds.)
Oxford handbook on economic forecasting. New York, Oxford University press.
Nadeau, R., Lewis-Beck, M. S. & Bélanger, É. (2010) Electoral forecasting in France: A multi-equation solution. International Journal of Forecasting, 26(1), 11-18.
Nadeau, R., Niemi, R. G. & Yoshinaka, A. (2002) A cross-national analysis of economic voting: Taking account of the political contexts across time and nations. Electoral Studies, 21(3), 403-423. Norpoth, H. & Gschwend, T. (2010) The chancellor model: Forecasting German elections. International
Journal of Forecasting, 26(1), 42-53.
Powell, G. B. & Whitten, G. D. (1993) A cross-national analysis of economic voting: Taking account of the political context. American Journal of Political Science, 37(2), 391-414.
Scarrow, S. (1996) Parties and their members. Organizing for victory in Britain and German y, Oxford, Oxford University Press.
Sinardet, D. (2007) Wederzijdse mediarepresentaties van de nationale "Andere": Vlamingen, Franstaligen en het Belgische federale samenlevingsmodel. Faculteit Politieke en Sociale Wetenschappen. Antwerpen, Universiteit Antwerpen.
Stegmaier, M. & Lewis-Beck, M. S. (2009) Learning the economic vote: Hungarian forecasts, 1998-2010.
Politics & Policy, 37(4), 769-780.
Van Haute, E. (2011) Party membership: An under-studied mode of political participation. In Van Haute, E. (Ed.) Party membership in Europe: Exploration into the anthills of party politics. Brussels, Editions de l'Université de Bruxelles.
Whiteley, P. (2011) Is the party over? The decline of party activism and membership across the democratic world. Party Politics, 17(1), 21-44.