S1
Supporting Information for:
Multinuclear Magnetic Resonance Tracking of Hydro,
Thermal and Hydrothermal Decomposition of CH
3NH
3PbI
3
Abdelrahman M. Askar,1† Guy M. Bernard,2† Benjamin Wiltshire,1 Karthik Shankar1,3 and Vladimir K. Michaelis2*
1- Department of Chemistry, University of Alberta, Edmonton, Alberta, Canada, T6G 2G2
2- Department of Electrical Engineering, University of Alberta, Edmonton, Alberta, Canada, T6G 1H9 3- NRC National Institute for Nanotechnology, Edmonton, Alberta, Canada, T6G 2M9
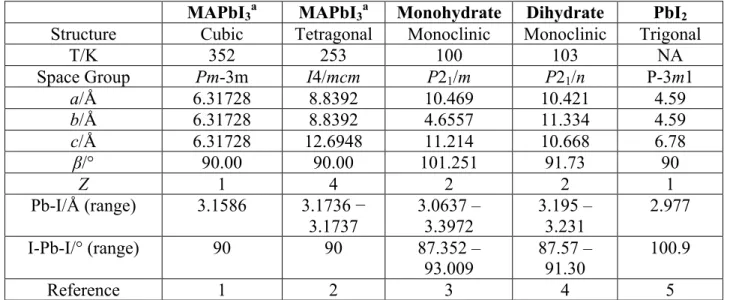
Table S1. Crystal Structure Parameters and Pb Coordination for MAPbI3 and its Decomposition Products.
MAPbI3a MAPbI3a Monohydrate Dihydrate PbI2
Structure Cubic Tetragonal Monoclinic Monoclinic Trigonal
T/K 352 253 100 103 NA
Space Group Pm-3m I4/mcm P21/m P21/n P-3m1
a/Å 6.31728 8.8392 10.469 10.421 4.59 b/Å 6.31728 8.8392 4.6557 11.334 4.59 c/Å 6.31728 12.6948 11.214 10.668 6.78 β/° 90.00 90.00 101.251 91.73 90 Z 1 4 2 2 1 Pb-I/Å (range) 3.1586 3.1736 − 3.1737 3.0637 – 3.3972 3.195 – 3.231 2.977 I-Pb-I/° (range) 90 90 87.352 – 93.009 87.57 – 91.30 100.9 Reference 1 2 3 4 5
a. MAPbI3 may also be found in three phases, orthorhombic below 162.7 K, tetragonal between 162.7 and 326.6 K, or in the cubic phase, above 326.6 K.6 Data for the latter two phases are given here.
S3
Figure S1: (a) Flow cell apparatus used to control the relative humidity for the various treatments with MAPbI3. The yellow powder in the petri dish is the product of MAPbI3 following prolonged exposure to humidity. (b) Image of MAPbI3 powder sample after seven days in the humidity cell (RH = 80%, T = 294 K). (c) Image of as-prepared monohydrate sample prior to vaccum drying step.
(a)
(b)
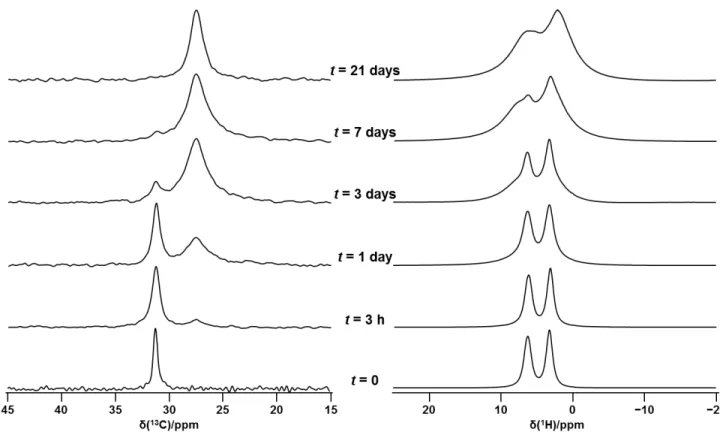
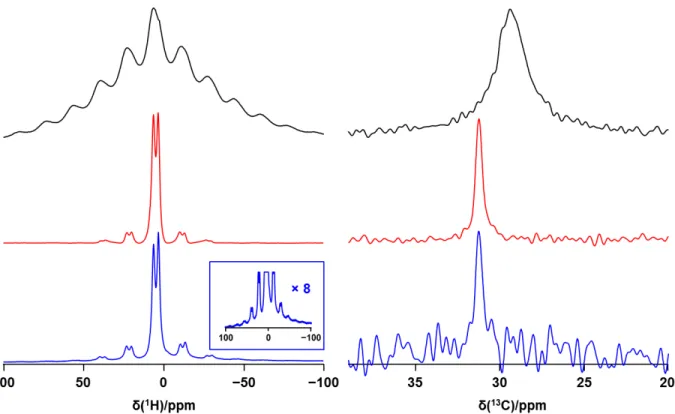
Figure S2: 13C (left) and 1H (right) MAS NMR spectra of CH
3NH3PbI3 exposed to 80 % RH for the indicated times. Spectra were acquired at 294 K at 7.05 T (300 MHz 1H) with a spinning frequency of 5 kHz for the 13C spectra and 12 kHz for the 1H spectra.
S5
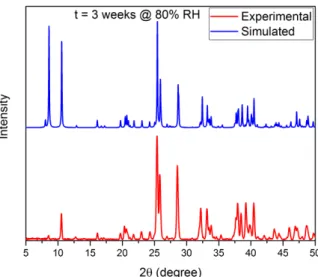
Figure S3: XRD pattern of MAPbI3 placed in the humidity cell at 80% RH for 3 weeks and simulated pattern of the monohydrate. The simulated pattern is based on the reported single-crystal data (Imler, G. H.; Li, X.; Xu, B.; Dobereiner, G. E.; Dai, H.-L.; Rao, Y.; Wayland, B. B. Chem. Comm. 2015, 51, 11290).
Figure S4: 207Pb NMR spectra of MAPbI3·H2O, acquired at 11.75 T at 324 K. A total of 360 transients with a recycle delay of 5 s were used to acquire each spectrum. The times on the right indicate the time after the temperature was initially achieved. The higher noise in the 1500 to 2000 ppm range is attributed to interference from a local FM radio station (see Experimental Section of the manuscript).
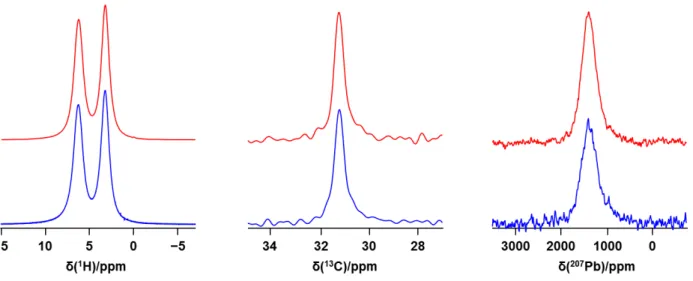
Figure S5. Comparison of 1H, 13C and 207Pb NMR spectra for MAPbI
3 (upper traces, red) and of the sample after it was subjected to 7 days at 80 % RH, then heated to 341 K (lower traces, blue). Spectra were acquired at 7.05 T at 294 K, with a spinning frequency of 12 kHz (1H), 5 kHz (13C) or 0 kHz (207Pb).
Figure S6. Comparison of 1H, 13C and 207Pb NMR spectra for MAPbI
3 (upper traces, red) and of the sample after it was subjected to 11 days at 40 % RH (lower traces, blue). Spectra were acquired at 7.05 T at 294 K, with a spinning frequency of 12 kHz (1H), 5 kHz (13C) or 0 kHz (207Pb).
S7
Figure S7. Comparison of 1H and 13C MAS NMR spectra for MAI (upper traces, black), MAPbI
3 (middle traces, red) and of the sample following the addition of 200 µL H2O(l) (lower traces,
blue). The inset shows the 1H spectrum of the latter with its vertical scale multiplied by 8. Spectra were acquired at 7.05 T at 294 K, with a spinning frequency of 5 kHz.
Figure S8. Comparison of 1H and 13C MAS NMR spectra for MAI (upper traces, black), MAPbI3 (middle traces, red) and of the sample after it was subjected to 8 days at 45 % RH at T = 358 K (lower traces, blue). Spectra were acquired at 7.05 T at 294 K, with a spinning frequency of 12 kHz for 1H and 5 kHz for 13C.
Figure S9. Comparison of 1H, 13C and 207Pb NMR spectra for MAPbI
3 (upper traces, red) and of the sample after it was left in a furnace for 4 days at 378 K (lower traces, blue). Spectra were
S9
Figure S10. Comparison of 13C NMR spectra for the synthesised monohydrate (upper trace, red) and the
slowly annealed 21-day monohydrate (lower trace, blue) within the humidifying chamber (MAPbI3 at t=0
converting to highly crystalline monohydrate, t=21 days). Spectra were acquired at 7.05 T at 294 K, with a spinning frequency of 5 kHz (13C).
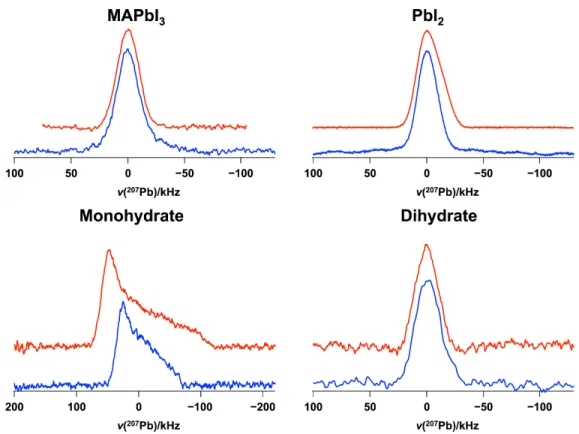
Figure S11. 207Pb NMR spectra of stationary samples of MAPbI
3, the monohydrate, the dihydrate and PbI2, acquired at 11.75 T (upper traces, red) and 7.05 T (lower traces, blue) at 294 K. To facilitate comparisons, the center-of-mass chemical shifts were set to 0.0 kHz for all spectra; see Table 1 in the manuscript for their actual values.
Figure S12. Simulated (red) and experimental (black) 207Pb VOCS of the monohydrate obtained at 7.05
and 11.75 T. Spectra were simulated with δiso = 485 ppm, Ω = 1650 ppm and κ = 0.8.
References:
1 Weller, M.T.; Weber, O.J.; Henry, P.F.; Di Pumpo A.M.; Hansen, T.C. Chem. Commun.
2015, 51, 4180.
2 Yamada, Y.; Yamada, T.; Phuong, L. Q.; Maruyama, N.; Nishimura, H.; Wakamiya, A.; Murata, Y.; Kanemitsu, Y. J. Am. Chem. Soc. 2015, 137, 10456−10459.
3 Imler, G.H.; Li, X.; Xu, B.; Dobereiner, G.E.; Dai, H.-L.; Rao, Y.; Wayland, B.B. Chem. Commun. 2015, 51, 11290−11292.
4 Wakamiya, A.; Endo, M.; Sasamori, T.; Tokitoh, N.; Ogomi, Y.; Hayase S.; Murata, Y. Chem. Lett. 2014, 43, 711.
5 PDF 00-007-0235.
6 (a) Knop, O.; Wasylishen, R.E.; White, M.A.; Cameron, T.S.; Van Oort, M.J.M. Can. J. Chem., 1990, 68, 412. (b) Onoda-Yamamuro, N.; Matsuo, T; Suga, H. J. Phys. Chem. Solids, 1990, 51, 1383-1395.