HAL Id: hal-01436164
https://hal.archives-ouvertes.fr/hal-01436164
Submitted on 16 Jan 2017
HAL is a multi-disciplinary open access
archive for the deposit and dissemination of
sci-entific research documents, whether they are
pub-lished or not. The documents may come from
teaching and research institutions in France or
abroad, or from public or private research centers.
L’archive ouverte pluridisciplinaire HAL, est
destinée au dépôt et à la diffusion de documents
scientifiques de niveau recherche, publiés ou non,
émanant des établissements d’enseignement et de
recherche français ou étrangers, des laboratoires
publics ou privés.
Evaluation of Learner Performance during Practical
Activities: an Experimentation in Computer Education
Rémi Venant, Philippe Vidal, Julien Broisin
To cite this version:
Rémi Venant, Philippe Vidal, Julien Broisin. Evaluation of Learner Performance during Practical
Activities: an Experimentation in Computer Education. 16th IEEE International Conference on
Advanced Learning Technologies (ICALT 2016), Jul 2016, Austin, Texas, United States. pp. 237-241.
�hal-01436164�
O
pen
A
rchive
T
OULOUSE
A
rchive
O
uverte (
OATAO
)
OATAO is an open access repository that collects the work of Toulouse researchers and
makes it freely available over the web where possible.
This is an author-deposited version published in :
http://oatao.univ-toulouse.fr/
Eprints ID : 17246
The contribution was presented at ICALT 2016 :
http://www.ask4research.info/icalt/2016/
To cite this version :
Venant, Rémi and Vidal, Philippe and Broisin, Julien
Evaluation of Learner Performance during Practical Activities: an
Experimentation in Computer Education. (2016) In: 16th IEEE International
Conference on Advanced Learning Technologies (ICALT 2016), 25 July 2016 -
28 July 2016 (Austin, Texas, United States).
Any correspondence concerning this service should be sent to the repository
administrator:
[email protected]
Evaluation of Learner Performance during Practical Activities: an Experimentation
in Computer Education
Rémi Venant, Philippe Vidal, Julien Broisin
Institut de Recherche en Informatique de Toulouse (IRIT) University of Toulouse, France
{remi.venant, philippe.vidal, julien.broisin}@irit.fr
Abstract— This paper addresses learning analytics for
evaluation of learners performance in remote laboratories. The objectives we identified to provide self- and social awareness while learners are practicing in their virtual learning environment are threefold: (1) the definition of a performance metric that requires no assessment tests, (2) the tracking of data to infer that metric in real time, and (3) the visualization of the performance metric without impacting learners’ cognitive load. To support these needs, we propose (i) a metric related to the technical rightness of instructions carried out by learners, (ii) a generic learning analytics framework featuring an enriching engine able to infer indicators, and (iii) two distinct visualization tools. These proposals have been implemented in Lab4CE, our remote laboratory for computer education, and experimented in an authentic learning context. This experimentation showed that most students have significantly used both visualization tools, and that their usage decreased while the overall learners performance increased.
Keywords- learner performance; learning analytics; awareness tools; remote laboratory; computer education.
I.! INTRODUCTION
Virtual and remote laboratories (VRL) rely on inquiry-based learning that leads, among other outcomes, to knowledge building, deep learning and reflection [1]. Within these systems, learners have to reuse the theoretical knowledge they acquired during lectures by manipulating and analyzing real and/or virtual remote objects. VRL are complex systems that require solving various hardware and software issues. Thus, until now, researches in this field have mainly focused on architectural design [2], queuing algorithms [3], load balancing [4] or standardization [5]. However, some studies demonstrated that the pedagogical artifacts around the lab are of most importance when it comes to engage learners in this type of activity [6].
Within online learning environments, (self-)evaluation of learners performance represents a critical information that must be provided to users [1]. A common approach consists in using learning analytics and (social) awareness tools to build dashboards that return feedback about students' overall results [7], their global level of performance [8], strengths and weaknesses [9], or about precise concepts through computer-based assessments [10]. These tools all evaluate learners performance by addressing acquisition of theoretical concepts and knowledge. However, in the context of practical activities, such evaluation techniques become inappropriate, as they do not evaluate how learners are able to reuse and apply their theoretical knowledge when they are faced with a concrete and practical situation.
We address in this article the question of providing learners with a remote laboratory featuring self- and social awareness tools reflecting their level of performance. The presented work was achieved in the context of Lab4CE, a remote laboratory for computer education [11]. Our approach stands on learning analytics processes to track and analyze interactions between learners and the remote lab, and to infer relevant pedagogical indicators exposed to users through various visualization technics.
The next section exposes the requirements to evaluate learners’ performance in the context of remote practical activities. Section 3 briefly presents Lab4CE and introduces new learning analytics capabilities able to compute educational indicators; we also propose a metric of performance that fits our pedagogical and technical contexts. On the basis of this metric, we then design two awareness tools to report on learners’ level of performance while they are practicing in the remote laboratory; details of actions carried out by learners can be visualized as well. Finally, we discuss an experimentation conducted in an authentic learning context to evaluate our contributions.
II.! REQUIREMENTS FOR LEARNER EVALUATION IN VRL Rich dashboards offering many visualization and exploration features seem to be a common exploitation of learning analytics for evaluation of learners performance: in [12; 13], tracking data (expressed using the Contextualized Attention Metadata or the xAPI formats) are analyzed and then exposed to users in sophisticated dashboards. Tough, the context of a practical session in a VRL raises several issues. Awareness about learners’ performance for a session cannot be achieved through traditional performance measurements based on academic achievement tests such as in [14; 15]. Since a practical activity mostly happens before any assessment, the performance needs to be live-computed, based on actions performed during work sessions. For instance, a metric based on the number of programming errors could be used in a programming remote laboratory.
Awareness in the context of a practical learning situation also requires synchronization between learners’ actions and information returned back to them: it should reflect what just happened, which implies near real-time processing and automatic updates of visualization. In [12], data seem to be loaded asynchronously (i.e., on demand), whereas [16] and [17] address this issue through an architecture based on Web Socket to return immediate feedback to learners.
Finally, dashboards usually force learners to switch between the visualization interfaces and the learning environment. Simpler visualizations, embedded as a
lightweight component like in the ROLE context [18], would avoid that additional cognitive load. Indeed, Kirsh [19] suggests avoiding split attention of learners that happens when different components on a screen require multitasking to integrate disparate sources of information.
According to these findings, our objective is to identify and design metrics and lightweight visualizations that fit the context of practical activities. The next section introduces our remote lab environment and details how learners’ performance can be inferred, whereas Section IV exposes two visualization tools based on this metric.
III.! LEARNER PERFORMANCE IN LAB4CE We expose here our remote environment, and focus on the learning analytics features allowing the design, inference, storage and reuse of relevant pedagogical indicators such as the learners’ level of performance.
A.! Lab4CE: a Remote Laboratory for Computer Education
Lab4CE [11] is a VRL environment for computer education standing on virtualization tools and integrating original scaffolding services to improve the user experience and to increase students’ engagement in practical activities. It relies on three scalable distributed components: the laboratory layer, built on a cloud manager, hosts the virtual resources; the middleware layer acts as a broker between the cloud manager and the rich learning interface (RLI) by exposing various REST as well as Web Socket endpoints for real-time streaming requirements; the learning layer exposes different web-based end-user interfaces through the RLI.
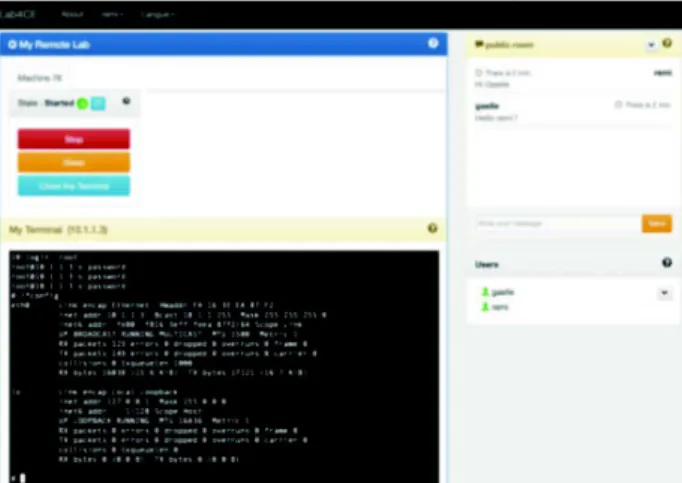
Figure 1. ! The Lab4CE Rich Learning Interface.
For all learners, a set of virtual machines and networks configured properly according to the experiment’s design is available within the cloud manager. Learners can then control (i.e., start, shut down or put in sleep mode) their machine(s) and send instructions through a web-terminal included into the RLI exposed in Figure 1. The end-user interface also integrates communication functions through an instant messaging system, and a collaborative system to let learners work together on the same virtual resources.
From this VRL, a lot of information can be tracked for further analytics. These data include instant messages,
invitations between learners, logged in/logged out & start/stop lab actions, operations on remote resources, and navigation within the RLI. These various data streams can be used to study how learners cope with the system(s) they must manipulate, and thus to infer a performance metric.
B.! The Trace Model
We adopted the xAPI specification to design our trace model, as xAPI is becoming widely used [17; 20]. xAPI proposes a main flexible structure of data able to represent any action carried out by a user on a (learning) system: an xAPI statement comprises a verb, an actor, and an object. It might also include the time when the action was performed, its context, its result, or any attachment.
Figure 2. ! Example of an xAPI Statement.
To represent an instruction executed on a remote machine, we created a custom xAPI Activity object. The instruction “rm –v myfile”, whose the response returned by the resource is “rm: myfile: No such file or directory”, is represented in Figure 2. In addition to the response, the
result element contains two properties: success denotes the
technical rightness of the instruction (see further), and
extensions is used to express others indicators. The learner
information is set in an actor element, while the resource, practical session and experiment define the context of the statement. The tracking framework explained below is in charge to generate these statements.
C.! Learning Analytics Framework
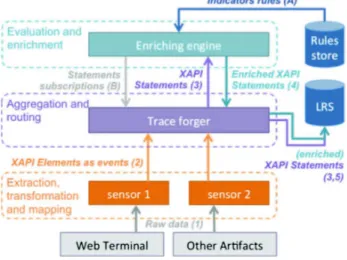
The tracking framework we designed is illustrated in Figure 3 and inspired by existing infrastructures such as the Migen project [21] or [16]. However, unlike these approaches, our framework mainly resides on the client side so as to benefit from distributed computation. This framework aims at generating and storing xAPI statements from the Lab4CE environment; it also supports statements’ enrichment with inferred indicators.
The framework includes three loose-coupled layered components on the client-side, and two stores residing on the server-side. Sensors monitor data on a specific component of the Lab4CE environment (i.e., (1) in Figure 3), map these data in xAPI elements and send them to the trace forger as
events (2). Figure 3 represents two examples of sensors used in Lab4CE: the sensor 1 monitors the web-terminal and sends an event each time an instruction is carried out by a learner. This event includes three elements: the verb, the object and the timestamp. The sensor 2 monitors artifacts of the RLI that gives information about the identity of the user, the resource (s)he is working on, and the lab it belongs to.
The trace forger merges these data to build the matching statement, which is then routed to either the enriching engine (3), or directly to the Learning Record Store (LRS) (5).
The enriching engine adds relevant information to statements with inferred indicators. It receives rules from the Rules Store (A), and subscribes to the forger (B) to receive statements and to infer indicators according to the rules (see next section). Once indicators are inferred, it adds them to the statement and sends it back to the trace forger (4). Finally, the forger sends the enriched statement to the LRS.
Figure 3. ! The Learning Analytics Framework.
We implemented the client-side components with AngularJS, a popular MVC (Model View Controller) framework. This kind of framework facilitates the creation of sensors to monitor data, since it provides automatic bindings between the DOM structure of the web page and the trace model. The rules store and the LRS were implemented with a stack comprising a noSQL database (i.e., MongoDb) to facilitate integration of new statements, and a Spring Java EE layer to expose both REST interfaces and full-duplex communication endpoints (i.e., Web Socket, Ajax/XHR Streaming). The REST interface is used by the trace forger to send statements, while the components that exploit statements can subscribe to one or several streams of statements through the full-duplex endpoints.
D.! Rightness of Instruction as a Performance Metric
Data processed by the learning analytics framework contain, among other things, instructions sent by learners to resources, as well as the matching responses returned back by the remote systems. Being the basis of the experiment path, the sequence of instructions reflects learners’ progression within the experiment. When executed, instructions can be automatically evaluated as technically
right or wrong: the response returned by the remote resource gives information that can be used to infer that state of execution. In the rest of the paper, we will refer to that state as the technical rightness: an instruction that is technically right means it has been properly executed on the resource.
To infer this indicator, our approach consisted in identifying the various error messages that may occur within a Shell terminal when a technically wrong command or program is executed. According to our findings, we specified four rules (R) into the rules store: R1 reveals errors arising when the argument(s) and/or option(s) of a command are incorrect; R2 triggers the error occurring when a command entered by the user does not exist; R3 and R4 indicate if the manual of a command that does not exist has been invoked. Finally, we designed a higher rule (i.e., an indicator rule) that combines the four low-level rules to determine the technical rightness: this rule returns false if the instruction is technically wrong, and true otherwise.
In order to validate the accuracy of these rules, we manually evaluated the technical rightness indicator on a sample of 300 commands produced by students: the evaluation performed by the enriching engine on this sample computed the same result than our manual evaluation for 298 out of the 300 cases (i.e., in 99.3 per cent of all cases). Thus, on the basis of this indicator, we designed two awareness tools dedicated to both learners and educators.
IV.! AWARENESS TOOLS
The visualization tools exposed here are based on instructions carried out by learners, and aim at making learners aware of their level of performance and able to analyze why and what they are doing.
A.! The Social Comparison Tool
Comparative tools are designed to make each learner performance identifiable, and therefore to allow individuals compare with each other. Such social awareness tools consist of social comparison feedback allowing group members to see how they are performing compared to their partners [22]. These tools bring students the feeling of being connected with and supported by their peers [23].
The visualization tool we designed displays a set of progress bars reflecting learners’ level of performance (according to the technical rightness of instructions), on the basis of a simple color code (green if the value is true, red if it is false). A progress bar is a lightweight component that subscribes to the LRS for instruction statements, and then applies filters in order to display information about a particular (group of) learner(s), the current session or the whole practical activity. For each statement, the tool draws a colored shading according to its rightness, scaled on time.
The visualization tool integrated into the Lab4CE environment is illustrated in Figure 4. It provides three different progress bars. The first one (i.e., My current
session) relates the individual performance of the logged-on
learner during the current session; the second one (i.e., My
experiment) reflects the performance since the logged-on
learner started working on the current practical activity, and the third bar (i.e., All participants) exposes the level of
performance of the group of learners enrolled in the practical activity. All progress bars are automatically updated each time a command is executed by a learner.
Figure 4. ! The Social Comparison Tool.
This social comparison tool provides learners with awareness about their own and their peers’ performance, and requires insignificant cognitive efforts from learners: it keeps them working and focusing on the learning activities. Furthermore, tutors become aware of the group level of performance and are thus able to adjust the objectives and/or learning paths of the practical activity. However, this simple visualization tool prevents them to deeply analyze their own actions, as well as those of their peers; the following tool aims at achieving this objective.
B.! The Reflection-on-action Tool
According to [24], reflection is a complex process consisting of returning to experiences, re-evaluating the experiences, and learning from the (re)evaluation process in order to adapt future behavior. This model makes learners self-aware of their learning progress, and capable of taking appropriate decisions to improve their learning [25]. This process can be fostered by technology in the context of online learning environments through reflection-on-action scaffolding tools [26], defined by [25] as the analysis of processes after the actions are completed.
Figure 5. ! The Reflection-on-action Tool.
To review a work session, we propose a dashboard illustrated in Figure 5 to let learners drill down into deeper analysis of their own or peers’ practical work. The form on the top of the interface filters information to visualize according to a given user, session or resource. For each selected resource, a timeline of instructions is exposed into the main panel. Each node represents an instruction, colored according to its technical rightness, whereas details appear at mouse over, in a terminal-like area (see Figure 5).
As a dashboard, this tool cannot be used competitively with the RLI (i.e., learners cannot work on a resource while visualizing this tool). However, it engages learners in a reflective process by highlighting difficulties they experienced, and allows tutors to review learners’ actions and evaluate how they performed.
Both awareness tools have been implemented into the existing Lab4CE environment and experimented in an authentic learning context.
C.! Experimentation: Usage of the Tools
The experimentation took place at the University of Toulouse (France), and involved 32 first year students enrolled in a course about basic Linux commands. Each student could access, through Lab4CE, to her own virtual machine from anywhere, at any time, using any web-compliant device. This study comprised three face-to-face practical sessions of 90 minutes each. Students had to submit two reports: one about the first session, and the other about the second and third sessions.
TABLE I. ! STATISTICS ABOUT USAGE OF THE AWARENESS TOOLS
Practical session 1 2 3
Number of active users 17 32 30 Percent of active users among the group 53.1% 100% 93.8%
Social Comparison Tool (SCT)
Number of active users who displayed the SCT 13 19 18 Percent of active users who displayed the SCT 76.5% 59.4% 60.0% Mean performance score of active users (0 to 100) 84.8 86.0 87.6
Reflection-on-action Tool
Number of active users who analyzed their own work 7 14 12 Percent of active users who analyzed their own work 41.2% 43.8% 40.0% Number of active users who analyzed peers’ work 11 15 9 Percent of active users who analyzed peers’ work 64.7% 46.9% 30.0%
Table 1 presents statistics about the usage of both awareness tools. Active users refer to users who typed at least 30 instructions for a working session. The weak number of such users in the first session (i.e., 17) can be explained by the fact that learners used a browser hosted by Linux-based computers to access the Lab4CE system, and might have used the native Terminal (instead of Lab4CE) to achieve the learning session. During the two other sessions, students worked on a Windows© system to access our environment.
It appears that the reflection-on-action tool has been evenly used to analyze one’s own work, whereas its usage to analyze peers’ work decreased through the sessions. This lessening over time might be explained by the increasing of learners’ level of performance: the better they perform, the less they seem interested in others’ work. In addition to the statistics of Table 1, interesting data are the number of peers’ session analysis the day the first report had to be submitted.
Almost 43% of the students have analyzed at least one peer session using the reflection-on-action tool.
Finally, the social comparison tool, hidden by default within the RLI, has been displayed by most of users at each session. It also follows the same trend: the percent of users displaying the tool decreases when performance increases.
V.! CONCLUSION
We proposed in this paper two awareness tools aiming at exposing to learners their level of performance while they are practicing in a remote laboratory. A social awareness tool reveals the current and general levels of performance, and lets them compare each other's levels. This tool stands on a simple visualization technic in order to be usable during a practical session, i.e. while users perform their learning activity, without requiring specific attention. The reflection-on-action tool, implemented as timelines, allows learners to deeply analyze both their own work and peers’ activity.
Both tools rely on an open and modular learning analytics framework standing on the xAPI specifications and integrating an enriching engine able to infer indicators from collected data. These tools have been successfully integrated into the Lab4CE system, our remote laboratory dedicated to computer education, and experimented in an authentic learning context in order to analyze usage of the awareness tools by learners. It appears that most students have used both tools, and their usage decreased when the overall learners’ level of performance increased.
Instructions should also be evaluated at the semantic level, i.e., considering the scenario of the practical activity: a command might be technically right while being irrelevant to the goal learners have to achieve. To compute instructional
rightness, production of solutions to practical activities has
to be ensured either automatically, or manually by educators. This process will be in the focus of our future research. Finally, the exploitation of the whole set of traces stored within our learning record store leads us to learners profiling and pattern mining that represent other areas of investigation in line with evaluation of learners performance.
REFERENCES
[1] T. de Jong, M. C. Linn, and Z. C. Zacharia, “Physical and Virtual Laboratories in Science and Engineering Education,” Science, vol. 340, no. 6130, 2013, pp. 305–308.
[2] V. J. Harward, J. A. Del Alamo, S. R. Lerman, P. H. Bailey, J. Carpenter, K. DeLong, et al., “The iLab Shared Architecture: A Web Services Infrastructure to Build Communities of Internet Accessible Laboratories,” Proceedings of the IEEE, vol. 96, no. 6, 2008, pp. 931–950.
[3] D. Lowe, P. Newcombe, and Ben Stumpers, “Evaluation of the Use of Remote Laboratories for Secondary School Science Education,” Research in Science Education, vol. 43, no. 3, 2013, pp. 1197–1219. [4] E. Sancristobal, M. Castro, J. Harward, P. Baley, K. DeLong, and J.
Hardison, “Integration view of Web Labs and Learning Management Systems,” Proc. IEEE Global Engineering Education Conference (EDUCON), 2010, pp. 1409–1417.
[5] C. Salzmann, S. Govaerts, W. Halimi, and D. Gillet, “The Smart Device specification for remote labs,” Proc. IEEE Remote Engineering and Virtual Instrumentation (REV), 2015, pp. 199–208. [6] J. E. Corter, S. K. Esche, C. Chassapis, J. Ma, and J. V. Nickerson,
“Process and learning outcomes from remotely-operated, simulated,
and hands-on student laboratories,” Computers & Education, vol. 57, no. 3, 2011, pp. 2054–2067.
[7] M. Prensky, “Khan Academy,” Educational Technology, vol. 51, 2011, p. 64.
[8] K. E. Arnold and M. D. Pistilli, “Course signals at Purdue: using learning analytics to increase student success,” Proc. ACM Learning Analytics and Knowledge (LAK), 2012, pp. 267–270.
[9] C. Howlin and D. Lynch, “Learning and Academic Analytics in the Realizeit System,” Proc. E-Learn: World Conference on E-Learning in Corporate, Government, Healthcare and Higher Education, 2014, pp. 862-872.
[10] T. Miller, “Formative computer! based assessment in higher education: the effectiveness of feedback in supporting student learning,” Assessment & Evaluation in Higher Education, vol. 34, no. 2, 2009, pp. 181–192.
[11] J. Broisin, R. Venant, and P. Vidal, “Lab4CE: a Remote Laboratory for Computer Education,” International Journal of Artificial Intelligence in Education, vol. 25, no. 4, 2015, pp. 1–27.
[12] S. Govaerts, K. Verbert, E. Duval, and A. Pardo, “The student activity meter for awareness and self-reflection,” Proc. ACM CHI 12 Extended Abstracts on Human Factor in Computing Systems, 2012, pp. 869–884.
[13] A. Mikroyannidis and A. Gomez-Goiri, “Deploying learning analytics for awareness and reflection in online scientific experimentation,” Proc. 5e Workshop in Awareness And Reflection in Technology Enhanced Learning (ARTEL), 2015, pp. 105–111. [14] W. W. F. Lau and A. H. K. Yuen, “Modelling programming
performance: Beyond the influence of learner characteristics,” Computers & Education, vol. 57, no. 1, 2011, pp. 1202–1213. [15] A. D. Ritzhaupt, R. Pastore, and R. Davis, “Effects of captions and
time-compressed video on learner performance and satisfaction,” Computers in Human Behavior, vol. 45, 2015, pp. 222–227. [16] T. Hecking, S. Manske, L. Bollen, S. Govaerts, A. Vozniuk, and H.
U. Hoppe, “A Flexible and Extendable Learning Analytics Infrastructure,” Proc. Advances in Web-Based Learning (ICWL), 2014, pp. 123–132.
[17] T. Rabelo, M. Lama, R. R. Amorim, and J. C. Vidal, “SmartLAK: A big data architecture for supporting learning analytics services,” Proc. Frontiers in Education (FIE), 2015, pp. 1–5.
[18] J. L. Santos, K. Verbert, S. Govaerts, and E. Duval, “Visualizing PLE usage,” 1st Workshop on Exploring the Fitness and Evolvability of Personal Learning Environments, 2011.
[19] D. Kirsh, “A Few Thoughts on Cognitive Overload,” 2000. [20] K. Murray, P. Berking, and J. Haag, “Mobile Learning and ADL's
Experience API,” Connections: The Quarterly Journal, vol. 12, 2012, p. 45.
[21] S. G. Santos, M. Mavrikis, and G. D. Magoulas, “Layered Development and Evaluation for Intelligent Support in Exploratory Environments: The Case of Microworlds,” Proc. International Conference on Intelligent tutoring systems (ITS), 2010, pp. 105–114. [22] N. Michinov and C. Primois, “Improving productivity and creativity in online groups through social comparison process: New evidence for asynchronous electronic brainstorming.,” Computers in Human Behavior, vol. 21, no. 1, 2005, pp. 11–28.
[23] D. B. Lowe, S. Murray, E. Lindsay, and D. Liu, “Evolving Remote Laboratory Architectures to Leverage Emerging Internet Technologies,” Learning Technologies, vol. 2, no. 4, 2009, pp. 289– 294.
[24] D. Boud, R. Keogh, and D. Walker, “What is Reflection in Learning?,” Reflection: Turning Experience into Learning, 1985, pp. 7–18.
[25] D. Davis, M. Trevisan, P. Leiffer, J. McCormack, S. Beyerlein, M. J. Khan, and P. Brackin, “Reflection and Metacognition in Engineering Practice,” Using Reflection and Metacognition to Improve Student Learning, no. 4, 2005, pp. 78–103.
[26] J. Wilson and J. L. Wing, Smart thinking: Developing reflection and metacognition. Curriculum Press, 2008.