HEAD AND NECK
Feasibility of simultaneous PET/MR imaging in the head
and upper neck area
Andreas Boss&Lars Stegger&Sotirios Bisdas&Armin Kolb&Nina Schwenzer&
Markus Pfister&Claus D. Claussen&Bernd J. Pichler&Christina Pfannenberg
Received: 18 June 2010 / Revised: 14 December 2010 / Accepted: 20 January 2011 / Published online: 10 February 2011 # European Society of Radiology 2011
Abstract
Objective The aim of this pilot study was to test and demonstrate the feasibility of simultaneous positron emis-sion tomography (PET) and magnetic resonance imaging (MRI) of the head and upper neck area using a new hybrid PET/MRI system.
Methods Eight patients with malignant head and neck tumours were included in the pilot study. Directly after routine PET/CT imaging with a whole-body system using the glucose derivative 2-[18F]fluoro-2deoxy-D-glucose (FDG) as a radiotracer additional measurements were performed with a prototype PET/MRI system for simultaneous PET and MR imaging. Physiological radiotracer uptake within regular anatomical structures as well as tumour uptake were evaluated visually and semiquantitatively (metabolic ratios) in relation to cerebellar uptake on the PET/MRI and PET/CT systems. Results The MR datasets showed excellent image quality without any recognisable artefacts caused by the inserted PET system. PET images obtained with the PET/MRI system exhibited better detailed resolution and greater image contrast in comparison to those from the PET/CT system. An excellent agreement between metabolic ratios obtained with both PET systems was found: R=0.99 for structures with physiological tracer uptake, R=0.96 for tumours.
Conclusion Simultaneous PET/MRI of the head and upper neck area is feasible with the new hybrid PET/MRI prototype.
Keywords PET/MRI . Hybrid imaging . Head and neck tumours . Oncology
Introduction
Head and neck cancer has an incidence of approximately 10–20 cases per 100,000 persons in Germany with a 3- to 4-times higher risk for male patients [1]. Most of the tumours are squamous cell carcinomas. Selection of an optimal treatment strategy requires the accurate staging of the tumour extent with respect to primary tumour site and size, infiltration of adjacent soft tissue and osseous structures as well as regional lymph node involvement.
Andreas Boss and Lars Stegger equally contributed in the authorship. A. Boss
:
L. Stegger:
N. Schwenzer:
C. D. Claussen:
C. Pfannenberg
Department of Diagnostic and Interventional Radiology, Eberhard-Karls University,
Tübingen, Germany
A. Boss
:
A. Kolb:
B. J. PichlerLaboratory for Preclinical Imaging and Imaging Technology of the Werner Siemens-Foundation, Department for Preclinical Imaging and Radiopharmacy,
Tübingen, Germany L. Stegger
Department of Nuclear Medicine and Institute for Molecular Imaging, University of Münster,
Münster, Germany S. Bisdas
Department of Diagnostic and Interventional Neuroradiology, Eberhard-Karls University,
Tübingen, Germany M. Pfister
Department of Otolaryngology, Head and Neck Surgery, Eberhard-Karls University,
Tübingen, Germany A. Boss (*)
Department of Diagnostic and Interventional Radiology, University Hospital of Zurich,
Rämistr. 100,
8091 Zurich, Switzerland e-mail: [email protected]
Usually morphological imaging is performed by contrast-enhanced computed tomography (CT) or magnetic resonance imaging (MRI). MRI provides several advantages over CT such as increased soft-tissue contrast and reduced artefacts close to the skull base and near metallic tooth implants. As many of the head and neck tumours are sensitive to radiotherapy, the higher soft-tissue contrast of MRI is especially useful for identifying an accurate target volume and critical organs. Salivary glands should be spared from irradiation to prevent postradiotherapy xerostomia [2].
There is increasing evidence that additional metabolic imaging with the glucose derivative [18F]fluoro-deoxy-glucose (FDG), using either dedicated positron emission tomography (PET) devices or combined PET/CT systems, can significantly enhance staging accuracy [3, 4]. FDG-PET may identify tumour infiltration of lymph nodes, in which neither CT nor MRI show characteristic pathological imaging findings. Moreover, it can help to distinguish residual or recurrent disease and post-therapeutic changes. Therefore, FDG-PET can complement MRI and CT imaging [5,6].
While combined PET/CT devices are now firmly established in routine oncological imaging, the PET/MRI technique has only been introduced for initial clinical evaluation. Unlike current PET/CT systems, several of the PET/MRI designs allow for simultaneous instead the sequential data acquisition known from PET/CT. This new generation of hybrid systems combines the excellent anatomical resolution and high soft-tissue contrast of MRI with the highly sensitive evaluation of metabolism and molecular processes achieved with PET. First prototypes of hybrid PET/MRI scanners based on avalanche photodiodes instead of photomultiplier tubes were developed for small animal imaging [7]. The first hybrid PET/MRI systems using the same technology for clinical applications have recently been installed [8]. These prototypes consist of a compact PET system (Siemens BrainPET), which fits into a conventional high-field MRI. The system used for this study combines the PET system with a slightly modified clinical 3.0 T whole body MRI (Siemens Tim Trio).
The aim of this pilot study was to test the feasibility of simultaneous PET/MR imaging of the head and upper neck area in 8 patients with malignant head and neck tumours and to evaluate PET image quality and the quantitation accuracy of the PET/MRI system in comparison to PET/CT.
Materials and methods
Subjects and study protocol
Eight patients with head and neck cancer (7 male, 1 female; age: 42–82 years, median age: 65.5 years) were included in the study between 11/2008 and 11/2009. Patient details are
listed in Table 1. All patients first underwent clinically indicated whole-body FDG-PET/CT imaging for staging and immediately afterwards additional PET/MRI of the head and upper neck region without additional radiotracer administration. The study was approved by the local Ethics committee. All patients gave their written informed consent to the PET/CT and PET/MRI examinations as well as to the scientific evaluation of the data.
PET/CT
Patients fasted overnight (for at least 6 h) before intrave-nous injection of FDG (350–399 MBq, approx. 4 MBq per kg body weight). All patients had blood glucose levels within the normal range. The patients underwent a split PET/CT protocol beginning with whole-body imaging from the upper thorax to the mid-thigh level followed by separate head and neck imaging according to standard clinical protocols. PET/CT data acquisition (Hi-Rez Biograph 16 with a 3D-only PET component, Siemens Healthcare, Knoxville, TN, USA) always started with a contrast-enhanced CT after administration of 100–120 ml Ultravist 370 (Bayer-Schering Pharma AG, Berlin, Germany) for the body imaging and bi-phasic bolus injection of 2×40 ml of the same contrast agent for the head and neck imaging (first bolus 2–3 min prior to the scan, second bolus 30 s prior to the scan, 2 ml/sec injection rate). CT-scan parameters for the head and neck imaging were as follows: 140 kVp (kilovoltage peak), slice thickness 4 mm, no interslice gap, field-of-view 323 mm, reconstruction matrix size 512×512, slice resolution 0.63×0.63 mm, tube current 266 mAs. CT was followed by the PET data acquisition; PET started 60 min after radiotracer injection with 3 min per bed for the body imaging and 4 min for the head and neck imaging. PET data were subsequently reconstructed into transaxial slices (matrix size 256 × 256, voxel size 1.78 mm, corresponding to a transaxial field of view (FOV) of 45.5×45.5 cm) using the manufacturer-provided standard software (Fourier rebinning, 2D ordered-subset expectation maximisation (OSEM) algorithm with 8 iterations, 16 subsets). The CT data were used for attenuation correction. Average transverse and axial spatial resolutions (full width at half maximum) of the Hi-Rez Biograph are 4.61 (5.10) mm and 5.34 (5.91) mm, respectively, at 1 and 10 cm off axis according to NEMA standards [9].
PET/MRI
System
All PET/MRI examinations were performed with a hybrid PET/MRI system capable of simultaneous PET/MRI of the head and upper neck region. The system consists of an
MRI-compatible PET inserted into a slightly modified 3.0 Tesla whole-body MRI (BrainPET and Magnetom Tim Trio, Siemens Healthcare, Erlangen, Germany). The technical specifications of the PET insert have been described previously [8]. In short, the PET detector technology relies on lutetium oxyorthosilicate (LSO) scintillation crystals in combination with MR-compatible avalanche photodiodes instead of photomultiplier tubes. The PET system has a craniocaudal field of view (FOV) of 19.1 cm and a transverse FOV of 32.0 cm. Spatial resolution is 2.5 mm (full width at half maximum) in the centre and 4.5 mm at 10 cm off axis. All image data were acquired in“list mode”, where the individual coincidence events are stored on hard disk with the exact detector location and timing information for retrospective data histogramming and reconstruction.
The modifications of the MRI machine comprise the deactivation of the built-in body transmitter and alterations of the MRI patient handling system to allow for precise mounting of the head-coil within the PET system, thereby matching the two FOVs. It is only possible to scan one bed position (head and upper neck area) since the restricted space within the PET insert precludes movement of the patient’s body. A dedicated birdcage transmit-receive head-coil was used for spin excitation, which was combined with an inner 8-channel receive-only head-coil. The gradient system operates with a maximum gradient strength of 40 mT/m and a slew rate of 200 T/m/sec in all three axes.
Data acquisition
PET and MRI data acquisition were simultaneously started 30 to 60 min after PET/CT imaging. PET data were acquired for 25 min and subsequently rebinned and reconstructed using a 3D OSEM algorithm [10] (matrix size 256×256×153, voxel size 1.25 mm in all directions, corresponding to the aforementioned transaxial FOV of 32.0 cm and craniocaudal coverage of 19.1 cm). PET imaging time was longer than for PET/CT imaging since
with PET/MRI both modalities acquire data simultaneously and total scanning time was governed by MR imaging, so that a longer PET acquisition time came without a time loss. Own previous data (not shown) have indicated that this does not affect the quantification as used within this study. The attenuation maps were computed from 3D MRI datasets applying an algorithm combining pattern recognition and atlas registration [11].
The MRI examination protocol included Gradient-Echo (GRE) localisers, a transverse T1-weighted 3D-encoded GRE sequence for attenuation correction (repetition time (TR)/echo time (TE) 4.6 ms/2.46 ms, excitation angle 10°, matrix size 256×256×160, cubic voxels with a size of 1.25 mm in all directions, bandwidth 590 Hz/px, parallel imaging GRAPPA factor 2), a transverse 2D-encoded Fluid Attenuated Inversion Recovery (FLAIR) sequence (TR/TE 9000/87, echo train length 16, inversion time (TI) 2.5 s, matrix size 256 × 232, in-plane resolution 0.78 mm × 0.78 mm, slice thickness 3 mm, bandwidth 200 Hz/px), a T2-weighted 2D-encoded Fast Spin-Echo (FSE) sequence in transverse, sagittal and coronal orientations (TR/TE 5000/90, echo train length 17, matrix size 512×512, in-plane resolution 0.39×0.29 mm², slice thickness 3 mm, pixel bandwidth 190 Hz/px) as well as a sagittal 3D-encoded Magnetisation Prepared Rapid Acquisition Gradient Echo (MPRAGE) sequence (TR/TE 1900/2.4, TI 0.9 s, matrix size 512×512×338, resolution 0.49 mm×0.49 mm×0.9 mm, bandwidth 190 Hz/px, parallel imaging GRAPPA factor 2). Total acquisition time was approximately 30–40 min. In compliance with Ethics committee regulations, no contrast medium was injected during PET/MRI.
Data analysis
PET and MRI datasets from the simultaneous PET/MRI sessions were transferred to a separate computer system for subsequent data analysis. Image quality of the PET and MR images obtained with the hybrid PET/MRI system was
Table 1 Patient characteristics
Patient Age Gender [m/f] Diagnosis Dose [MBq] Dose per kg body
weight [MBq/kg]
1 42 m squamous cell carcinoma, scalp 399 3.8
2 84 m nasopharyngeal carcinoma 391 4.4
3 66 m nasopharyngeal carcinoma 389 5.1
4 54 f nasopharyngeal carcinoma 386 8.0
5 73 m lymph node metastasis, squamous cell carcinoma, scalp 350 4.7
6 64 m lymph node metastasis, cup syndrome 352 5.4
7 68 m nasopharyngeal carcinoma 381 5.2
visually evaluated by two board-certified radiologists and one board-certified nuclear medicine physician with regard to the visualisation of anatomical structures and malignant tumours and the presence of image artefacts. PET images were compared with those from PET/CT imaging.
Subsequent semiquantitative image analysis was per-formed with the VINCI software package (“Volume Imaging in Neurological Research, Co-Registration and ROIs included”, version 3). For ROI analysis, PET datasets from PET/MRI and PET/CT were co-registered to the T1-weighted 3D MPRAGE dataset with the VINCI software tool“MMM Co-Registration”. Two-dimensional ROIs were drawn on the PET/CT images over regular anatomical structures of the head and neck region with known FDG uptake (base of tongue, gingiva, adenoids of the nasophar-ynx, palatine tonsils, parotid glands, sublingual gland and turbinates) and over tumour manifestations. ROIs were defined on the plane that contained the maximum tracer uptake. Additionally, a large free-hand ROI was drawn over the cerebellum on a slice dissecting the cerebellum at mid-level. All ROIs were copied to the co-registered PET/MRI datasets in order to avoid a bias due to different ROI definitions for the PET/MRI and PET/CT datasets.
As absolute quantification of the PET datasets is not yet possible with the prototype PET/MRI system, the radionu-clide uptake of the above-defined anatomical structures and tumour manifestations was quantified in relation to mean cerebellar uptake, as previously described [12, 13]. The terms mean and maximum metabolic ratios were defined as the ratio of the mean and maximum uptake, respectively, within the head and neck ROIs and the mean cerebellar uptake. The average over all patients of the metabolic ratios for each structure was then determined and termed the average (mean or maximum) metabolic ratio. If the regular anatomical structure was too close to tumour tissue, no ROI analysis was performed on that structure to avoid spill-over errors. For quantification of physiological uptake in regular anatomical structures of the head and neck region only the mean metabolic ratios were calculated; for tumour mani-festations both the mean and maximum metabolic ratios were derived, analogous to the previously described evaluation scheme [12,13].
Results
The MRI datasets acquired during simultaneous PET data acquisition exhibited excellent image quality similar to a conventional 3.0 Tesla Tim Trio system without any recognisable additional artefacts or distortions caused by the PET insert. The PET datasets showed slight streak artefacts, which were most prominent in the sagittal and coronal reformations (Fig.1). These streak artefacts did not
lead to degradation of the tumour visualisation. Because of the higher resolution of the PET component of the PET/MRI system in comparison to the PET component of the PET/CT system, small anatomical structures such as orbicular muscles were better delineated and showed a better contrast to the background. A typical example is given in Fig.2. The axial field of view of the PET insert typically reached caudally only to the level II lymph node regions. The hypopharynx and the larynx were outside of the FOV. In two patients, no malignant tumour tissue was detected within the imaging region of the PET insert: in patient 4 after radiotherapy, no residual tumour tissue was found on either PET/MRI or PET/ CT imaging; whereas in patient 6 a metabolically active lymph node metastasis was identified with the PET/CT system in the level III region, which was outside of the FOV of the PET/MRI system. An example of tracer uptake in lymph node metastases in the upper neck region is provided in Fig.3.
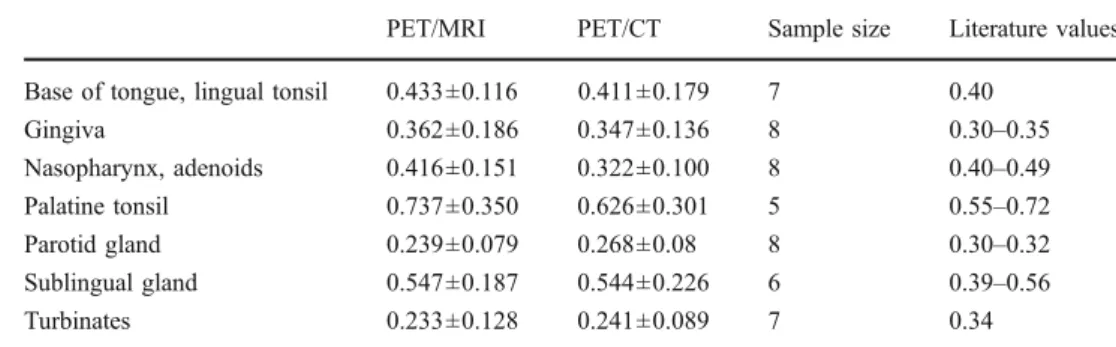
The average (mean) metabolic ratios for the regular anatomical structures are provided in Table 2, additional values taken from the literature are also given. Excellent agreement between the averaged PET/MRI values and the respective PET/CT values was found. The correlation coefficient was R=0.99. Furthermore, the averaged meta-bolic ratios showed good agreement with literature values. In Fig.4, the average values of the physiological uptake are displayed together with the corresponding linear regression line. The average tumour uptake in PET/MRI is signifi-cantly higher compared with PET/CT; however, a certain overlap exists. A scatter plot of individual values for the mean and maximum metabolic ratios for the tumour manifestations in the head and upper neck region is presented in Fig. 5. For the mean metabolic ratios, the correlation coefficient was R=0.92, and for the maximum metabolic ratios the correlation coefficient was R=0.96. The mean metabolic ratios of the tumours are close to the line of identity, whereas the maximum values were slightly higher for the PET/MRI system in comparison to PET/CT.
Discussion
In this pilot study involving 8 patients, it was shown that simultaneous PET/MRI of head and neck cancer is feasible. No notable degradation of MR image quality during simultaneous PET data readout was observed. The spatial resolution of the PET component of the PET/MRI system was visibly better compared with that of conventional PET/ CT, mainly owing to the smaller diameter of the PET detector ring and smaller scintillation crystal sizes; quanti-fication accuracy of tumour uptake in relation to reference tissue was comparable.
The PET insert offers a spatial resolution in the reconstructed datasets of ~3 mm full width at half
maximum (FWHM) compared with 5–6 mm FWHM for the PET/CT system. This is most obvious in the delineation of small anatomical structures such as intraorbital struc-tures. Better spatial resolution may translate into more exact delineation of metabolically active tumour tissue, a better assessment of skull base infiltration and an improved detectability of small lymph node metastases in head and neck cancer.
The computed metabolic ratios of the regular anatomical structures and the tumours are in excellent agreement with the PET/CT data as well as the reported literature values [12, 13]. The maximum metabolic ratios of the tumours
show a linear deviation from the identity line with higher values in the PET/MRI datasets. This observation may be attributed to the higher spatial resolution with smaller spill-over and partial volume effects.
The PET datasets obtained with the PET/MRI prototype system still exhibited slight streak artefacts, which, howev-er, did not notably compromise the assessment of the tumours evaluated. Several design characteristics of the prototype PET/MRI system may contribute to these artefacts. As an example, each PET detector system features gaps between detector blocks; however, the gaps influence the normalisation in small bore-diameter systems like in the
Fig. 1 FDG-PET/MRI of a 65-year-old patient with nasopharyngeal carcinoma (white arrow). T1-weighted MR images in transaxial (top), coronal (middle) and sagittal (bottom) directions are displayed on the
left, FDG-PET and MRI fusion images in the centre and PET images on the right. In the sagittal and coronal reformations, slight streak artefacts, caused by normalisation issues, are visible
Fig. 3 FDG-PET/MRI (top row) and FDG-PET/CT (bottom row) images of bilateral level II cervical lymph node metastases of a squamous cell carcinoma of the scalp in a 73-year-old patient. MRI
and CT images, respectively, are displayed on the left, fusion images in the centre, and PET images on the right
Fig. 2 Sagittal FDG-PET/MRI (top row) and FDG-PET/CT (bottom row) images of a left supraorbital metastasis of a nasopharyngeal carcinoma (arrow) in a 66-year-old patient. T2-weighted MRI and CT,
respectively, are displayed on the left, fusion images in the centre and PET on the right. The data set from PET/MRI shows a better delineation of intraorbicular muscles (arrow heads)
BrainPET more than in whole-body systems. Additionally, the send and receive coils of the MRI system reside inside the PET detector ring which complicates attenuation and scatter correction. As the prototype system is still under constant development, the slight streak artefacts improved significantly over the last 2 years and are expected to be even less visible in the future when all effects are more fully understood and compensated for. Currently, full quantification of regional radiotracer activity is not yet possible. This precludes the calculation of standardised uptake values (SUVs) as an established semiquantitative measure of radiotracer accumulation and local uptake needs to be scaled towards a reference tissue. This current deficit is expected to be amended soon by implementing a calibration workflow.
One disadvantage of this prototype system mainly designed for brain imaging is the small axial field of view of the PET component of approximately 19.1 cm. The typical field of view can be seen in the fused PET/MRI images of Fig. 1. Therefore, hybrid PET/MRI with the current system is limited to head and neck tumours located cranially of the angle of the mandible. Tumours of the
hypopharynx or the larynx currently cannot be assessed with the existing prototype systems. Also, a complete staging of the cervical lymph nodes is not feasible. However, in many cases the optimally correlated PET and MRI datasets obtained with the existing hybrid device may significantly improve assessment of the primary tumour, especially in the skull base and upper pharynx region. Additional whole-body CT or PET/CT may complement PET/MRI for staging purposes. The response to treatment of reference lesions within the PET/ MRI’s field of view may be another important application of this imaging device.
There are two limitations of the current study design: First, according to the approval of the local Ethics committee, the application of contrast medium was not allowed. Therefore, post-contrast MR imaging of the tumour extension could not be compared with the PET datasets. Second, the remaining FDG tracer from the clinically indicated PET/CT was used for PET/MRI. Therefore, the uptake time for FDG was not identical in both measurements. However, metabolic trapping of FDG was relatively stable over the duration of PET/CT and PET/
Fig. 5 Correlation of PET/MRI and PET/CT metabolic ratios for head and neck tumours (mean and maximum values). The line of identity is drawn as a dotted line. The correlation coefficients were 0.92 for the mean values (regression line (solid): y=0.89×+0.02) and 0.96 for the maximum values (regression line (dashed): y=0.80×+0.06)
Fig. 4 Correlation of averaged metabolic ratios of physiological tracer uptake in regular physiological structures. The line of identity is displayed as a dotted line. The correlation coefficient was R=0.99 with the linear regression line (solid line): y=0.85×+0.04
PET/MRI PET/CT Sample size Literature values Base of tongue, lingual tonsil 0.433±0.116 0.411±0.179 7 0.40
Gingiva 0.362±0.186 0.347±0.136 8 0.30–0.35 Nasopharynx, adenoids 0.416±0.151 0.322±0.100 8 0.40–0.49 Palatine tonsil 0.737±0.350 0.626±0.301 5 0.55–0.72 Parotid gland 0.239±0.079 0.268±0.08 8 0.30–0.32 Sublingual gland 0.547±0.187 0.544±0.226 6 0.39–0.56 Turbinates 0.233±0.128 0.241±0.089 7 0.34
Table 2 Mean metabolic ratios of different physiological soft tissue structures of the head and neck calculated from PET/MRI datasets in compari-son to PET/CT and literature values [10,11]
MRI; thus, the datasets are still comparable. The count loss due to radioactive decay between the PET/CT and PET/MRI measurements is more than compensated for by the longer PET acquisition time with the PET/MRI system and an improved sensitivity of the BrainPET compared to the PET component of the PET/CT system.
The present data show that there is a considerable overlap of uptake ratios between tumour and regular anatomical structures even for the PET insert with the better resolution and subsequent lesser spill-over and partial volume effects. The complementary and optimally spatially correlated MRI data may enhance tumour assessment. The advantages, other than improved workflow and patient comfort, of the hybrid PET/MRI technology over PET/CT or retrospectively correlated PET and MRI data remain to be discovered in future clinical studies.
Due to the small craniocaudal field-of-view of only 19.1 cm, the hybrid PET/MRI system applied in this study (Siemens BrainPET) cannot replace PET/CT imaging in most of its indications, e.g. evaluation of regional nodal involvement caudal of the cervical level II, detection of second primary tumours, detection of distant metastases in patients with advanced head and neck malignancies, and evaluation of patients with unknown primaries. Due to its high spatial resolution, the system could potentially be applied with promising results in monitoring of therapy response and in treatment planning especially of new treatment’s modalities such as intensity-modulated radiation therapy or image guided stereotactic radio surgery. The upcoming new generation of hybrid whole-body PET/MRI scanners probably could often replace conventional PET/ CT imaging, which has to be shown in future studies.
In conclusion, we showed that simultaneous PET/MRI of the head and upper neck region is feasible with the available prototype PET/MRI system. Thus, hybrid PET/MRI can be used to obtain the often complementary information from MR and PET imaging very efficiently and with optimal spatial and temporal coregistration. The MR-compatible prototype PET system used (Siemens BrainPET) offers a higher spatial resolution compared with conventional PET/CT systems, which seems advantageous in cases of head and upper neck malignancies.
Acknowledgements We would like to thank the staff of the cyclotron and radiochemistry facilities of Tübingen University and all contributing members of Siemens Healthcare for the continuous support. Furthermore, we acknowledge Heinz-Peter Schlemmer, Thomas Nägele, Roland Bares, Ulrike Ernemann, Martin Heuschmid, Matthias Hofmann, Matthias Reimold and Frédéric Mantlik for their contributions. Financial research support was provided through the “Deutsche Forschungsgemeinschaft” (grants PI771/5-1 and PI771/1-1, and SFB 656 Münster, project C6) as well as through the Swiss Werner Siemens-Foundation. Part of this work was supported by the Herzzentrum Münster e.V. (travel grant to L.S.).
References
1. Guntinas-Lichius O, Wendt T, Buentzel J, Esser D, Lochner P, Mueller A, Schultze-Mosgau S, Altendorf-Hofmann A (2010) Head and neck cancer in Germany: a site-specific analysis of survival of the Thuringian cancer registration database. J Cancer Res Clin Oncol 136:55–63
2. Gardner M, Halimi P, Valinta D, Plantet MM, Alberini JL, Wartski M, Banal A, Hans S, Floiras JL, Housset M, Labib A (2009) Use of single MRI and 18 F-FDG PET-CT scans in both diagnosis and radiotherapy treatment planning in patients with head and neck cancer: advantage on target volume and critical organ delineation. Head Neck 31:461–467
3. Goerres GW, Mosna-Firlejczyk K, Steurer J, von Schulthess GK, Bachmann LM (2003) Assessment of clinical utility of 18F-FDG PET in patients with head and neck cancer: a probability analysis. Eur J Nucl Med Mol Imaging 30:562–571
4. Bruschini P, Giorgetti A, Bruschini L, Nacci A, Volterrani D, Cosottini M, Ursino F, Mariani G, Fattori B (2003) Positron emission tomography (PET) in the staging of the head neck cancer: comparison between PET and CT. Acta Otorhinolaryngol Ital 23:446–453
5. Comoretto M, Balestreri L, Borsatti E, Cimitan M, Franchin G, Lise M (2008) Detection and restaging of residual and/or recurrent nasopharyngeal carcinoma after chemotherapy and radiation therapy: comparison of MR imaging and FDG PET/CT. Radiology 249:203–11
6. Anzai Y, Carroll WR, Quint DJ, Bradford CR, Minoshima S, Wolf GT, Wahl RL (1996) Recurrence of head and neck cancer after surgery or irradiation: prospective comparison of 2-deoxy-2- [F-18] fluoro-D-glucose PET and MR imaging diagnoses. Radiology 200:135–141
7. Judenhofer MS, Wehrl HF, Newport DF, Catana C, Siegel SB, Becker M, Thielscher A, Kneilling M, Lichy MP, Eichner M, Klingel K, Reischl G, Widmaier S, Röcken M, Nutt RE, Machulla HJ, Uludag K, Cherry SR, Claussen CD, Pichler BJ (2008) Simultaneous PET-MRI: a new approach for functional and morphological imaging. Nat Med 14:459–465
8. Schlemmer HP, Pichler BJ, Schmand M, Burbar Z, Michel C, Ladebeck R, Jattke K, Townsend D, Nahmias C, Jacob PK, Heiss WD, Claussen CD (2008) Simultaneous MR/PET imaging of the human brain: feasibility study. Radiology 248:1028–1035 9. Brambilla M, Secco C, Dominietto M, Matheoud R, Sacchetti G,
Inglese E (2005) Performance characteristics obtained for a new 3-dimensional lutetium oxyorthosilicate-based whole-body PET/ CT scanner with the National Electrical Manufacturers Associa-tion NU 2-2001 standard. J Nucl Med 46:2083–2091
10. Comtat C, Bataille F, Michel C, Jones JP, Sibomana M, Janeiro L, Trebossen R (2004) OSEM-3D reconstruction strategies for the ECAT HRRT. In: Conference Record of the 2004 Institute of Electrical and Electronics Engineers (IEEE) Nuclear Science Symposium and Medical Imaging Conference. Piscataway, NJ: IEEE 3492–3496 11. Hofmann M, Steinke F, Scheel V, Charpiat G, Farquhar J, Aschoff
P, Brady M, Schölkopf B, Pichler BJ (2008) MRI-based attenuation correction for PET/MRI: a novel approach combining pattern recognition and atlas registration. J Nucl Med 49:1875–1883 12. Jabour BA, Choi Y, Hoh CK, Rege SD, Soong JC, Lufkin RB, Hanafee WN, Maddahi J, Chaiken L, Bailet J et al (1993) Extracranial head and neck: PET imaging with 2-[F-18]fluoro-2-deoxy-D-glucose and MR imaging correlation. Radiology 186:27–35
13. Rege SD, Chaiken L, Hoh CK, Choi Y, Lufkin R, Anzai Y, Juillard G, Maddahi J, Phelps ME, Hawkins RA (1993) Change induced by radiation therapy in FDG uptake in normal and malignant structures of the head and neck: quantitation with PET. Radiology 189:807–812