RESEARCH PAPER
Top-down analysis of 30
–80 kDa proteins by electron transfer
dissociation time-of-flight mass spectrometry
Luca Fornelli&Julien Parra&Ralf Hartmer&Carsten Stoermer&Markus Lubeck&Yury O. Tsybin
Received: 2 June 2013 / Revised: 16 July 2013 / Accepted: 17 July 2013 / Published online: 10 August 2013 # Springer-Verlag Berlin Heidelberg 2013
Abstract Electron transfer dissociation (ETD)-based top-down mass spectrometry (MS) is the method of choice for in-depth structure characterization of large peptides, small-and medium-sized proteins, small-and non-covalent protein com-plexes. Here, we describe the performance of this approach for structural analysis of intact proteins as large as the 80 kDa serotransferrin. Current time-of-flight (TOF) MS technologies ensure adequate resolution and mass accuracy to simulta-neously analyze intact 30–80 kDa protein ions and the com-plex mixture of their ETD product ions. Here, we show that ETD TOF MS is efficient and may provide extensive se-quence information for unfolded and highly charged (around 1 charge/kDa) proteins of ∼30 kDa and structural motifs embedded in larger proteins. Sequence regions protected by disulfide bonds within intact non-reduced proteins oftentimes remain uncharacterized due to the low efficiency of their fragmentation by ETD. For serotransferrin, reduction of S–S bonds leads to significantly varied ETD fragmentation pattern with higher sequence coverage of N- and C-terminal regions, providing a complementary structural information to top-down analysis of its oxidized form.
Keywords Electron transfer dissociation . ETD .
Electrospray . ESI . Tandem MS . MS/MS . Time-of-flight mass spectrometry . TOF MS . Top-down . Transferrin
Introduction
The term top-down mass spectrometry (TD MS) refers to the structure analysis of intact protein ions by their fragmentation in the gas phase [1]. When applied to a mixture of proteins from different protein families or proteoforms of a single protein family, TD MS translates into a top-down proteomics (TDP). TDP presents several theoretical advantages over bottom-up mass spectrometry-based proteomics (BUP), which consists in the analysis of peptide mixtures derived from proteolysis [2, 3]. In both TDP and BUP, the survey scan (MS1or simply MS) yields information about the total mass of biomolecules, whereas the tandem MS (MS/MS) step confirms the sequence of the selected precursor ion. TDP thus identifies a specific proteoform, whereas BUP is typically employed in identification of protein families [4].
TD MS and TDP analyses are technically more challenging since proteins are generally more difficult to separate, ionize, and fragment than peptides. In addition, the resulting MS/MS spectra are convoluted and data interpretation is not trivial. Recent introduction of novel in-solution protein fractionation techniques, e.g., gel-eluted liquid fraction entrapment electro-phoresis [5], or the adoption of new stationary phases for liquid chromatography (LC) [6] have partially filled the gap between peptide and protein fractionation and separation. However, for MS data acquisition and analysis, new develop-ments and improvedevelop-ments are needed. In terms of hardware, only high-resolution instruments are capable of resolving and distinguishing complex product ion clusters in MS/MS spec-tra of proteins. In terms of software, specific data analysis workflows have to be applied to efficiently reconstruct and
Electronic supplementary material The online version of this article (doi:10.1007/s00216-013-7267-5) contains supplementary material, which is available to authorized users.
L. Fornelli
:
J. Parra:
Y. O. Tsybin (*)Biomolecular Mass Spectrometry Laboratory, Ecole Polytechnique Fédérale de Lausanne, 1015 Lausanne, Switzerland
e-mail: [email protected]
R. Hartmer
:
C. Stoermer:
M. LubeckBruker Daltonics GmbH, Fahrenheitstraße 4, 28359 Bremen, Germany
Present Address: J. Parra
Laboratory for Analysis and Modelling for Biology and
Environment, CNRS UMR 8587, Université d’Evry Val d’Esonne, 91025 Evry Cedex, France
combine the information from MS1 and, most importantly, MS/MS.
Although all the common ion activation methods can be applied to intact proteins, electron-based fragmentations, spe-cifically electron capture dissociation (ECD) [7,8] and elec-tron transfer dissociation (ETD) [9], have been shown to produce a higher sequence coverage than “slow-heating” methods (such as collision-induced dissociation [10] or infra-red multiphoton dissociation [11]) and also have the capability of cleaving disulfide bridges [12]. Importantly, ECD and ETD perform most efficiently (i.e., with low ion activation time resulting in an extensive backbone fragmentation) with highly charged precursors, which is the typical condition present during TD MS or TDP where highly charged protein cations are analyzed. Recently, developments in ultraviolet photodis-sociation (UVPD) and surface-induced disphotodis-sociation MS/MS demonstrated intriguing capabilities specifically for intact protein analysis [13].
Originally, radical-driven TD MS of large proteins was introduced using MS/MS“in time” because the required high resolution was only available for Fourier transform ion cyclo-tron resonance mass spectrometers (FT-ICR MS) and the ability to perform radical-induced fragmentation was only available in ion traps, e.g., ICR ion trap or Paul ion trap [14, 15]. Beginning with comprehensive analysis of ∼10-kDa model proteins, such as ubiquitin [16], the application range of ECD-based TD MS was significantly expanded, delivering a single-amino acid resolved structure of a 29 kDa carbonic anhydrase [17,18] and further analysis of proteins in the 50– 70 kDa range [19]. TD MS of proteins in these mass ranges can be now performed on the time scale of on-line LC.
The quest for radical-driven fragmentation in the wide-spread, low resolution quadrupole (q) mass analyzers and product ion analysis in the high-resolution mass analyzers led to the development of radical-driven top-down mass spec-trometry “in space”. After numerous attempts, ECD was efficiently implemented in a quadrupole mass analyzer that could be coupled to a higher resolution time-of-flight mass spectrometer (TOF MS) [20,21]. However, the real revolution in TD MS“in space” was made by implementing ETD first in a linear ion trap and then in other quadrupole mass analyzers [22]. Currently, the most successful implementations of ETD specifically for protein analysis include ETD on hybrid qTOF MS [23, 24], LTQ Orbitrap FTMS [25] and qFT-ICR MS platforms [26]. These recent technologies have already shown strong potential applications, including the structural analysis of ∼150 kDa intact immunoglobulins G (IgG) on different platforms [27,28].
The ETD fragmentation and subsequent mass analysis using a qTOF MS of bovine carbonic anhydrase and human serotransferrin are presented herein. Carbonic anhydrase was used as a model for medium-size proteins, which can be analyzed without specifically designed sample preparation or
instrumental set-up. Serotransferrin was used to challenge the instrument capabilities with a large protein and investigate the performance of ion manipulation, fragmentation, and detec-tion. Structural study of this protein is complicated in part because its large MW and the presence of 19 disulfide bridges hinders ion–ion interactions in ETD. This structural complex-ity manifested itself by significant differences in the ETD fragmentation patterns depending on serotransferrin oxidation state. To characterize these proteins in detail we applied ded-icated data analysis workflow based on the SNAP2 algorithm (Bruker Daltonics, Bremen, Germany). Our results thus dem-onstrate the current capabilities of high-resolution qTOF MS in sequence analysis of large proteins by TD MS.
Experimental
Sample preparation Bovine carbonic anhydrase and human serum transferrin (serotransferrin) were obtained commercially (Sigma, Taufkirchen, Germany). For direct infusion experiment of carbonic anhydrase and non-reduced serotransferrin, proteins were dissolved in water/acetonitrile/formic acid (50:49.9:0.1, v/v/v) to a final concentration of∼1 μM and used without further purification. Transferrin reduction was obtained by dissolving the lyophilized protein in 50 mM sodium carbonate buffer in presence of 5 mM tris(2-carboxyethyl)phosphine (TCEP, Sig-ma). Prior to infusion, the reduced protein was desalted by centrifugation with microcentrifuge 10 kDa MW cut-off filters (Millipore, Zug, Switzerland).
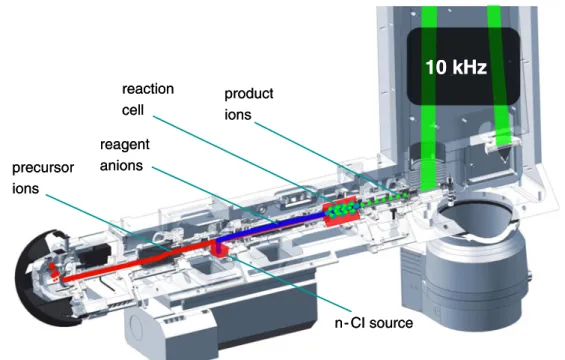
Time-of-flight tandem mass spectrometry Mass measure-ments of intact protein ions and ETD MS/MS were performed on a high-resolution, high-mass accuracy quadrupole time-of-flight (qTOF) mass spectrometer (maXis UHR qTOF MS, Bruker Daltonics GmbH, Bremen, Germany) equipped with electrospray ion source. ETD MS/MS was performed as pre-viously described [24]. The main steps in top-down ETD TOF MS are schematically shown in Fig.1. The differences in ETD of high-mass proteins compared to smaller analytes are: (1) prolonged cation accumulation and radical anion injection times to ensure the accumulation of a sufficient number of analyte ions and, at the same time, the possibility of efficiently inducing ETD; (2) decreased ion–ion reaction time as ETD proceeds faster when highly charged ions are used as precur-sors. After optimization (see Supplementary Information), pre-cursor ion accumulation time was increased up to 800 ms, anion injection time was set to 100 ms, and additional ion– ion interaction time to 40–50 ms. Product ions were transferred to the ion cooler cell from the reaction cell and orthogonally pushed to the TOF mass analyzer at the rate of 10 kHz. The orthogonal acceleration potential was at 10 kV. Acquisition in a broad m/z window (100–5,000 m/z) was performed with signal digitization at 2 GHz, whereas higher resolution MS and MS/
MS data were acquired at a faster digitization rate of 4 GHz for narrower m/z range of 500–3,000 m/z. Intact protein and prod-uct ion mass spectra were acquired in separate direct infusion experiments. For the larger protein, data acquisition time of up to 30 min was employed to average up to 1,000 MS/MS spectra.
Data analysis The MS and MS/MS spectra were analyzed using the dedicated top-down data analysis procedure. Briefly, precursor and product ion mass spectra were summed over the infusion time in each MS and MS/MS experiment with Data Analysis software version 4.0 (Bruker Daltonics). Intact protein mass spectra were submitted to the MaxEntropy deconvolution procedure to yield heterogeneous distribution of neutral (deprotonated) glycosylated proteoforms.
Before ETD data analysis, the SNAP 2 algorithm was used to simulate MS/MS spectra with theoretical isotopic distribu-tions of the peaks that matched the experimental mass spectra with a correlation coefficient of 0.4 or better. Charge states and monoisotopic masses were assigned automatically for the prod-uct ion isotopic distributions in both the experimental and theoretical mass spectra. Manual analysis considering both ex-perimental and theoretical mass spectra was performed to assign ETD-specific c-type and z-type product ions. Alternatively, automatic data analysis was performed by deisotoping the sim-ulated isotopic clusters, keeping only the monoisotopic masses. Following charge state deconvolution, the obtained mass list of
product ions was searched against the known sequence of the proteins to determine the product ion identity and the sequence coverage. The results of both manual and automatic data anal-ysis were compared and pooled to generate the verified protein sequence coverage map. Internal product ions, formed by sec-ondary fragmentation of the primary product ions, have not been considered in the current work.
Results and discussion
Evaluation of ETD top-down mass spectrometry workflow The complete workflow for TD MS includes: (1) sample prepara-tion, (2) intact protein mass measurement in MS mode, (3) sequence analysis in MS/MS mode, and (4) data analysis. The present work employed a state-of-the-art, ETD-enabled high-resolution qTOF mass spectrometer (Fig. 1). Some of its figures of merits for intact protein analysis are: resolution up to 50,000 over a wide m/z range in MS1, and up to 30,000– 40,000 for MS/MS (the resolution is influenced by the com-plexity and the abundance of the product ion population); a scan rate up to 20 Hz; mass accuracy of∼1 ppm (for both MS1 and MS/MS). Remarkably, TOF mass analyzers generally have a higher dynamic range than FT-based instruments, and this characteristic is particularly important for intact protein analysis: for the∼9-kDa ubiquitin the ratio between the mon-oisotopic and the most abundant peaks is∼10, but the same
reaction cell
10 kHz
n- CI source product ions precursor ions reagent anions reaction cell10 kHz
n- CI source product ions precursor ions reagent anionsFig. 1 Sequence of top-down electron transfer dissociation tandem mass spectrometry on a qTOF MS. Step 1: electrospray ionization of the samples in the ion source and precursor ion accumulation in the reaction cell (800 ms). Step 2: ETD reagent injection from the chemical ionization source to the reaction cell (20–100 ms). Step 3: ion–ion reaction in the reaction cell (20–100 ms). Step 4: ion–ion reaction product ions transfer
into the ion cooler. Step 5: ion extraction from the ion cooler into the orthogonal acceleration region. Step 6: orthogonal ion extraction into the time-of-flight tube with an iron mirror (10 kHz, 10 kV). Step 7: ion detection at the multichannel plate with time to digital converter (2 or 4 GHz sampling rate)
ratio increases to∼6E4 for ∼29 kDa carbonic anhydrase, ∼E15 for∼79 kDa transferrin, and up to ∼E32 for a ∼150-kDa IgG. Figure2shows the ETD mass spectrum of 35+precursor ion of carbonic anhydrase. Most intense product ions are shown in the expanded segments. Generally, the envelope of the undissociated charge-reduced species (also referred to as “ETnoD products”) in ETD TD MS of small to medium proteins is positioned in the low m/z range (∼500–1,500 m/z) therefore overlapping with typical product ions of ∼300– 1,400m/z. Here, three different intense ETnoD products (with charge states 34+, 33+, and 32+) were detected, impeding the product ion observation between∼850 and 920 m/z.
The complexity of the product ion mixture for ETD TD MS of carbonic anhydrase is illustrated in Fig.3, top panel. Several partially overlapping clusters of multiply charged ions can be observed in an expanded 675–684 m/z window. Due to the high density of peaks, the first data analysis step is to filter the ion clusters from noise or spurious peaks by matching the experi-mentally obtained clusters with theoretical peaks (Fig.3, middle panel). For a successful noise filtration, high-mass accuracy and
resolution are needed. In addition, high signal-to-noise signal is required to confidently identify the charge state and possibly the monoisotopic peak of each ion cluster. For carbonic anhydrase, the qTOF TD MS allowed the assignment of product ions of up to 14+charge state. Software parameters such as signal-to-noise cut-off can be manually selected to enhance peak identifications. The SNAP2 algorithm matches the experimental and theoretical distributions applying a user-defined correlation coefficient. Due to the complexity of product ion population for a 29 kDa protein, this coefficient is usually set to 0.5 or higher (equivalent to 50 % correlation), but this value can be reduced for larger proteins, where generally the complexity of product ion mixture is higher and the average signal-to-noise ratio is lower. Finally, as illustrated in Fig.3, bottom panel, the identified clusters are deconvoluted and deisotoped, as only the monoisotopic masses are used for the database search or, alternatively, for de novo sequencing. In all our experiments, we imported the sequence of the employed proteins in the software BioTools (Bruker Daltonics) to reduce the time needed for a complete database search.
Fig. 2 Top-down electron transfer dissociation (ETD)-based ESI qTOF MS/MS of carbonic anhydrase (29 kDa). Prior to ETD, a single charge state, [M+35H]35+, of carbonic anhydrase was selected with an isolation window of 30 m/z. Efficient charge reduction upon electron transfer
resulted in electron transfer products without dissociation (ETnoD prod-ucts), specifically [M+35H]34+•, [M+35H]33+••, and [M+35H]32+•••ions. The insets show the expanded regions of the MS/MS mass spectra
Top-down mass spectrometry of oxidized transferrin Mature human serotransferrin (UniProt entry: P02787) is a 679 amino acid-long protein, Scheme 1. First, the intact mass of
non-reduced transferrin was determined (Fig.4, insets). The ob-served charge state distribution was centered at ∼2,200 m/z and included charge states 22–50+ with the most abundant 676 677 678 679 680 681 682 683 m/z
7+
676 677 678 679 680 681 682 683 m/z
7+
11+ 8+ 10+ 9+
deconvolution and de-isotoping
isotopic cluster matching
database or
de novo
sequencing
c417 +
676 677 678 679 680 681 682 683 m/z
z407 + c6611 + c48
8 +
c6010 + c559 +
Fig. 3 Top-down MS/MS data analysis procedure. Example is made for ETD qTOF MS/MS of 29 kDa carbonic anhydrase protein, m/z=675–684 (Fig.2). Step 1: raw data file analysis and matching of theoretical and experimental isotopic clusters. Step 2: deconvolution and deisotoping of the selected theoretical isotopic clusters. Step 3: protein theoretical product ion database search and/or de novo sequencing based on the monoisotopic masses and charge states data (product ion assignment)
Scheme 1 Fragmentation map of intact transferrin after ETD-based ESI qTOF MS/MS. Backbone cleavage sites identified uniquely for the oxidized form of serotransferrin are indicated in black, whereas cleavages characteristic of the reduced form are indicated in red. Common cleavage sites are shown in green. Disulfide bridges are indicated by purple dotted lines
charge states at 35–38+. This corresponded to a charge density of only 1 proton/2.1 kDa. The relatively low protonation level can be presumably explained by the compact conformation retained by the protein in the liquid as well as in the gas phase due to the constraints from S–S bridges, which limit the accessibility of potential protonation sites. The deconvoluted mass spectrum showed a main peak at∼79.5 kDa (Fig.4), left inset. Intact protein mass measurements showed the presence of additional, less abundant, proteoforms, presumably due to protein glycosylation. Although the proteoform characteriza-tion is beyond the scope of this work, it might be useful to recall that the capabilities of qTOF MS in determining with high mass accuracy protein glycoforms have already been demonstrated for 150 kDa intact IgGs (see Electronic Supple-mentary Material, Fig.S1of reference [27]).
One of the most intense precursor ions, the [M+38H]38+ ion, was selected for ETD TOF MS/MS. Fragmentation pa-rameters, specifically (1) cation accumulation time, (2) ion– ion interaction time and (3) radical anion injection time were optimized to maximize the protein fragmentation efficiency. The optimum transferrin cation accumulation time was found to be at∼800 ms, which ensured a sufficient precursor ion population. A similar value was previously applied also to the ETD of∼150 kDa IgG [27]. The ion–ion interaction time was found to be optimal for ETD of transferrin between 40 and 50 ms. At these interaction times, ETD process resulted in the
formation of a significant product ion population without excessive internal fragment production, and incomplete dis-sociation of the charge-reduced species (Fig.S1, Electronic Supplementary Material). The radical anion reaction time can deeply influence the ETD efficiency as it determines the final reagent anion number involved in ETD. For a fixed ion–ion interaction time, a low anion injection time impedes ETD, and conversely at too long injection times the occurrence of mul-tiple, consecutive electron transfer events is highly enhanced, so that many charge-reduced species, low-charged product ions and internal fragments are produced. The final applied value was 100 ms (Fig.S2, Electronic Supplementary Material). The ETD mass spectrum of oxidized transferrin is shown in Fig. 4, bottom. Charge-reduced species (particularly, [M+38H]37+•, [M+38H]36+••, and [M+38H]35+•••ions) domi-nated the mass spectrum in the high m/z region, whereas the product ions were grouped and centered at∼1,000 m/z. Notably, in contrast to what is typically observed for a smaller protein, e.g., carbonic anhydrase, the highly abundant ETnoD products were positioned above 2,000 m/z, thus they did not interfere with the product ion detection and analysis. Most product ions were located below∼1,700 m/z.
An expanded view of the ETD mass spectrum of transferrin containing most of the product ions is presented in Fig.5. The top panel illustrates the capabilities of the qTOF mass spec-trometer to isotopically resolve multiply charged product ions
Fig. 4 Top-down electron transfer dissociation (ETD)-based ESI qTOF MS/MS of transferrin (79 kDa). The insets show ESI qTOF MS of intact transferrin with and without deconvolution. Prior to ETD, a single charge state, [M+38H]38+, of transferrin was selected with an isolation window of 30m/z. Efficient charge reduction upon electron transfer resulted in electron transfer products without dissociation (ETnoD products),
specifically [M+38H]37+•, [M+38H]36+••, and [M+38H]35+•••ions. Prod-uct ions are observed as a group primarily in the m/z=700–1,600 region. Due to their high charge state and lower abundance compared to the ETnoD charge-reduced precursor ions these ions are not resolved. There are no product ions detected above 2,500m/z
present in complex mixture. The assignment of the most abundant product ions shown in the bottom panel indicates that at the applied ETD conditions product ions up to 14+in charge state were detected, with charge states primarily between 5+ and 8+. Almost all identified product ions were c-type, containing information about the N-terminus of the protein. The relative position of the disulfide bridges may explain the fragmentation pattern observed. Close to the C-terminus, two Cys residues (Cys665and Cys674) are located.
These are believed to be involved in the formation of distal S–S bridges with Cys474and Cys402, respectively. The
entire C-terminal portion of serotransferrin is folded in a tight conformation by a number of additional S–S bonds present between Cys402and Cys674. The extent of disulfide-protected
sequence is therefore most likely responsible for the formation of only few z-type ions. Particularly, most z-ions identified derived from backbone cleavages occurring at the C-terminal side of Cys665(i.e., with no need of cleaving a disulfide bond,
but only the peptide bond for product ion formation), with the notable exceptions of z18, z75and z99.
Conversely, at the N-terminus there was a 69-residue loop completely disulfide-free (between Ile49 and Ser117), which
Fig. 5 Expanded views on ETD product ions of transferrin obtained on a qTOF MS. (Bottom) expanded segment, m/z=700–1,500, shows ETD product ions that are assigned to be mainly c-type product ions of transferrin in charge states from 5+ to 14+. Product ions c69and
c56are particularly abundant and
present in a number of charge states. (Top) expanded segment, m/z=975–1,015, shows efficient separation and baseline resolution of multiply charged ETD product ions. For example, the inset shows a well-resolved isotopic distribution of c556+product ion at
∼1,000m/z. The annotated here MS/MS peaks are included into the protein sequence coverage summary presented in Scheme1
interconnects the first disulfide-protected area (from Cys9to
Cys48, with two S–S bonds) to the following one (starting
from Cys118, which is linked to Cys194). As expected, most of
the identified backbone cleavages arose from the unprotected linker, which was almost fully sequenced, and the small N-terminal sequence preceding Cys9. Only four cleavages in the
first disulfide-protected area were identified (i.e., ions c28, c37,
c43, and c44), and no product ions derived from the second area
were observed. Overall, we identified 62 c-ions and 11 z-ions, for a total sequence coverage of∼11 % (Table1).
The capability of ETD (and, more generally, radical-driven ion activation methods) to cleave disulfide bonds has been confirmed to some extent in these experiments with transfer-rin, in addition to those reported earlier for IgGs. Of 73 backbone cleavages reported for the oxidized serotransferrin, 13 derived from disulfide-protected regions, and were mainly located towards the C-terminus. However, recent results by Ganisl and Breuker suggest that, at least when applied to proteins, ECD does not preferentially nor frequently cleaves S–S bonds rather than peptide backbone ones [29], as reported in the past for peptides [12,30]. Nevertheless, the controversy may be limited to the term“preferential”, as backbone cleav-ages from S–S bond-protected regions for many of the inves-tigated proteins were reported. The authors explain these cleavages as resulting from a contribution from either vibra-tional fragmentation prior to ECD, or secondary radical frag-mentation in ECD. Due to the differences in ETD and ECD processes, especially for what concerns the pressure of the ion traps where ion activation and fragmentation take place, fur-ther studies are needed to address this interesting question in relation specifically to ETD.
down mass spectrometry of reduced transferrin Top-down experiment on disulfide-reduced serotransferrin was performed by direct infusion of a protein sample treated overnight with TCEP (Fig.6). As expected, the reduction of S–S bonds induced the exposure of protonation sites not accessible to the acidic solvent in the oxidized protein. As a result, the charge state envelope of the reduced intact protein is significantly shifted towards lower m/z in respect to that of the oxidized counterpart. A large number of high charge state ions
were detected (Fig.6, right inset). Specifically, the charge state distribution included charge states from 40+to 100+, with the most intense transferrin ions located around 900m/z and car-rying 83–88 protons.
To maximize the fragmentation efficiency in radical-driven mass spectrometry, high charge state precursors are usually preferred. Nevertheless, positioning the precursor isolation window around 1,000m/z resulted in a partial overlapping between the ETnoD products and the heavy product ions. An intensity difference was observed between the charge-reduced species and dissociation products. This impeded the identification of fragments above 1,000m/z, therefore we opted for a 300m/z isolation window centered at 1,285m/z, to include a number of charge states of the precursor (from 56+ to 70+) (Fig. S3, Electronic Supplementary Material). These precursor ions ensured improved fragmentation efficiency and the presence of ETnoD products in a region of the mass spectrum not occupied by product ions, beyond 1,400m/z. Different from the oxidized transferrin, the ETD mass spec-trum of the reduced protein showed a large m/z distribution of the product ions, which were not grouped in a specific, limited region but instead spread between∼200 and 1,300m/z, with a variation of intensity that generally is not higher than two- to three-folds over the whole m/z range (Fig.6, left insets). Since the same ETD fragmentation parameters (injection and inter-action times) were applied for both the lower charge states oxidized, and higher charge state reduced forms, it is likely that for reduced transferrin analysis multiple electron transfer events occurred on already formed product ions, reducing their charge state and increasing their final mass-to-charge ratio. This is supported by the identification and assignment of several z+1 ions, generally not detected for the oxidized protein, and presumably obtained through a charge reduction event by secondary electron transfer on a primary product ion. As summarized in Scheme 1, the distribution of the assigned product ions for ETD of reduced serotransferrin was more balanced between c- and z-type ions. Regarding the N-terminal fragments, the backbone cleavages observed were complementary to those previously identified for the oxidized transferrin. Specifically, the protein motif comprised between Cys9and Cys48was highly sequenced (18/30
back-bone cleavages assigned). On the contrary, the loop between Cys48and Cys118was poorly sequenced. The number of
z-type ions was increased, with good sequence coverage in the region between Cys620and the C-terminus. This motif
includ-ed also Cys637, which is linked to Cys418 in the oxidized
protein; a non-complete reduction of this bond might explain the poor or absent sequence coverage for the sequence pre-ceding Cys637. In general, for the reduced protein the average
size of assigned product ions was smaller than for the oxidized counterpart, likely because of a modified conformation and charge location. Here, the only “high-mass” product ions assigned were c101, c102and c104(which were still lighter than
Table 1 Summary of the assigned unique backbone cleavages for oxi-dized or reduced transferrin, and for the combination of the two datasets. Serotransferrin form N-terminal fragments C-terminal fragments Total sequence coverage (%) Oxidized 62 (4)a 11 (9)a 10.7 Reduced 34 39 10.7 Combined 82 41 18.1 a
For the oxidized form, the number of backbone cleavages from disul-fide-protected regions is indicated within parenthesis
other c-ions assigned for the oxidized transferrin). In total, for the reduced form we report 34 c-type ions and 39 z-type ions (Table1). Similarly to the previous experiments on IgG frag-mentation, no complementary fragments for the same back-bone cleavage have been identified.
Conclusions
Our previous results reported for the analysis of immunoglob-ulin G (IgG) had already shown light on the new possibilities open by high-resolution TOF mass spectrometry for the top-down analysis of large proteins. Here, we focused our attention on electron transfer dissociation-based TD MS characterization, for stressing the current possibilities offered by this experimen-tal set-up and further investigating the dependence of protein sequence coverage on the protein structure/conformation and its disulfide bond connectivity. The comparison between oxi-dized and reduced transferrin clarifies, despite the use of a different precursor charge state for the ETD reaction, that the presence or absence of S–S bonds redistribute entirely the fragmentation channels (see Scheme 1, where the backbone cleavages in common between oxidized and reduced precur-sors, signed in green, are a minority). Not only the disulfide-protected regions need two bond cleavages to be sequenced, but also the different charge localization and local conformation
can play an important role in this scenario. Moreover, the comparison between the fragmentation maps of transferrin and IgG represents incontrovertible evidence that ETD is pri-marily directed to the disulfide-free loops interconnecting con-secutive disulfide-protected domains when the proteins are analyzed in non-reduced forms [27]. On the other hand, for these two protein forms the product ion populations are distrib-uted very differently in their ETD mass spectra (a single-maximum distribution for transferrin versus a double-maximum distribution for the IgG), indicating that also the primary structure of the protein influences the final outcome (see Fig. 1 and Schemes 1 and 2 in Ref. [27]). Serotransferrin presents a much more complicated S–S bond connectivity in comparison to the IgG, and this might explain the limited sequence coverage for the C-terminus of its oxidized form, as well as the smaller size of assigned fragments when compared to the IgG. The analysis of the reduced transferrin, indeed, complemented the results obtained for the oxidized form very well: although the extent of fragmentation obtained in each single experiment (i.e., for the oxidized or reduced protein) is the same, the combination of the two increases the final se-quence coverage by∼70 % (from 10.7 to 18.1 %, Table1).
Achieved ETD TD MS performance shall extend the appli-cation range of protein–drug binding characterization to larger proteins, compared to the current level of ubiquitin (8.6 kDa)-size proteins [31,32]. However, further enhancement in (1)
Fig. 6 Top-down electron transfer dissociation (ETD)-based ESI qTOF MS/MS of disulfide bond reduced serotransferrin (79 kDa). The right inset shows ESI qTOF MS data of intact S–S bond reduced transferrin without deconvolution demonstrating a significant shift in precursor ion charge states toward increased protein charging. Prior to ETD, a number of transferrin precursor ions in different charge states, from about
[M+56H]56+to [M+70H]70+, were selected with an isolation window of ±150m/z around m/z 1,285. Efficient charge reduction upon electron transfer resulted in electron transfer products without dissociation (ETnoD products). The observed product ions occupy the m/z region from charge-reduced precursor ions to the lowest m/z detected
sensitivity of detection of multiply charged product ions (to reach high signal-to-noise by averaging a lower number of scans); (2) dissociation of charge-reduced species, which are constantly dominant over the product ions in all the reported mass spectra; (3) detection of complementary heavy product ions as well as (4) internal product ions from secondary frag-mentation will be needed to increase the overall capabilities of ETD-based TD MS and TDP on the qTOF and alternative, e.g., Orbitrap FTMS, platforms.
Acknowledgments Ünige Laskay and Michael Groessl are gratefully acknowledged for motivating discussions. We also thank Anja Resemann for the kind assistance in data analysis. This work was supported by the Swiss National Science Foundation (SNF project 200021-125147/1).
References
1. Cui W, Rohrs HW, Gross ML (2011) Analyst 136:3854–3864 2. Tran JC et al (2011) Nature 480:254–258
3. Tipton JD, Tran JC, Catherman AD, Ahlf DR, Durbin KR, Kelleher NL (2011) J Biol Chem 286:25451–25458
4. Smith LM, Kelleher NL, Consortium for Top Down Proteomics (2013) Nat Methods 10:186–187
5. Tran JC, Doucette AA (2008) Anal Chem 80:1568–1573
6. Zheng S, Yoo C, Delmotte N, Miller FR, Huber CG, Lubman DM (2006) Anal Chem 78:5198–5204
7. Zubarev RA, Kelleher NL, McLafferty FW (1998) J Am Chem Soc 120:3265–3266
8. Zubarev RA, Horn DM, Fridriksson EK, Kelleher NL, Kruger NA, Lewis MA, Carpenter BK, McLafferty FW (2000) Anal Chem 72:563–573
9. Syka JEP, Coon JJ, Schroeder MJ, Shabanowitz J, Hunt DF (2004) P Natl Acad Sci USA 101:9528–9533
10. Wells JM, McLuckey SA (2005) Methods Enzymol 402:148–185 11. Little DP, Speir JP, Senko MW, O'Connor PB, McLafferty FW (1994)
Anal Chem 66:2809–2815
12. Zubarev RA, Kruger NA, Fridriksson EK, Lewis MA, Horn DM, Carpenter BK, McLafferty FW (1999) J Am Chem Soc 121:2857– 2862
13. Shaw JB, Li W, Holden DD, Zhang Y, Griep-Raming J, Fellers RT, Early BP, Thomas PM, Kelleher NL, Brodbelt JS (2013) J Am Chem Soc doi:10.1021/ja4029654
14. Zubarev RA (2003) Mass Spectrom Rev 22:57–77
15. Silivra OA, Kjeldsen F, Ivonin IA, Zubarev RA (2005) J Am Soc Mass Spectrom 16:22–27
16. Cooper HJ, Hakansson K, Marshall AG (2005) Mass Spectrom Rev 24:201–222
17. Sze SK, Ge Y, Oh H, McLafferty FW (2002) Proc Natl Acad Sci USA 99:1774–1779
18. Tsybin YO, Ramstrom M, Witt M, Baykut G, Hakansson P (2004) J Mass Spectrom 39:719–729
19. Ge Y, Lawhorn BG, ElNaggar M, Strauss E, Park JH, Begley TP, McLafferty FW (2002) J Am Chem Soc 124:672–678
20. Baba T, Hashimoto Y, Hasegawa H, Hirabayashi A, Waki I (2004) Anal Chem 76:4263–4266
21. Satake H, Hasegawa H, Hirabayashi A, Hashimoto Y, Baba T, Masuda K (2007) Anal Chem 79:8755–8761
22. Syka JE, Coon JJ, Schroeder MJ, Shabanowitz J, Hunt DF (2004) Proc Natl Acad Sci USA 101:9528–9533
23. Huang TY, McLuckey SA (2010) Proteomics 10:3577–3588 24. Hartmer RG, Kaplan DA, Stoermer C, Lubeck M, Park MA (2009)
Rapid Commun Mass Spectrom 23:2273–2282
25. McAlister GC, Phanstiel D, Good DM, Berggren WT, Coon JJ (2007) Anal Chem 79:3525–3534
26. Kaplan DA, Hartmer R, Speir JP, Stoermer C, Gumerov D, Easterling ML, Brekenfeld A, Kim T, Laukien F, Park MA (2008) Rapid Commun Mass Spectrom 22:271–278
27. Tsybin YO, Fornelli L, Stoermer C, Luebeck M, Parra J, Nallet S, Wurm FM, Hartmer R (2011) Anal Chem 83:8919–8927
28. Fornelli L, Damoc E, Thomas PM, Kelleher NL, Aizikov K, Denisov E, Makarov A, Tsybin YO (2012) Mol Cell Proteomics 11:1758–1767 29. Ganisl B, Breuker K (2012) ChemistryOpen 1:260–268
30. Gunawardena HP, Gorenstein L, Erickson DE, Xia Y, McLuckey SA (2007) Int J Mass Spectrom 265:130–138
31. Hartinger CG, Tsybin YO, Fuchser J, Dyson PJ (2008) Inorg Chem 47:17–19
32. Meier SM, Tsybin YO, Dyson PJ, Keppler BK, Hartinger CG (2012) Anal Bioanal Chem 402:2655–2662