HAL Id: hal-02935234
https://hal.archives-ouvertes.fr/hal-02935234
Submitted on 13 Nov 2020HAL is a multi-disciplinary open access archive for the deposit and dissemination of sci-entific research documents, whether they are pub-lished or not. The documents may come from teaching and research institutions in France or abroad, or from public or private research centers.
L’archive ouverte pluridisciplinaire HAL, est destinée au dépôt et à la diffusion de documents scientifiques de niveau recherche, publiés ou non, émanant des établissements d’enseignement et de recherche français ou étrangers, des laboratoires publics ou privés.
Influence of the Arctic Sea-Ice Regime Shift on Sea-Ice
Methylated Mercury Trends
Amina Schartup, Anne Soerensen, Lars-Eric Heimbürger
To cite this version:
Amina Schartup, Anne Soerensen, Lars-Eric Heimbürger. Influence of the Arctic Sea-Ice Regime Shift on Sea-Ice Methylated Mercury Trends. Environmental Science & Technology Letters, 2020, �10.1021/acs.estlett.0c00465�. �hal-02935234�
Influence of Arctic Sea-Ice Regime Shift on Sea-Ice Methylated Mercury
1
Trends
2 3
Amina T. Schartup,1 Anne L. Soerensen2 and Lars-Eric Heimbürger-Boavida3 4
5
1
Scripps Institution of Oceanography, La Jolla CA, USA 6
2
Swedish Museum of Natural History, Department of Environmental Research and Monitoring, 7
Stockholm, Sweden 8
3 , CNRS/INSU, Mediterranean Institute of Oceanography (MIO) UM
9
110, Marseille, France 10
11 12
Correspondence to: aschartup@ucsd.edu 13
14 15
Abstract
16
Arctic sea-ice regulates the air-sea exchange of volatile mercury (Hg) species like 17
dimethylmercury (DMHg) or elemental Hg, and is known to host Hg methylating microbes that 18
produce neurotoxic and biomagnifying monomethylmercury (MMHg). Arctic sea-ice accounts 19
for 57% of the total primary production in the Arctic Ocean suggesting that it could be the main 20
source of MMHg to arctic food-webs. Despite this, little is known about Hg concentrations and 21
speciation in arctic sea-ice. Here, we report Hg species and show the importance of sea ice 22
composition on sea-ice methylmercury (MeHg = DMHg+MMHg) budgets. We propose that the 23
shift from older sea-ice (lower MeHg) to younger sea-ice (higher MeHg) resulted in a 40% 24
increase in MeHg (per m2 of sea-ice) since 1979 despite a 45% decline in the total sea-ice 25
volume. About 30% of the MeHg sea-ice budget is DMHg, this means that when the sea-ice 26
melts in the summer it could contribute 0.03 - 2.7 pmol m-2 day-1 of DMHg to the atmosphere 27
which is comparable to diffusion from water (0.48 - 2.8 pmol m-2 day-1). This study shows that 28
the MeHg content of rapidly shrinking arctic sea-ice and exposure of sea-ice biota may not be 29
declining as previously thought. 30 31 32 33 TOC abstract 34 35
Keywords: Dimethylmercury, monomethylmercury, climate change, GEOTRACES
36 37 38 39 40 41 42 43
44
Introduction
45
The c c Oc ’ unique physical characteristics and food-web structure influence the 46
biogeochemical cycle of neurotoxic monomethylmercury (MMHg), allowing it to reach high 47
levels in arctic biota.1,2 In the Arctic, MMHg is a health concern for marine wildlife and human 48
communities dependent on arctic ecosystems for hunting and fishing.1,3 Among the physical 49
characteristics, the presence of sea-ice has been identified as a possible explanation for the 50
higher production and biomagnification of MMHg observed in the Arctic Ocean.2 Sea-ice 51
regulates air-sea exchange of volatile Hg species (elemental Hg-Hg0 and dimethylmercury -52
DMHg) by capping the water column and letting Hg build up under the ice.4,5 The mechanism of 53
sea-ice production and melting creates a highly stratified surface water column that has been 54
proposed to enhance MMHg production.6–8 Sea-ice can also impact MMHg exposure through 55
biologically mediated MeHg production within the sea-ice itself, as suggested by Beattie et al.9 56
based on a study of total methylated Hg species (MeHg = MMHg + DMHg) in two arctic sea-ice 57
cores. Several studies showed a positive correlation between chlorophyll a (a proxy for primary 58
production) and MeHg concentration in arctic and antarctic sea-ice, suggesting that MeHg is 59
biologically produced.9–11 Recently, Gionfriddo et al.11 further identified putative Hg 60
methylating bacteria (Nitrospina) in antarctic first-year ice (FYI) and arctic frost flowers, but the 61
mechanism of Hg methylation in sea ice remains unknown. Compared to other arctic MMHg 62
reservoirs the total amount of MMHg stored in sea-ice is small,12 but arctic sea-ice algae and 63
sub-ice phytoplankton account for 57% of the total annual primary production in the Arctic 64
Ocean.13,14 This implies that MMHg produced in the sea-ice and bioaccumulated by sea-ice 65
algae, may contribute disproportionally to arctic biota MMHg exposure. Since 1958, the average 66
sea-ice thickness has declined by over 60% (more than 2 m).15 Between 2002 and 2017, the 67
Arctic has lost more than 50% of its oldest multi-year ice (MYI),15 and is undergoing a regime 68
shift from a system dominated by MYI (until 2011) to a system dominated by seasonal ice (FYI). 69
Despite these concerns, relatively few studies have reported concentrations of Hg and MeHg in 70
sea-ice.5,9,16. To address this gap, we collected 6 ice cores (2 MYI and 4 FYI), brine, frost 71
flowers, under-ice water, and melt pond water and ice during the 2015 German GEOTRACES 72
expedition (GN04). We measured total Hg and MeHg in all the samples and MMHg and DMHg 73
in 3 of the cores. To extend the spatial coverage of this study we combine our data with sea-ice 74
total Hg and MeHg samples from 5 additional locations collected in 2015 during the U.S. 75 GEOTRACES expedition (GN01).5 76 77 Methods 78
Six cores were collected between Aug 25 and Sept 22 during the 2015 GEOTRACES expedition 79
(Figure 1A, Figure S1). At each site, a Kovacs 9 cm diameter corer (Kovacs Enterprise, 80
Roseburg, USA) was used. Once retrieved, the cores were sectioned into 10 cm slices, cleaned 81
with a ceramic knife and transferred into clean plastic bags. The slices were thawed and 82
transferred into trace metal clean bottles (Nalgene FEP Teflon) while still very cold to minimize 83
loss of volatile Hg. All samples were acidified to 0.4 % v:v with double-distilled hydrochloric 84
acid. Temperature and salinity of each slice were measured during and shortly after collection, 85
respectively (Figure S2). Two of the 6 cores were identified as MYI (Cores 2 and 5) on site.17 86
We also measured total Hg and MeHg in 1 brine, 1 frost flower, 7 under ice seawater, 5 melt 87
pond water, 2 melt pond ice, and 3 snow samples (Table S2). All samples were shipped and 88
analyzed for total Hg and MeHg at Harvard University in May 2016 (Figure S3 and S4). We 89
followed well-established analytical procedures for low level total Hg and MeHg 90
measurements.18–20 Detailed methods and nutrient profiles are provided in the Supporting 91
Information (Figure S5). MMHg was measured on samples from which DMHg had been 92
removed by purging onboard prior to acidification. DMHg was calculated as the difference 93
between MeHg and MMHg,21,22 and inorganic Hg (HgII) as the difference between total Hg and 94
MeHg (Figure S3). Table 1 summarizes the Hg speciation and ancillary data in the collected sea-95
ice cores. We calculated the brine volume according to Cox & Weeks.23 96
97
To estimate the impact of the shift from MYI dominated to FYI dominated sea-ice on MeHg, we 98
obtained monthly sea-ice volumes and total sea area trends from 1979 to 2019 from the U.S. 99
National Snow and Ice Data Center.24 We use this information and the empirical relationship 100
between sea-ice volume and MYI area reported by Kwok15 to estimate respective contributions 101
of FYI and MYI to the sea-ice volume and to the sea-ice MeHg budgets from 1979 to 2019. 102
Total Hg concentrations measured in sea-ice cores in this study, 2.72 ± 2.31 pM (n = 78), are not 103
statistically different (1-way ANOVA, p = 0.92, n = 126) from concentrations reported by 104
DiMento et al.,5 2.54 ± 1.46 pM (n = 44; Figure S6). To increase the spatial coverage of this 105
study, we include the DiMento et al.5 sea-ice data in subsequent calculations. For continuity, we 106
rename their cores 7-11 (Figure 1A). The cores in DiMento et al.5 were not identified as FYI or 107
MYI (Table S1), thus we rely on the sea-ice thickness reported for the coring sites in Marsay et 108
al.16 and the relationship between sea-ice thickness and age25 to differentiate the cores (FYI: 109
Core 7, 9; MYI: Cores 8, 10 and 11). All statistical analyses are done in MATLAB (Mathworks, 110
version R2019b). 111
Results and Discussion
113 114
Total Hg varies within cores, with concentrations typically higher near the surface that decline 115
sharply with core depth (Figure 1B; Figure S3). For example, in Core 4, concentrations span 116
from 0.96 to 16.1 pM. Total Hg concentrations in brine, melt ponds water and ice, under ice 117
water and snow fall within the ranges measured in the sea-ice cores and range from 2.6 pM in 118
snow to 17.3 pM in brine (SI Table S2). There is no statistical difference (1-way ANOVA, p = 119
0.34, n = 110) between total Hg concentrations in FYI (3.00 ± 2.56 pM, n = 57) and MYI cores 120
(2.57 ± 2.16 pM, n = 53). 121
122
Similar to total Hg, MeHg varies within each core (Figure S4). For example, MeHg 123
concentrations in Core 3 range from 0.024 to 0.293 pM (Figure 1C). But the location of peaks is 124
not always at the surface, MeHg peaks are also seen at depth in FYI cores (Core 4, Figure 1C). 125
MeHg levels in brine, melt ponds water and ice, under ice water and snow also fall within ranges 126
measured in the sea-ice cores, from 0.05 pM in snow to 0.19 pM in brine (Table S2). MeHg 127
concentrations in MYI (0.026 ± 0.018 pM, n = 52) cores are lower (1-way ANOVA, p < 0.01, n 128
= 109) than in FYI cores (0.102 ± 0.071 pM, n = 57). Since the total Hg (and HgII) 129
concentrations in FYI and MYI cores are not significantly different, %MeHg is lower in MYI 130
than FYI cores. Since HgII concentrations are similar in both types of cores, the difference in 131
MeHg is probably not due to HgII limitation, but may instead be due to biological or chemical 132
differences between the two types of sea-ice cores that affect in situ production or degradation of 133
MeHg from HgII.11,26,27 134
Methylmercury peaks in FYI Cores 3 and 4 seem to be dictated by peaks in DMHg rather than 136
MMHg (Figure 1C). On average DMHg is 34% of MeHg in the 3 cores where DMHg and 137
MMHg were determined, but peaks at >90% at 120 cm in Core 4 (Figure 1C). The distribution of
138
DMHg within cores is consistent with physically driven processes of bubble nucleation and 139
migration observed for inert gases such as argon in FYI.11,28 Since very little field data exists on 140
trace gas bubble formation and diffusion through the sea-ice, modeling approaches have been 141
used to test different hypotheses. Moreau et al.29 showed that upward moving argon gas bubbles 142
explain the change in argon profiles from a bottom peak fou d “E y Sp g” to a surface 143
peak fou d “L Sp g”. They explain the migration by the melting of the sea-ice allowing 144
brine channels to form (increasing the brine volume) and bubbles to rise. This is consistent with 145
our data where Core 3 has a lower brine volume (4.3%) than Core 4 (5.1%, Figure S7). Core 3’ 146
DMHg profile g w w h h “E y Sp g” scenario while DMHg in Core 4 follows the 147
“L Sp g” c o o u et al,29
indicating that DMHg is at different stages of evasion. 148
149
We compare potential DMHg release from sea-ice to air with its diffusion from water column to 150
air. Assuming that DMHg behaves similarly to argon, as described by Moreau et al.,29 it builds 151
up in the sea-ice during the winter months (January through May/June) and is released to the 152
atmosphere in the spring when sea-ice starts melting.30 We calculate that approximately 75 km3 153
day-1 of FYI are lost due to sea-ice melt between peak and low volume in 2015 (120 days). If 154
DMHg concentrations are uniform across all the cores (0.030 pM on average, ranging from 155
0.003 – 0.32 pM), 2.3 mol day-1 of DMHg (0.23- 24 mol day-1) are released from the sea-ice 156
during the melt season. Thus, melting sea-ice could release 0.25 pmol m-2 day-1 of DMHg over 157
the sea-ice area in 2015 to the marine boundary layer (ranging from 0.03 - 2.7 pmol m-2 day-1). 158
This is a conservative estimate since sea-ice only needs to reach a threshold porosity level (5-159
7%), not completely melt, to start releasing DMHg, and some DMHg may have already been lost 160
prior to our sampling.29 To compare the sea-ice DMHg release to diffusion from the water 161
column, we calculate diffusion using a surface water DMHg (1 m; 2015 U.S. GEOTRACES) 162
concentrations from Agather et al.31 most of which were below their detection limit of 0.012 pM, 163
atmospheric DMHg concentrations measured by Baya et al.4 for 30% ice cover (0.037 pmol m-3), 164
and wind speed from Lesins et al.32 (3 m s-1 at 10.4 m). We obtain a diffusion rate from the water 165
column ranging from 0.48 to 2.8 pmol m-2 day-1 depending on the relationship between gas 166
exchange and wind speed used.33–35 This flux is in the same range as our conservative estimate 167
on DMHg degassing from melting sea-ice, which suggests two major impacts on the Arctic 168
Ocean Hg cycle. 1) It shows that sea-ice is an important source of DMHg to the arctic 169
atmosphere, and 2) that the early spring release of DMHg to the atmosphere from melting sea-ice 170
could reduce the concentration gradient between water and air thereby dampening the DMHg 171
diffusion from the water column. 172
173
MeHg levels in FYI cores (0.102 ± 0.071 pM, n = 57) are about 4 times greater than in MYI 174
cores (0.026 ± 0.018 pM, n = 52). Therefore, we hypothesize that all things kept equal a shift 175
from MYI to FYI could significantly impact the sea-ice MeHg budget and average 176
concentrations which could lead to higher sea-ice biota exposure.1,36 To test this, we calculate the 177
temporal variability of the MeHg budget considering the impact of the shifts in FYI and MYI. 178
The purpose of this calculation is to evaluate whether the magnitude of the shift alone, while all 179
other parameters are kept constant, could result in a different overall trend in the sea-ice MeHg 180
budget. We do not consider other potential changes that may dampen or exacerbate MeHg 181
concentrations in sea-ice, nor do we attempt to simulate past MeHg concentrations. Figure 2 A 182
and B illustrate the importance of considering MeHg concentrations in different sea-ice types. In 183
Figure 2A, we applied the average MeHg concentration to the total volume of sea-ice. We find 184
that the average sea-ice budget over the 41-year period is 0.33 Mg (ranging from 0.04 Mg for 185
minimum MeHg and sea-ice volume year, to 1.0 Mg for maximum MeHg and sea-ice volume 186
year). This is consistent with previously reported reservoir sizes of 0.3-2.6 Mg that were based 187
on two sea-ice cores collected in the Beaufort S d ’C u S .9,12 This approach results in 188
a MeHg decline of 5.2 kg year-1 mirroring the overall decline in sea-ice volume. However, if we 189
instead account for the regime shift from MYI to FYI and the different MeHg concentrations in 190
two ice types over the same time period, we arrive at a sea-ice reservoir of 0.16 Mg (ranging 191
from 0.07 to 0.31 Mg). But more importantly, we do not see a declining MeHg trend despite the 192
45% sea-ice volume decline, instead we see a slight increase in MeHg of 1.3 kg year-1. The 193
September trend (minimum sea-ice cover; bottom of the shaded blue area in Figure 2B) is 194
declining 0.5 kg year-1 because of the large decline in total sea-ice volume. The high bound in 195
February (maximum sea-ice cover) is increasing 3.3 kg year-1 driven by the FYI increase over 196
time. The change in the MeHg mass budget corresponds to an increase in mass of MeHg per area 197
of sea-ice from 15 ng m-2 in the 1980s to 21 ng m-2 in the 2010s (orange line on Figure 2B). This 198
suggests a 40% increase in the exposure of sea-ice biota and underlines the importance of 199
understanding MeHg biogeochemistry in different types of sea-ice. 200
201
This study shows that sea-ice plays a role in Hg biogeochemistry that extends beyond “just a 202
c p” o w co um p oc . We find that FYI contains more MeHg (and DMHg) than MYI 203
and calculate that the ongoing shift from a MYI to FYI dominated Arctic Ocean may cancel out 204
the previously expected decline in MeHg contributions from sea-ice. This finding as well as the 205
shortened window between sea-ice melt and peak plankton activity,37,38 may have consequences 206
for the exposure of biota that relies on sea-ice for food and habitat. We also measured relatively 207
large amounts of DMHg in FYI cores, sometimes reaching >90% of MeHg. A DMHg peak was 208
for example found near the bottom of a core where sea-ice algae such as Melosira arctica was 209
present. DMHg could passively diffuse through gills of animals feeding on sea-ice algae39 and 210
the implications of DMHg in sea-ice highlighted in this study needs further investigation. 211
212 213
Acknowledgements:
214
We thank the chief scientist Ursula Schauer, the German GEOTRACES lead scientist Michiel 215
Rutgers van der Loeff, and the sea-ice sampling team Gerhard Dieckmann, Ellen Damm, 216
Christiane Uhlig, Aridane Gonzales Gonzales and Andreas Krell. We also thank Captain 217
Schwarze and the crew of the research icebreaker Polarstern. ATS thanks Elsie Sunderland for 218
years of support and exceptional mentorship and for access to her analytical lab at the Harvard 219
School of Engineering and Applied Science where the reported mercury measurements were 220
performed. ATS thanks Prentiss Balcom for assistance in the lab. LEHB thanks Jeroen Sonke 221
from Geosciences Environment Toulouse for his support and guidance during his postdoc and 222
partial support from the European Research Council (ERC-2010-StG_20091028) to Jeroen 223
Sonke. LEHB also received support from AXA Research Fund and the CNRS Chantier Arctique 224
Français funding via the Pollution in the Arctic System project. 225
226
Figure 1: Mercury concentrations and speciation in arctic sea-ice. Panel (A) is a map showing
the location of sea-ice cores in dark blue (1-6) collected for this study during the 2015 German 228
GEOTRACES cruise, GN04 carried out on board of the research icebreaker Polarstern (PS94, 229
ARK XXIX/3, TransArc-II), and in light blue (7-11) published in DiMento et al.5 and collected 230
during the 2015 U.S. GEOTRACES expedition (GN01). The sea-ice extent is an August 16th, 231
2015 Multisensor Analyzed Sea Ice Extent data product, US National Snow and Ice Data Center. 232
Panel (B) shows total mercury (total Hg) profiles of Cores 3 and 4. Panel (C) shows 233
monomethylmercury (MMHg), dimethylmercury (DMHg) and total methylated mercury (MeHg) 234
distribution in Cores 3 and 4. 235
236
Figure 2: Sea-ice methylmercury (MeHg) budgets calculated from 1979 to 2019. A. Trend
237
when differences in MeHg levels in multi-year and first-year ice are not considered. The shaded 238
area captures the lowest (September) and highest (February) bounds of the sea ice MeHg 239
budgets. B. The MeHg total mass budget, considering different contributions from multi-year 240
and first-year sea-ice, is illustrated by the blue line. The blue shaded area captures the lowest 241
(September) and highest (February) bounds of the sea-ice MeHg budgets. The MeHg mass per 242
unit of sea-ice area is the orange line. 243
References
245
(1) AMAP. Arctic Monitoring and Assessment Program 2011: Mercury in the Arctic; 2011. 246
https://doi.org/10.1017/CBO9781107415324.004. 247
(2) Zhang, Y.; Soerensen, A. L.; Schartup, A. T.; Sunderland, E. M. A Global Model for 248
Methylmercury Formation and Uptake at the Base of Marine Food Webs. Global 249
Biogeochem. Cycles 2020, 34 (2). https://doi.org/10.1029/2019GB006348.
250
(3) Calder, R. S. D.; Bromage, S.; Sunderland, E. M. Risk Tradeoffs Associated with 251
Traditional Food Advisories for Labrador Inuit. Environ. Res. 2019, No. September, 496– 252
506. https://doi.org/10.1016/j.envres.2018.09.005. 253
(4) Baya, P. A.; Gosselin, M.; Lehnherr, I.; Louis, V. L. S.; Hintelmann, H. Determination of 254
Monomethylmercury and Dimethylmercury in the Arctic Marine Boundary Layer. 2015, 255
1–19. 256
(5) DiMento, B. P.; Mason, R. P.; Brooks, S.; Moore, C. The Impact of Sea Ice on the Air-Sea 257
Exchange of Mercury in the Arctic Ocean. Deep. Res. Part I Oceanogr. Res. Pap. 2019, 258
144 (October 2018), 28–38. https://doi.org/10.1016/j.dsr.2018.12.001.
259
(6) Wang, F.; Macdonald, R. W.; Armstrong, D. a; Stern, G. a. Total and Methylated Mercury 260
in the Beaufort Sea: The Role of Local and Recent Organic Remineralization. Environ. 261
Sci. Technol. 2012, 46 (21), 11821–11828. https://doi.org/10.1021/es302882d.
262
(7) Heimbürger, L.; Sonke, J. E.; Cossa, D.; Point, D.; Lagane, C.; Laffont, L.; Galfond, B. 263
T.; Nicolaus, M.; Rabe, B.; van der Loeff, M. R.; et al. Shallow Methylmercury 264
Production in the Marginal Sea Ice Zone of the Central Arctic Ocean. Sci. Rep. 2015, 5, 265
10318. https://doi.org/10.1038/srep10318. 266
(8) Schartup, A. T.; Balcom, P. H.; Soerensen, A. L.; Gosnell, K. J.; Calder, R. S. D.; Mason, 267
R. P.; Sunderland, E. M. Freshwater Discharges Drive High Levels of Methylmercury in 268
Arctic Marine Biota. Proc. Natl. Acad. Sci. 2015, 112 (38), 11789–11794. 269
https://doi.org/10.1073/pnas.1505541112. 270
(9) Beattie, S. A.; Armstrong, D.; Chaulk, A.; Comte, J.; Gosselin, M.; Wang, F. Total and 271
Methylated Mercury in Arctic Multiyear Sea Ice. Environ. Sci. Technol. 2014, 48 (10), 272
5575–5582. https://doi.org/10.1021/es5008033. 273
(10) Cossa, D.; Heimbürger, L.-E.; Lannuzel, D.; Rintoul, S. R.; Butler, E. C. V.; Bowie, A. R.; 274
Averty, B.; Watson, R. J.; Remenyi, T. Mercury in the Southern Ocean. Geochim. 275
Cosmochim. Acta 2011, 75 (14), 4037–4052. https://doi.org/10.1016/j.gca.2011.05.001.
276
(11) Gionfriddo, C. M.; Tate, M. T.; Wick, R. R.; Schultz, M. B.; Zemla, A.; Thelen, M. P.; 277
Schofield, R.; Krabbenhoft, D. P.; Holt, K. E.; Moreau, J. W.; et al. Microbial Mercury 278
Methylation in Antarctic Sea Ice. Nat. Microbiol. 2016, 1 (August), 16127. 279
https://doi.org/10.1038/nmicrobiol.2016.127. 280
(12) Soerensen, A. L.; Jacob, D. J.; Schartup, A. T.; Fisher, J. A.; Lehnherr, I.; St Louis, V. L.; 281
Heimbürger, L. E.; Sonke, J. E.; Krabbenhoft, D. P.; Sunderland, E. M. A Mass Budget 282
for Mercury and Methylmercury in the Arctic Ocean. Global Biogeochem. Cycles 2016, 283
30 (4), 560–575. https://doi.org/10.1002/2015GB005280.
284
(13) Gosselin, M.; Levasseur, M.; Wheeler, P. A.; Horner, R. A.; Booth, B. C. New 285
Measurements of Phytoplankton and Ice Algal Production in the Arctic Ocean. Deep. Res. 286
Part II Top. Stud. Oceanogr. 1997, 44 (8), 1623–1644.
https://doi.org/10.1016/S0967-287
0645(97)00054-4. 288
(14) Boetius, A.; Albrecht, S.; Bakker, K.; Bienhold, C.; Felden, J.; Fernández-Méndez, M.; 289
Hendricks, S.; Katlein, C.; Lalande, C.; Krumpen, T.; et al. Export of Algal Biomass from 290
the Melting Arctic Sea Ice. Science (80-. ). 2013, 339 (6126), 1430–1432. 291
https://doi.org/10.1126/science.1231346. 292
(15) Kwok, R. Arctic Sea Ice Thickness, Volume, and Multiyear Ice Coverage: Losses and 293
Coupled Variability (1958-2018). Environ. Res. Lett. 2018, 13 (10). 294
https://doi.org/10.1088/1748-9326/aae3ec. 295
(16) Chaulk, A.; Stern, G. A.; Armstrong, D.; Barber, D. G.; Wang, F. Mercury Distribution 296
and Transport across the Ocean- Sea-Ice- Atmosphere Interface in the Arctic Ocean. 297
Environ. Sci. Technol. 2011, 45 (5), 1866–1872.
298
(17) Peeken, I.; Primpke, S.; Beyer, B.; Gütermann, J.; Katlein, C.; Krumpen, T.; Bergmann, 299
M.; Hehemann, L.; Gerdts, G. Arctic Sea Ice Is an Important Temporal Sink and Means of 300
Transport for Microplastic. Nat. Commun. 2018, 9 (1). https://doi.org/10.1038/s41467-301
018-03825-5. 302
(18) Munson, K. M.; Babi, D.; Lamborg, C. H. Determination of Monomethylmercury from 303
Seawater with Ascorbic Acid-Assisted Direct Ethylation. Limnol. Oceanogr. Methods 304
2014, 12 (1 JAN), 1–9. https://doi.org/10.4319/lom.2014.12.1.
305
(19) United States Environmental Protection Agency. Method 1631, Revision E: Mercury in 306
Water by Oxidation, Purge and Trap, and Cold Vapour Atomic Fluorescence
307
Spectrometry; Washington, DC, 2002.
308
(20) United States Environmental Protection Agency. Method 1630: Methylmercury in Water 309
by Distillation , Aqueous Ethylation , Purge and Trap, and Cold Vapor Atomic
310
Fluorescence; Washington, DC, 2001.
311
(21) Cossa, D.; Durrieu de Madron, X.; Schäfer, J.; Lanceleur, L.; Guédron, S.; Buscail, R.; 312
Thomas, B.; Castelle, S.; Naudin, J.-J. The Open Sea as the Main Source of 313
Methylmercury in the Water Column of the Gulf of Lions (Northwestern Mediterranean 314
Margin). Geochim. Cosmochim. Acta 2017, 199, 222–237. 315
https://doi.org/10.1016/j.gca.2016.11.037. 316
(22) Rosati, G.; Heimbürger, L. E.; Melaku Canu, D.; Lagane, C.; Laffont, L.; Rijkenberg, M. 317
J. A.; Gerringa, L. J. A.; Solidoro, C.; Gencarelli, C. N.; Hedgecock, I. M.; et al. Mercury 318
in the Black Sea: New Insights From Measurements and Numerical Modeling. Global 319
Biogeochem. Cycles 2018, 32 (4), 529–550. https://doi.org/10.1002/2017GB005700.
320
(23) Cox, G. F. N.; Weeks, W. F. Equations for Determining the Gas and Brine Volumes in 321
Sea Ice Samples. CRREL Rep. (US Army Cold Reg. Res. Eng. Lab. 1982, 29 (102), 306– 322
316. https://doi.org/10.3189/s0022143000008364. 323
(24) Fetterer, F., K. Knowles, W. N. Meier, M. Savoie, and A. K. W. Sea Ice Index, Version 3. 324
NSIDC: National Snow and Ice Data Center. https://doi.org/10.7265/N5K072F8. 325
(25) Tschudi, M. A.; Stroeve, J. C.; Stewart, J. S. Relating the Age of Arctic Sea Ice to Its 326
Th ck , u d du g N ’ ICES d Ic B dg C mp g . Remote Sens. 327
2016, 8 (6). https://doi.org/10.3390/rs8060457.
328
(26) Bowman, J. S.; Rasmussen, S.; Blom, N.; Deming, J. W.; Rysgaard, S.; Sicheritz-Ponten, 329
T. Microbial Community Structure of Arctic Multiyear Sea Ice and Surface Seawater by 330
454 Sequencing of the 16S RNA Gene. ISME J. 2012, 6 (1), 11–20. 331
https://doi.org/10.1038/ismej.2011.76. 332
(27) Bowman, J. S. The Relationship between Sea Ice Bacterial Community Structure and 333
Biogeochemistry: A Synthesis of Current Knowledge and Known Unknowns. Elementa 334
2015, 3, 1–20. https://doi.org/10.12952/journal.elementa.000072.
335
(28) Zhou, J.; Delille, B.; Eicken, H.; Vancoppenolle, M.; Brabant, F.; Carnat, G.; Geilfus, N. 336
X.; Papakyriakou, T.; Heinesch, B.; Tison, J. L. Physical and Biogeochemical Properties 337
in Landfast Sea Ice (Barrow, Alaska): Insights on Brine and Gas Dynamics across 338
Seasons. J. Geophys. Res. Ocean. 2013, 118 (6), 3172–3189. 339
https://doi.org/10.1002/jgrc.20232. 340
(29) Moreau, S.; Vancoppenolle, M.; Zhou, J.; Tison, J. L.; Delille, B.; Goosse, H. Modelling 341
Argon Dynamics in First-Year Sea Ice. Ocean Model. 2014, 73, 1–18. 342
https://doi.org/10.1016/j.ocemod.2013.10.004. 343
(30) Miller, L. A.; Papakyriakou, T. N.; Collins, R. E.; Deming, J. W.; Ehn, J. K.; MacDonald, 344
R. W.; Mucci, A.; Owens, O.; Raudsepp, M.; Sutherland, N. Carbon Dynamics in Sea Ice: 345
A Winter Flux Time Series. J. Geophys. Res. Ocean. 2011, 116 (2), 6058. 346
https://doi.org/10.1029/2009JC006058. 347
(31) Agather, A. M.; Hammerschmidt, C. R.; Lamborg, C. H.; Bowman, K. L. Distribution of 348
Mercury Species in the Western Arctic Ocean (U.S. GEOTRACES GN01). 2016, No. 349
May. https://doi.org/10.1130/abs/2016nc-275172. 350
(32) Lesins, G.; Duck, T.; Drummond, J. Climate Trends at Eureka in the Canadian High 351
Arctic. Atmos. - Ocean 2010, 48 (2), 59–80. https://doi.org/10.3137/AO1103.2010. 352
(33) Wanninkhof, R. Relationship between Wind Speed and Gas Exchange over the Ocean 353
Revisited. J. Geophys. Res. 1992, 97 (C5), 7373–7382. 354
https://doi.org/10.4319/lom.2014.12.351. 355
(34) Liss, P. S.; Merlivat, L. Air-Sea Gas Exchange Rates: Introduction and Synthesis. In The 356
Role of Air-Sea Exchange in Geochemical Cycling; Springer Netherlands: Dordrecht,
357
1986; pp 113–127. https://doi.org/10.1007/978-94-009-4738-2_5. 358
(35) Nightingale, P. D.; Malin, G.; Law, C. S.; Watson, A. J.; Liss, P. S.; Liddicoat, M. I.; 359
Boutin, J.; Upstill-Goddard, R. C. In Situ Evaluation of Air-Sea Gas Exchange 360
Parameterizations Using Novel Conservative and Volatile Tracers. Global Biogeochem. 361
Cycles 2000, 14 (1), 373–387. https://doi.org/10.1029/1999GB900091.
362
(36) Schartup, A. T.; Qureshi, A.; Dassuncao, C.; Thackray, C. P.; Harding, G.; Sunderland, E. 363
M. A Model for Methylmercury Uptake and Trophic Transfer by Marine Plankton. 364
Environ. Sci. Technol. 2018, 52 (2), 654–662. https://doi.org/10.1021/acs.est.7b03821.
365
(37) Post, E.; Bhatt, U. S.; Bitz, C. M.; Brodie, J. F.; Fulton, T. L.; Hebblewhite, M.; Kerby, J.; 366
Kutz, S. J.; Stirling, I.; Walker, D. A. Ecological Consequences of Sea-Ice Decline. 367
Science (80-. ). 2013, 341 (August), 519–525. https://doi.org/10.1126/science.1235225.
368
(38) Wassmann, P. Arctic Marine Ecosystems in an Era of Rapid Climate Change. Prog. 369
Oceanogr. 2011, 90 (1–4), 1–17. https://doi.org/10.1016/j.pocean.2011.02.002.
370
(39) Cossa, D.; Martin, J. M.; Sanjuan, J.; Martint, J.; Sanjuan, J. Dimethylmercury Formation 371
in the Alboran Sea. Mar. Pollut. Bull. 1994, 28 (6), 381–384. 372
https://doi.org/10.1016/0025-326X(94)90276-3. 373
374 375
376
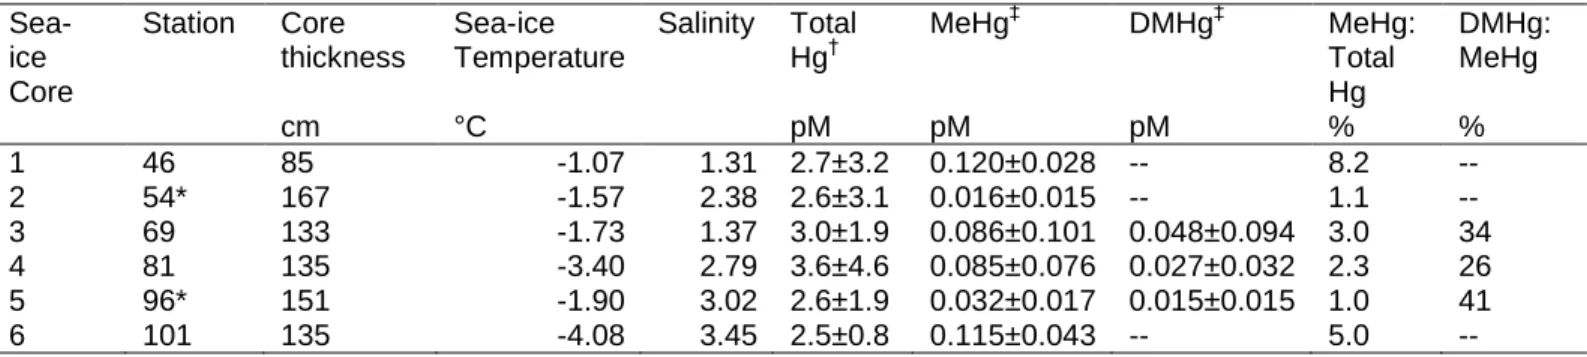
Table 1: Summary of sea-ice core characteristics and mean speciated mercury (Hg)
377
concentrations (the standard deviation represents downcore variability). 378 Sea-ice Core Station Core thickness Sea-ice Temperature Salinity Total Hg† MeHg‡ DMHg‡ MeHg: Total Hg DMHg: MeHg cm °C pM pM pM % % 1 46 85 -1.07 1.31 2.7±3.2 0.120±0.028 -- 8.2 -- 2 54* 167 -1.57 2.38 2.6±3.1 0.016±0.015 -- 1.1 -- 3 69 133 -1.73 1.37 3.0±1.9 0.086±0.101 0.048±0.094 3.0 34 4 81 135 -3.40 2.79 3.6±4.6 0.085±0.076 0.027±0.032 2.3 26 5 96* 151 -1.90 3.02 2.6±1.9 0.032±0.017 0.015±0.015 1.0 41 6 101 135 -4.08 3.45 2.5±0.8 0.115±0.043 -- 5.0 -- * Multi-year sea-ice cores
379
†
The method detection limit is 0.08 pM
380
‡ The method detection limit is 0.011 pM
381 382 383 384 385
387 388 389 390 391 Figure 2 392