Development of a Multi-Regime Tribometer and Investigation of Zinc
Dialkyldithiophosphate Tribofilm Development in the Presence of
Overbased Calcium Sulfonate
by H. Arthur Kariya
B.S., Mechanical Engineering, 2005 University of California, Berkeley
+DLOGY MASSArt-1U 'T~h INS,
Pi EtS
Submitted to the Department of Mechanical Engineering in partial fulfillment of the requirements for the degree of
Master of Science in Mechanical Engineering at the
MASSACHUSETTS INSTITUTE OF TECHNOLOGY February 2009
© 2009 Massachusetts Institute of Technology All Rights Reserved
Signature of Author .... ... ...
C ertified by ... ...
Department Mechanical Engineering February 4, 2009
-I .. ...
Victor W. Wong Principal Research Scientist and Lecturer in Mecha ical Engineering
Accepted by ... ... ... ... ... V.... - - .
David E. Hardt Chairman, Department Committee on Graduate Students
Development of a Multi-Regime Tribometer and Investigation of Zinc
Dialkyldithiophosphate Tribofilm Development in the Presence of
Overbased Calcium Sulfonate
by
H. Arthur Kariya
Submitted to the Department of Mechanical Engineering in partial fulfillment of the requirements for the degree of Master of Science in Mechanical Engineering
ABSTRACT
A custom tribometer was developed to investigate the production of nano-scale films from the anti-wear additive zinc dialkyldithiophosphate (ZDDP). The tribometer was designed to operate in various conditions of lubrication severity, from boundary to hydrodynamic lubrication regimes. A cylinder-on-plate layout, in which a cylinder rotates and rubs against a plate in a line contact, was employed for this purpose.
ZDDP, a wear preventative additive universally used in engine and gear oil formulations, was studied in detail with respect to tribofilm production. As typical oil formulations contain an assortment of additives, the development of these films in the presence of other additives was studied. Of these, overbased detergents have recently been under scrutiny with mixed findings of synergetic and antagonistic effects. This project investigates the effects of overbased calcium sulfonate, a basic detergent used to neutralize acids and solubilize contaminants in oil, using electrical contact resistance (ECR), Auger electron spectroscopy (AES) and 31-phosphorous nuclear magnetic resonance (P31NMR). Oil blends of 2.4% (mass) ZDDP with varying concentrations of
calcium sulfonate were mixed for rubbing and heating tests. ECR was used to monitor the development of the tribofilm in-situ of the tribometer and AES was used in post-mortem analysis to measure the film thickness. Analysis with P3 1 NMR was employed for a series of heating experiments to characterize the chemical interactions between the two additives. Tests in light boundary lubrication show a trend of suppression of ZDDP tribofilm formation with the introduction of the detergent.
Thesis Supervisor: Victor W. Wong
Acknowledgements
I would like to thank the following people for their invaluable help in the completion of this project.
Foremost, I would like express my utmost gratitude to Dr. Victor Wong for the
opportunities and support he has given me. Through his guidance, I was able to learn the fundamentals of experimental research and hands on problem-solving. I am always inspired by his passion to unravel the mysteries that cover lubrication chemistry and impressed at his depth in knowledge. His guidance and trust in my work opened all doors to fully exert myself in this project, and grow as a graduate student and as a researcher. For this, I am truly grateful.
I would also like to thank the Consortium to Optimize Lubricant and Diesel Engines for Robust Emission Aftertreatment Systems for supporting this project. Without their advice and contributions in providing the test oils, this project would not have been possible.
Much appreciation goes to the members of the Sloan Automotive Laboratory. The
smooth progress of my project was greatly due to Thane's experienced advice and help in procuring supplies for my project. The miracles Raymond works with his hands is probably beyond science, and I thank him for the revival of the tribometer. I am thankful to Simon and Alex for all the advice and teaching me the ropes to the lab as well as research. To Kai, who put up with my random talk through all those days and months and kept office-life fun. Many thanks go to Amir for his help in troubleshooting the tribometer.
Also, I would like to express my gratitude to the following, for their immeasurable help during the experimentation process: Libby Shaw at CMSE for her guidance in AES analysis, M&S Grinding for their incredible polishing work and turnaround times, and Gary Juneau for his quick and no-hassle NMR analysis.
Most of all, I would like thank my family and friends. My mother and father, for their understanding and unwavering support and belief in me, and my brother, who still is the base figure of my ideals. My friends in Bellflower, for always keeping a spot open for me, and my friends in Japan for cheering me up with interesting stories.
H. Arthur Kariya January, 2009
Table of Contents
A b stract ... ... ... 3 Acknowledgements... 5 Table of Contents ... ... ... 7 List of Figures ... 9 List of Tables ... 13 1. Introdu ction ... 15 2 . B ackground ... ... 172.1. Lubrication Fundamentals and Definitions ... . 17
2.2. Oil Additives ... ... ... 18
2 .2 .1. Z D D P ... 18
2.2.2. Overbased Calcium Sulfonate... 22
2.3. Diagnostic Techniques ... 24
3. Development of a Custom Tribometer ... ... 27
3.1. D esign G oals ... ... 27
3.2. Typical Tribometer Designs ... 27
3.3. Experimental Apparatus - Line Contact Tribometer... 28
3 .3 .1. O v erview ... 2 8 3.3.2. Cylinder-on-Flat Design for Hydrodynamic Testing... . 29
3.3.3. Cylinder-on-Flat Design for Boundary Lubrication ... 34
3.3.4. Data Acquisition ... . ... 36
4. Experimental Methodology ... 37
4 .1. A pproach ... 37
4.2. Experimental Procedure and Test Settings ... ... 40
4 .2 .1. B lending O il ... 40
4.2.2. Thermal Decomposition Test... ... 41
4.2.3. Rubbing test with tribometer ... 42
5. Experimental Results and Analysis ... ... 47
5.1. Thermal Decomposition of ZDDP (Test A) ... 47
5.2. Thermal Film Formation... 50
5.2.1. Film Formation from Fresh ZDDP (Test B) ... 50
5.2.2. Film Formation from Aged ZDDP (Test C) ... 53
5.3. T ribom eter T ests ... ... 55
5.3.1. ECR and Friction Measurements ... 55
5.3.2. Depth Profiling with AES ... 61
5.3.3. Wear Scar Analysis... 64
5.3.3.1. Wear Scar Size ... 64
6 . D iscu ssion ... 69
6.1. Effect on ZDDP Decomposition ... .... ... 69
6.2. Effect on Thermal Film Formation ... ... 69
6.3. Effect on Rubbing Lubrication ... ... 70
7 . C o n clu sio n s... 7 5 R eferences ... 77
A ppendix A . LIF D iagnostics ... 81
A .1. System L ayout ... 81
A .3. Selection of D ye... 85
A.3. Effects of Dye Concentration... ... 86
A.5. Effects of Temperature ... 89
A .6. C alibration of L IF ... 90
A.6. Application of LIF to the Tribometer ... ... 91
A .7. R eferences ... ... ... 93
Appendix B. Tribometer Operation Check ... ... 95
Appendix C. Selected P31NMR Spectra ... ... 99
List of Figures
Figure 2-1 Lubrication regimes and their effect on the coefficient of friction [9] ... 18
Figure 2-2 Contour plot of the induction time, or the time taken until film formation occurs, for a variety of contact pressures and sliding speeds [10] ... 20
Figure 2-3 Typical structure of ZDDP [8] ... 20
Figure 2-4 Forms of ZDDP: dimer (left) and monomer (right) ... 21
Figure 2-5 Basic ZDDP, Zn4 [PS2(OR) 2]60... 21
Figure 2-6 Typical layer diagram of an anti-wear film produced from ZDDP [2]... 22
Figure 2-7 Solubilization of a soot contaminant by surfactant molecules in oil [6]... 23
Figure 2-8 Overbased calcium sulfonate structure [6] ... 23
Figure 3-1 Example of point contact a) and line contact b) tribometer designs ... 27
Figure 3-2 Inputs and outputs of tribometer ... ... 29
Figure 3-3 Schematic of cylinder-on-flat lubrication test apparatus ... 31
Figure 3-4 Design of pivot made to allow for plate rotation for auto-alignment to cy lin d er ... 3 1 Figure 3-5 CAD drawing of entire test setup... 33
Figure 3-6 Photo of test apparatus ... 33
Figure 3-7 E C R circuit... ... 35
Figure 3-8 Relationship between ECR voltage and tribofilm... 35
Figure 4-1 Schematic of 3 types of heating tests conducted to study the effects of O B CaSu on ZD D P activity ... ... 39
Figure 4-2 Schematic diagram of the setup used to thermally decompose ZDDP... 41
Figure 4-3 Depth profiling after ultrasonic cleaning in hexane for 30 seconds... 44
Figure 4-4 Sputter calibration using a 50nm silicon oxide wafer ... 45
Figure 5-1 P31 NMR spectra for a) 2 hour and b) 15 hour heating tests at 1200C ... 48
Figure 5-2 Effect of OBCaSu on the level of basic ZDDP in oil solution... 49
Figure 5-3 Oil samples after 7 hours of heating at 150C ... 49
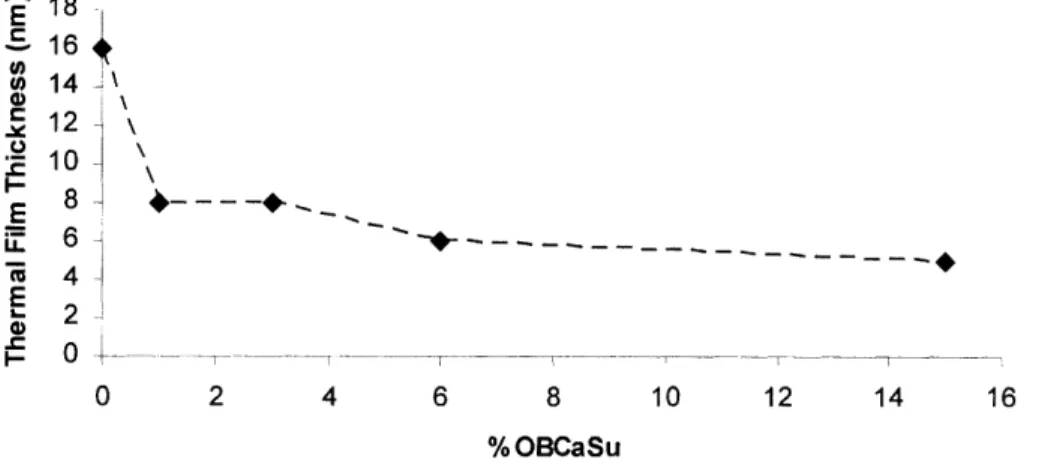
Figure 5-4 Thermal film thickness for 2 hour heating tests with fresh ZDDP in the presence of various levels of OBCaSu... 50
Figure 5-5 AES elemental depth profiling of thermal film with 2.4% ZDDP (0.2% Phos.) and 0% O B C aS u ... 5 1 Figure 5-6 AES elemental depth profiling of thermal film with 2.4% ZDDP (0.2% Phos.) and 1% O B C aSu ... 52
Figure 5-7 AES elemental depth profiling of thermal film with 2.4% ZDDP (0.2% Phos.) and 15% O B C aSu ... 52
Figure 5-8 Thermal film thickness and level of calcium inclusion for 2 hour heating tests with aged ZDDP + OBCaSu. Measurements taken with AES. ... 53
Figure 5-9 AES elemental depth profiling of thermal film with 2.4% ZDDP (0.2% Phos.) an d 0% O B C aS u ... 54
Figure 5-10 AES elemental depth profiling of thermal film with 2.4% ZDDP (0.2% Phos.) and 1% O B C aSu ... 54
Figure 5-11 AES elemental depth profiling of thermal film with 2.4% ZDDP (0.2% Phos.) and 6% O B C aSu ... ... 55
Figure 5-13 Resistance trace for 2.4% ZDDP, 0% OBCaSu... 57
Figure 5-14 ECR trace for 2.4% ZDDP, 1% OBCaSu ... 57
Figure 5-15 Resistance plot for 2.4% ZDDP, 1% OBCaSu ... 58
Figure 5-16 ECR trace for 2.4% ZDDP, 3% OBCaSu ... 58
Figure 5-17 Resistance trace for 2.4% ZDDP, 3% OBCaSu... 59
Figure 5-18 ECR trace of 0% ZDDP, 3% OBCaSu... 59
Figure 5-19 Resistance trace for 0% ZDDP, 3% OBCaSu... 60
Figure 5-20 Coefficient of friction trace for the various oil blends ... 60
Figure 5-21 Depth of calcium inclusion in tribofilm. Measured with AES... 61
Figure 5-22 AES elemental depth profiling of tribofilm with 2.4% ZDDP (0.2% Phos.)62 Figure 5-23 AES elemental depth profiling of tribofilm with 2.4% ZDDP (0.2% Phos.) and 1% OBCaSu... 62
Figure 5-24 AES spectrum of tribofilm with 2.4% ZDDP (0.2% Phos.) and 1% OBCaSu. ... ... 6 3 Figure 5-25 Representative AES trace for ZDDP tribofilms taken from a past study by Y am aguchi et al. [39] ... . . 63
Figure 5-26 SEM image of wear scar ... 64
Figure 5-27 Cylinder scoring after test with 1% OBCaSu ... 65
Figure 5-28 Top view of score marks on cylinder ... 65
Figure 5-29 SEM Image of wear scar from rubbing with 2.4% ZDDP and 3% OBCaSu. ... 6 6 Figure 5-30 SEM elemental images of wear scar from rubbing with 2.4% ZDDP and 3% OBCaSu. .. ... ... 67
Figure 5-31 Rough spots on wear scar with OBCaSu ... 67
Figure 5-32 SEM image of steel surface (Ra -0.05 gm) before rubbing ... 68
Figure 5-33 SEM image of steel surface after rubbing with OBCaSu. ... 68
Figure 6-1 AES profile taken by Cizaire et al. of a tribofilm formed by OBCaSu ... 71
Figure 6-2 Model of proposed ZDDP - OBCaSu tribofilm structure ... 73
Figures in Appendices Figure A - 1 Typical LIF layout... . 81
Figure A- 2 Dye concentration calibration rig ... 87
Figure A- 3 LIF signal vs. oil film thickness, showing the effects of dye concentration on signal size... ... . 87
Figure A- 4 Normalized LIF signal vs. oil film thickness, showing the effects of dye concentration on linearity ... 88
Figure A- 5 The effect of temperature on fluorescent intensity. Measurements were taken at 100 m m ... ... ... 89
Figure A- 6 Test plate for use with LIF ... ... 91
Figure B- 1 Stribeck curve for tribometer operation check ... . 95
Figure B- 2 Effect of speed on friction force ... ... 96
Figure B- 3 Effect of speed on friction coefficient ... 96
Figure B- 4 Effect of loaf on friction force... ... 97
Figure B- 5 Effect of speed on film thickness ... ... 97
Figure C- 1 P31NMR spectrum for 100% ZDDP. Units are in ppm. ... 99
Figure C- 2 P31NMR spectrum for 2.4% ZDDP, 0% OBCaSu, 2 hours heating at 1200 C. U nits are in ppm ... ... ... .... .. . 99
Figure C- 3 P31NMR spectrum for 2.4% ZDDP, 3% OBCaSu, 2 hours heating at 1200C. U nits are in ppm ... 100
Figure C- 4 P31NMR spectrum for 2.4% ZDDP, 6% OBCaSu, 2 hours heating at 1200C. U nits are in ppm ... 100
Figure C- 5 P31NMR spectrum for 2.4% ZDDP, 15% OBCaSu, 2 hours heating at 1200C. U nits are in ppm ... 10 1 Figure D- 1 Differentiated plot of raw AES spectrum showing overlap between carbon and calcium signals ... 104
List of Tables
Table 4-1 Specification for ZDDP solution ... ... 40
Table 4-2 Specification for OBCaSu solution ... ... 40
Table 4-3 Specification of blended test oils... ... 41
Table 4-4 Testing Conditions...42
Table 4-5 Operation settings for AES... 45
Table 5-1 Wear Scar widths. Each test contained 2.4% ZDDP ... 64
Tables in Appendices Table A- 1 Compents of LIF system... ... 82
Table A- 2 Specifications of Rhodamine dyes excited at 532nm ... 85
1. Introduction
Automotive lubricants are a complex blend of base oil and additives. Depending on the specification, base oils compose 70 to 90 percent of the formulation [1]. Additives are added to the oil to increase the performance of the base oil for the severe lubrication conditions found in automotive engines. Examples include dispersants, viscosity index improvers, extreme pressure additives, detergents, and anti-wear additives. Additives have been in use since the 1930's and although their general effects on engine protection are known, the mechanisms of their operation as well as the specific interactions between are yet to be completely documented [2].
As a result of the stringent emissions regulations being enacted worldwide, emission standards have closed the window on permissible exhaust gases to 1/10 of what was allowed 15 years ago. These changes are forcing a renewed effort on modifying or even overhauling modern oil formulations, as engine oil additives are sources of certain exhaust emissions. In a conventional piston engine, a small amount of oil left on the cylinder walls is unavoidably burned as it comes into contact with combustion. Problems come into play when the burned oil either forms noxious particulates, or the metals in the additives become ash. The ash effectively deactivates the catalytic converters used in the post-engine emissions reduction and drastically reduces their efficiency over the life of the engine. Among other additives, zinc and phosphorous-based anti-wear additives and detergents that contain calcium and magnesium are the primary sources of the metals and are currently under revaluation for optimization and reduction. Many researchers are now revisiting the operating mechanisms of the additives in hopes of finding alternatives or complementary blends that result in lower total ash. The result is a shift towards engine oil formulations for meeting emissions regulations rather than simply for engine performance goals.
This project serves to provide useful information to assist the efforts directed at lubricant optimization for the future. This project is divided into two parts. First, a lubrication test-rig is developed. Second, the performance of zinc dialkyldithiophosphate (ZDDP), a
universally used anti-wear additive is investigated in the presence of overbased calcium sulfonate detergent (OBCaSu).
ZDDP is the principal anti-wear additive used in modem engine and gear oil formulations, and is also a source of sulfated ash from zinc and phosphorous. There are many benefits to using ZDDP. To name a few, it is relatively cheap to produce, works as an antioxidant as well as an anti-wear agent, and is extremely effective. Presently, there is no competitive substitute for ZDDP, but the pressure to reduce ash levels in oils continues to escalate.
Stated in simplistic terms, ZDDP is known to prevent wear by the chemical formation of nano-scale films on the lubricated surface. To this day, the step-wise reaction mechanisms for film formation is not fully understood and moreso the effects of other additives on them. However, much experimental work is currently being done by researchers to empirically characterize the behavior of ZDDP.
This study will investigate the effects of OBCaSu on ZDDP. OBCaSu is an alkaline, or basic, derivative of a calcium sulfonate detergent, and is known to have characteristics that both resemble and differ from calcium sulfonate. It possesses a wear-preventative ability of its own, yet some studies have found wear to increase when OBCaSu is added to oils containing only ZDDP [3, 4]. To better understand the magnitude of each known effect of OBCaSu on ZDDP, this study will involve a series of experiments to assess the magnitude of each on the overall anti-wear performance. It should be noted, however, that this study will not address the detailed chemistry of tribofilm formation and additive interaction. This study will be conducted in hopes that a better understanding of the relationship between the two commonly used additives will help future efforts in oil formulation.
2.
Background
2.1. Lubrication Fundamentals and Definitions
Lubrication is a process in which an intermediary medium is placed between two contacting surfaces to reduce direct contact and thus wear. Therefore, it must be related to wear, which is when the profiles of the contacting surfaces are changed. This change may be due to plastic deformation, say of the folding over of asperity peaks, or to the shearing of surface features. To describe the level of severity of the lubrication conditions, three regimes are determined. In the order of increasing severity, they are: hydrodynamic, mixed, or boundary lubrication. In hydrodynamic lubrication, negligible wear occurs as there is complete separation of the rubbing surfaces by the lubricant. Hydrodynamic lubrication occurs when conditions allow the hydrodynamic pressure of the liquid lubricant to separate the surfaces, and is facilitated by high rubbing speed, high lubricant viscosity, low load, or smooth surfaces. On the opposite extreme is boundary lubrication, which occurs when the lubricated surfaces are not separated but are in physical contact. The coefficient of friction is high for boundary lubrication and extreme cases of hydrodynamic lubrication, due to the rubbing of the surfaces and the viscous shear of the lubricant, respectively. Mixed lubrication is regime between boundary and hydrodynamic, in which incomplete separation occurs and the surfaces undergo a moderate level of wear. Although the criterion defining the onset of boundary lubrication depends on the literature, for the purpose of experimental analysis, boundary lubrication will be considered to occur when the coefficient of friction exceeds 0.1 [5].
IELAS O1~AJ~i i
Figure 2-1 Lubrication regimes and their effect on the coefficient of friction [9]
2.2. Oil Additives
2.2.1. ZDDPZinc dialkyldithiophosphate (ZDDP) is arguably the most influential lubricant additive up to date. It was introduced mainly as an antioxidant additive in the early 1940's. As the 1950's saw engines with higher compression ratios and increased component stresses, it became noticed that engines operating on higher levels of ZDDP generally had less wear problems than engines without it. Since then, ZDDP has been in such widespread use in lubrication that as of 2004, the United States is estimated to use 30,000,000 pounds of ZDDP on a yearly basis [2].
ZDDP is an effective anti-wear additive through its formation of nano-scale films on metal surfaces. These films can be formed through high temperature or pressure. Though there is not a specific threshold temperature that must be exceeded in order for
the thermal film formation, it is generally understood that temperatures exceeding 800C
will induce slow film development and temperatures beyond 1500C will drastically accelerate the rate of formation [6, 1]. Under rubbing conditions seen in actual lubrication, films have been found to form at room temperature, although higher temperatures greatly increase the rate of formation [7].
Although many chemical pathways have been suggested by researchers on the development of films by ZDDP, the most dominant pathway is the following. Under conditions noted above, ZDDP is decomposed. The decomposition products, which is said by some to further catalyze the ZDDP decomposition process, is adsorbed onto the metal surface, where it undergoes oxidative reactions that make the film precursors [6, 2, 8]. The widely accepted observation is that temperature increases the rates of these reactions, such that they can be estimated with an Arrhenius relationship. Though a consensus is yet to be reached about the effect of pressure on the film formation rate, it is suggested by some that flash temperatures generated by the micro / nano-scale asperities of the lubricated surfaces help produce the film [9].
Other parameters that affect the rate of film formation are: ZDDP concentration, sliding speed, type of base oil, presence of other additives, type of lubricated surface and type of ZDDP. Greater concentration of ZDDP increases the formation rate. Sliding speed, type of base oil and the presence of other additives have mixed effects. As can be seen in figure 2.2 below, sliding speed can increase or decrease the rate, depending on the lubrication conditions [10]. It has also been found that interactions between the base oil and ZDDP have noticeable effects on film formation. In general, Group 2 base stock oils allow for faster formation than group 1 stock oils [11]. Other additives, such as detergents and dispersants, have been found to both positively and negatively influence the film formation rate. Currently, experimental results are contradictory: some find these additives to have a synergistic effect, while others state that the decomposition of ZDDP is hampered by the presence of detergents [12, 13, 14]. Most studies on tribometers have been done using AISI 52100 steel or grey cast iron as test specimens,
and a study has shown that anti-wear films are more easily formed on 52100 steel than on cast iron [15]. Velocity (mI) 0.25 0.3 0.36 04 054 0.5 0.8 400 05 0 15 20 2 30 35 40 Frequency (Hz)
Figure 2-2 Contour plot of the induction time, or the time taken until film formation occurs, for a variety of contact pressures and sliding speeds [10]
The functional group on the ZDDP molecule has a large effect on its thermal stability, affecting the decomposition rate for a given lubrication condition. The most common types of ZDDP, defined by their functional groups, are: secondary alkyl ZDDP, primary alkyl ZDDP and aryl ZDDP. Aryl ZDDP is most thermally stable, followed by primary akyl and then secondary alkyl ZDDP. In terms of anti-wear film formation, high instability is desired due to better reactivity. For the range of temperatures generally seen in an engine, experimental evidence show that alkyl ZDDP forms anti-wear film faster, with secondary alkyl being fastest [15, 2]. Typical engine oil formulations contain approximately 85% secondary alkyl and 15% primary alkyl ZDDP.
R-O S---o S O- R
R-O S O-R
Figure 2-3 Typical structure of ZDDP [8]
In addition, ZDDP is known to exist in different forms. While figure 2-3 shows ZDDP in its simplest (monomeric) form, it exits in an equilibrium between monomer and dimer
state in solution (figure 2-4). Furthermore, ZDDP may also be in an agglomerate state, called "basic ZDDP," in contrast to the "neutral," simpler, forms described above. Past studies have found that basic ZDDP can convert to its neutral form and ZnO at high temperatures [2, 16]. In general, ZDDP in its neutral form is more reactive and therefore more effective as an anti-wear agent. Of the neutral form, the monomer is most reactive.
Zn[PS2(OR) 2] 2 Zn2 [PS2(OR) 214
Figure 2-4 Forms of ZDDP: dimer (left) and monomer (right)
O P PT""S n S
V•
..=OR
SZn
basic-ZnDTP. (DTP)Zn40 (two of four DDP ligands shown)
Figure 2-5 Basic ZDDP, Zn4 [PS2(OR) 2160
Anti-wear films from ZDDP are structured in layers, as shown in the figure below. The outermost layer consists of organic sulphides and undecomposed ZDDP. In general, higher concentrations of ZDDP result in more undecomposed ZDDP on the surface [6]. Certain studies have found the surface to contain undecomposed ZDDP in the form of a viscous layer, increasing friction [17]. The next layer is comprised of metallic polyphosphates. The polyphophate chain length is longer near the surface and more iron is found near the iron substrate. Below the phosphate layer is an iron-rich bonding layer. Film thickness depends on the conditions, and can range from 1 to 150 nm [ 11 ].
Organic sulphides/ZnDTP Zn polyphosphate
glassy Fe/Zn more Fe,
phosphate shorter
chain
FeS/ZnS phosphates
Figure 2-6 Typical layer diagram of an anti-wear film produced from ZDDP [2]
Most studies have found that the anti-wear performance is better when polyphosphate chain length is longer [18, 10]. Longer rubbing time, higher concentration of ZDDP, moderate temperature, higher load, and smooth surfaces facilitate the formation of long chain phosphates [18]. Researchers have also found that the addition of overbased calcium sulfonate detergent resulted in shorter chain phosphates due to the cations from the detergent cleaving the chains [4].
2.2.2. Overbased Calcium Sulfonate
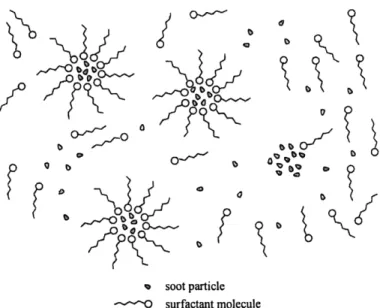
Detergents and dispersants are surfactant species included in oil packages to keep oil-insoluble contaminants such as soot in suspension. They also prevent oil thickening, sludge and varnish deposition on metal surfaces and corrosive wear. Detergents contain alkaline metals, typically calcium or magnesium, while dispersants are typically ashless, or without metal. Both are structured with a hydrophilic "head" and an oleophilic hydrocarbon "tail" that enable them to dissolve in oil. Contaminants are suspended in oil by being surrounded by the additives in a manner such that the heads face the contaminant while the tails face the oil. Detergents and dispersants are considered interchangeable in role, but if a distinction is to be made, detergents are normally considered for high temperature deposit control while dispersants for low-temperature sludge[19].
)
/o
% soot particle
---- O surfactant molecule
Figure 2-7 Solubilization of a soot contaminant by surfactant molecules in oil [61
Various types of detergent are used for engine oil, the most common being calcium or magnesium based sulfonates, phenates, salicylates and phosphonates with long-chain alkyl tails. For example, a typical calcium sulfonate detergent consists of calcium sulfonate alkylbenzene molecules [6]. Of these detergents, the most widely used are calcium sulfonates [20].
2+
a Ca 2
2- CaC0 Ca
a2+ Ca 2 alkyl benzenesulfonate
c1- colloidal core
Figure 2-8 Overbased calcium sulfonate structure [61
Overbased detergents are structured as if the detergent molecules are encapsulating, or solubilizing, a strong base core. The core is a metal carbonate, usually calcium, and ranges in size from 10 to over 20nm in diameter [21]. Overbased detergents play a dual
10/
/01
1
0",d
0 Orr O" o b a0___1_11
Z'j
A , 0~ Vo bV
VoB 0role of surfactant as well as neutralizer of acids. They are widely used, as oil change intervals are usually limited by the anti-wear and acid-neutralizing capacity. This capacity to neutralize acids is typically measured in units of total base number (TBN), which range from 5 to 10 for modern formulations.
Various instances of detergent interaction with ZDDP have been documented in the past. Detergents have been found to solubilize ZDDP in oil, slowing its decomposition and limiting its ability to contact the metal surface [6]. Others studies report a synergistic effect in the total anti-wear action [3]. In addition, detergents have also been found to shift ZDDP equilibrium towards the basic state, increasing wear due to the decrease in anti-wear activity [6]. In this case, overbased detergents had a greater effect on shifting ZDDP equilibrium than normal detergents. Other effects on tribofilm composition have been noted as well. The calcium cations from the basic core of overbased detergents were seen to cut the polyphosphate chains in ZDDP tribofilms and incorporate themselves in the form of calcium phosphates. The shorter chains reduced the effectiveness of the anti-wear film [4].
Overbased calcium sulfonate detergents are known to have an independent anti-wear capability. The calcium carbonate cores, under rubbing conditions, form a protective layer on the metal surfaces. Some have found a viscous film while others a robust solid film [22]. Furthermore, some report the film to be composed of calcium oxide and others calcium carbonate in the form of calcite [23, 24, 25].
2.3. Diagnostic Techniques
A variety of diagnostic techniques was used in this study, and they will be briefly introduced here. Anti-wear film development was monitored in-situ during rubbing by Electrical Contact Resistance (ECR) and the film composition and thickness was measured with Auger Electron Spectroscopy (AES). Other microscopic features are examined using Scanning Electron Microscopy (SEM). The decomposition of oil is analyzed by 31-Phosphorous Nuclear Magnetic Resonance (P31NMR).
ECR is essentially an electrical circuit used to measure the resistance between two surfaces. Simple setups used in the past consist of the measured resistance connected in parallel or series to a known resistance, closing a circuit connected to a battery [15, 26]
AES is an ultra-high vacuum surface analysis technique that closely parallels SEM. An electron gun is used in SEM to send a ray of electrons to the surface atoms of the analyzed sample to induce an energy exchange. This can result in the elastic scattering of the electrons, inelastic scattering of different electrons, or the emission of electromagnetic radiation. This is picked up by a detector, from which signal is used to produce an image. AES operates by the same principle, but different only in that Auger electrons are excited from the sample, and these are detected instead. Due to the similarity in operation, AES machines commonly have SEM imaging settings as well. AES is often used in conjunction with ion sputtering for depth analysis; this entails an ion gun to erode away nanometer-thick layers while the AES examines the surface [27, 28, 29, 30].
P31NMR is a type of nuclear magnetic resonance (NMR) technique that analyzes the
31-phosphorous isotope. The basic operation of NMR is based on the phenomenon that an isotope resonates at a characteristic frequency when subject to a magnetic field. Typical isotopes used are P31, H13 and C1 3. Depending on the chemical state of the isotope, a
frequency shift from resonance can occur, and this shift, together with the resonant frequency, is used to calculate a non-dimensional value known as the chemical shift. The chemical shift is expressed in ppm, and is used in plotting the NMR spectrum [31, 32]. The chemical shift of an isotope is defined by its peak in the spectrum.
3.
Development of a Custom Tribometer
3.1. Design Goals
In the development of the tribometer, possible designs were considered by weighing the desired uses. It was determined that the tribometer will have future use in hydrodynamic as well as boundary lubrication testing.
1. Boundary lubrication testing
- effect of lubricant chemistry on tribofilm development 2. Hydrodynamic lubrication testing
- effects of oil contaminants
- effects of material / surface property
For hydrodynamic testing, measurement of the oil film thickness was a high priority. For boundary lubrication testing, oil film measurement was unnecessary but in-situ monitoring of anti-wear film development was to be an integral part of the design. In both cases, the friction force acting at the interface was to be measured.
3.2. Typical Tribometer Designs
In consideration of various tribometer designs, the designs were categorized by two classifications: point vs. line contact and reciprocating vs. continuous motion. Common examples of point contact layouts include the four-ball wear tester and the ball-on-disc tribometers. Line contact designs are generally in the form of a cylinder-on-flat.
a. b.
Continuous rubbing motion was chosen over reciprocating motion as reciprocation involves a series of different speeds, from zero velocity to a maximum at the middle of the stroke. Focusing analysis on one speed would allow for a greater control over the lubrication regime and reduce the number of parameters varied per test. A line-contact layout was employed over point contact for reasons later explained in this section.
3.3. Experimental Apparatus
-
Line Contact Tribometer
3.3.1. Overview
The tribometer design was largely determined by the methods of measurement. The design was chosen through the following steps: first, the required measurements were determined and second, the modes of measurement were selected. And finally, various tribometer designs that would allow for the implementation of these methods and sensors were considered.
The following parameters were chosen for measurement: 1) Oil film thickness
2) Friction force
3) Tribofilm development
However, as oil film thickness will only be measured during hydrodynamic testing and tribofilm development will be monitored during boundary tests, only two of the three parameters were needed to be measured at once.
INPUTS
OUTPUTS
(operatingoarameters)
.
Oil Film
Load "- ThicknessLoad
----
,
Rubbing
Te, Friction ForceRubbing
Speed
Tribofilm
Oil ,. development
Temperature
Figure 3-2 Inputs and outputs of tribometer
3.3.2. Cylinder-on-Flat Design for Hydrodynamic Testing
The technique of Laser-Induced Fluorescence (LIF) was chosen for oil film thickness measurements, due to the availability of hardware and knowledge of implementation. LIF has been used for in-engine film measurement at MIT for over 20 years [33, 34, 35]. Furthermore, as LIF has been in use since the early 1970's, there is a wealth of literature regarding its application.
Being a laser-based technique, LIF requires optical access to the location of measurement. For oil film measurement without a large disturbance of the rubbing interface, the line-contact design was employed. Point-contact with a ball and plate may have been likewise used, with the optical window for laser access mounted onto the plate. With this design, however, the oil film can only be measured when the ball rides over the window and the measurements will be momentary. A cylinder-on-flat design was adopted, in which a plate is held stationary while a cylinder spins against it. Continuous measurements will be possible if the optical window is located on the plate. If the window is kept small in respect to the length of the contact, measurements can be taken at minimum disturbance of the rubbing surfaces. Further detail regarding the LIF setup can be found in Appendix-A.
As a result of having the optical access on the plate, it was necessary to keep the plate from being completely immersed in the oil. Especially in high temperature conditions, the heated oil may deform or degrade the optic fiber and seep into the lens of the focusing probe. Thus the flat was to be held stationary, away from the oil sump, while the cylinder transported the oil to the lubricated interface.
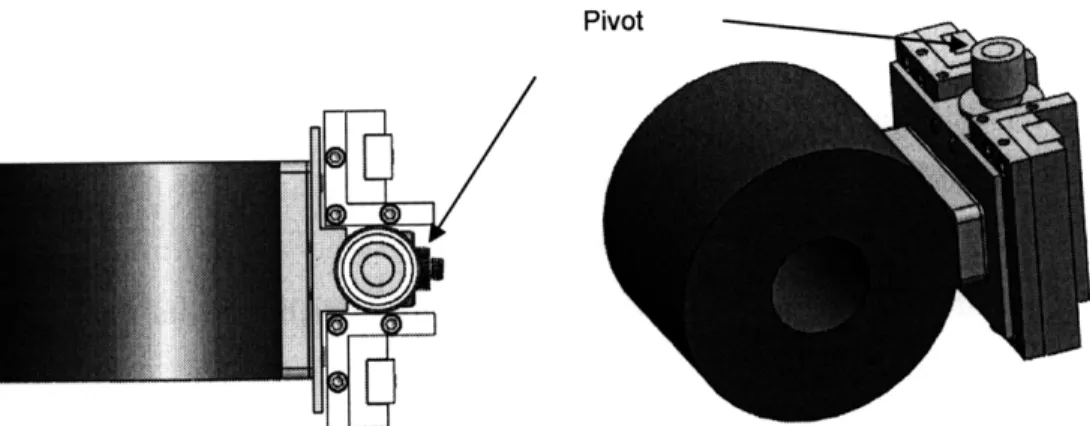
The plate was mounted onto a set of sliders so that it was free to move along a plane tangent to the cylinder (figure 3-3). A compressive load cell was mounted in the path of the sliders so that frictional forces acting on the flat during rubbing will be transmitted onto the load cell. Low friction sliders were chosen to prevent introduction additional forces to the load cell readings. This subassembly was then attached to another set of sliders, which allowed the plate to move towards or away from the cylinder. By connecting these sliders to a set of weights with a cable, the plate was able to be pressed against the cylinder with a known force. Additional accommodation was made to allow the plate to pivot on an axis perpendicular to that of the cylinder rotation (see figure 3-4). Given that the cylinder is truly concentric and the plate flat, this allowance was designed to provide a small amount of auto-alignment to compensate for the tolerances stacked from the number of components that align the plate.
Figure 3-3 Schematic of cylinder-on-flat lubrication test apparatus
Pivot
The cylinders were made of grey cast iron and AISI 52100 chrome steel with the dimensions of 3.5" OD, 1.25" ID and 2.5" length. The plate was made of grey cast iron with dimensions: 2.5" length, 1" width and 0.3125" height. These metals were selected to closely resemble the materials found in the cylinder liner and piston rings of
reciprocating combustion engines.
The cylinder was rotated using a 1hp, 90V DC motor with a controller. To prevent rotation runout, tapered roller bearings were used to hold the cylinder spindle. The rotation speed was monitored using an encoder with a tachometer readout mounted onto the spindle. The cylinder was fitted onto the spindle with a close sliding fit, and held in place using a screw-type clamp. Since the spindle was made of stainless steel and the cylinder of hard chrome steel, occasional problems occurred during removal in which the internal surface of the cylinder was gouged by the spindle shaft. Mainly due to the small imperfections in the interfacing surfaces and misalignment, this could have been avoided by designing a tapered spindle and/or a brass bushing to fit between the cylinder and spindle.
The oil was contained in a housing that allowed volumes from 100mL to 250mL. The housing was made circular to promote in-sump circulation of the oil to retain uniform composition. Having corners in the sump may result in stagnation at the corners, with only a certain volume of oil constantly picked up by the cylinder. In addition, a removable window was made on the housing to allow access to the cylinder for installation and removal. During the design process it was desired that the window be transparent so that the oil level and tribometer operation can be seen for troubleshooting purposes. Polysulfonate was chosen for the window material due to its transparency, high melting point and machinability. The housing was made with five 1/8" NPT holes at the bottom for possible future additions of oil treatment features. In the setup used for this project, these holes were used to insert two 200W, 1/8" diameter, 3" length cartridge heaters and a type-K thermocouple for sump heating and temperature control. A PID controller was used to control the heating. The other holes were plugged during operation and used for draining the oil.
Motor and pulley
Pulley Pulley for cylinder drive
for
weiahts Fiber optic
w e a h sa b le
Circular Oil housing
Tribometer
Laser
Figure 3-5 CAD drawing of entire test setup
Figure 3-6 Photo of test apparatus
3.3.3. Cylinder-on-Flat Design for Boundary Lubrication
Boundary lubrication testing was performed with the same setup as for hydrodynamic lubrication but with a few modifications. The plate length was shortened to allow higher local pressures at the rubbing interface, and the LIF was removed. Since boundary lubrication resulted in oil films thinner than can be reliably detected by LIF, oil film measurement was deemed unnecessary for these tests.
Electrical Contact Resistance (ECR) was chosen for monitoring tribofilm development. ECR has been used for investigating insulating nano-films since the early 1960's, and is still used today due to its cost effectiveness in setup and strong potential for in-situ measurements [36, 15, 10]. The resistance developed at the rubbing interface is measured, with the onset of resistance signifying the initiation of a tribofilm. The main requirements for applying ECR are boundary lubrication of highly conductive metals and electrical isolation of subassembly components, which were able to be included into the design with little effort. It must be noted, however, that ECR can only be used to monitor anti-wear film development and cannot directly measure the film thickness.
Boundary lubrication for tribofilm development required much higher normal pressures at the rubbing contacts. With preliminary testing low pressures were found to result in very slow, or negligible, production of these films. The plate was redesigned accordingly for boundary lubrication testing. It was downsized to the dimensions of 1" width, 1.4" length and 3/32" thickness in 52100 steel. The rubbing contact was therefore reduced to
1.4". As controlled temperature modulation of the rubbing surface was important for repeatable production of the tribofilms, a ceramic heater was fitted behind the plate to heat the rubbing interface. The plate was designed to be small enough for post-mortem analysis in ultra-high-vacuum microscopes while still being large enough to allow the use of the smallest commercially available high-output heater (100W ceramic heater with 3/4" x 3/4" heating area). The surfaces were professionally polished to a surface roughness of 0.05 pm Ra and a flatness of 0.5 HLB. The cylinder was also polished to a smoothness of 0.05 tm Ra.
A simple voltage divider circuit was used for ECR measurements [15]. A 105 kohm resistor was placed in series with the interface resistance to a 1.5V battery. The voltage drop across the resistor was read by the data acquisition system and registered as the raw data for the ECR plot. An ECR voltage of 1.5V represented zero interface (tribofilm) resistance, and OV represented infinite resistance at the rubbing interface, or an open circuit. Use of a 105 kohm resistor allowed for a range of detectable resistance measurements from 5 kohm to 1Mohm (figure 3-8). Contacts to connect the circuit to the tribometer were made at the cylinder spindle and the plate.
To DAQ
Figure 3-7 ECR circuit
5.00E+05 1.00E+06 1.50E+06
Resistace (ohm)
2.00E+06 2.50E+06
Figure 3-8 Relationship between ECR voltage and tribofilm 1.6 1.4 1.2 1 0.8 0.6 0.4 0.2
H
0 0.00E+003.3.4. Data Acquisition
Measurements were recorded using a data acquisition (DAQ) console from National Instruments (SC-2345). Signal conditioning was performed with plug-and-play modules designed for use with the console. The DAQ console was connected to a computer through a National Instruments PCI board (PCI-6259) and interfaced with LabVIEW to further condition and save the data.
4.
Experimental Methodology
This chapter discusses the methodology for the second half of this project, consisting of the experiments run on the completed tribometer. Light boundary lubrication tests were performed in investigation of zinc dialkyldithophosphate (ZDDP) performance in forming anti-wear films in the presence of overbased calcium sulfonate (OBCaSu). Non-lubrication tests were also undertaken, in which oil samples were heated to observe the in-solution interactions of two additives.
4.1. Approach
Although general effects of OBCaSu on lubrication with ZDDP were studied as well, the primary focus of this investigation was set on OBCaSu effects on the ZDDP film development and structure. For simplification for experimental purposes, the multitude
of steps required for ZDDP to form an anti-wear film was classified into 2 steps:
1) decomposition / isomerization of ZDDP in oil (chemical state changes)
2) adsorption of ZDDP and ZDDP-derived products onto metal surfaces and the subsequent chemical reactions for film formation (ZDDP - metal interactions and film formation)
These steps could take place in both tribo-stressed and non-tribo-stressed areas. Anti-wear films have been found to form in both rubbing conditions and heated conditions, meaning that these 2 steps are successfully executed in both cases. For the sake of clarity, anti-wear films formed under rubbing conditions will heron be called "tribofilms" and films formed under heated conditions will be called "thermal films." There is strong agreement among past studies that composition and chemistry of the two types of films are slightly dissimilar. Zinc, phosphorous, and sulfur content have been found to differ, as well as the phosphate chain length [2, 6, 17, 37]. However, this can be thought of as an extension of the fact that different rubbing conditions, say in temperature and loading,
result in differences in film structure. Hence in this study, thermal films are considered to be tribofilms with loads asymptotically approaching zero. Considering the steps stated above, the severity of rubbing will affect step 2 far more than step 1, which takes place regardless of the presence of metal. As an example of this, some researchers consider step 1 to be a largely thermal process, affected by rubbing only through the generation of flash temperatures [9]. Therefore, the effect of OBCaSu on step 1 in a purely heated environment will be considered to be representative of (though not necessarily equal to) its effect during rubbing.
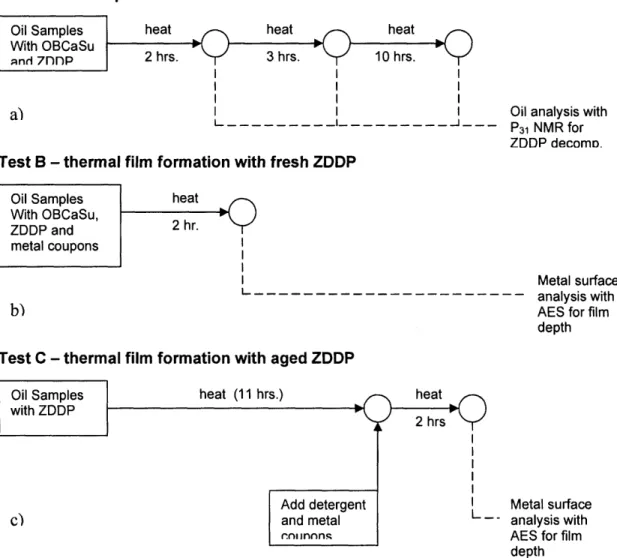
The experimental approach here is to investigate the effect of OBCaSu on step 1 in a variety of heated environments and step 2 in both tribo-stressed and non-stressed (heated) tests. An overview of the experimental schematic for heating tests are shown below. 3 scenarios of heating tests, labeled A through C, were conducted (figure 4-1). Test A was intended to analyze step 1, or the tendency of ZDDP to undergo chemical state changes in the presence of OBCaSu. Tests B and C examined the effect of OBCaSu on step 2 of the film formation process. The difference between B and C was whether ZDDP was fresh or thermally aged at the start of the heating process.
Tribofilm development was studied through rubbing tests conducted on the tribometer. 3 hour rubbing tests were performed, and the deposited films were subject to post-test analysis with AES and SEM.
Test A - decomposition effects
Oil Samples heat heat heat
With OBCaSu
qnd 7nnp 2 hrs. 3 hrs. 10 hrs.
a) I I Oil analysis with
- --- I_---- - --- P31 NMR for
ZDDP decomD.
Test B - thermal film formation with fresh ZDDP
Oil Samples heat
With OBCaSu, 2
ZDDP and 2 hr.
metal coupons
Metal surface
L---. --- - - - - analysis with
b) AES for film
depth
Test C - thermal film formation with aged ZDDP
heat (11 hrs.) Add deterge and metal .nl nnn. heat 2 hrs nt
--Figure 4-1 Schematic of 3 types of heating tests conducted to study the effects of OBCaSu on ZDDP activity Oil Samples
with ZDDP
Metal surface analysis with AES for film depth
4.2. Experimental Procedure and Test Settings
4.2.1. Blending Oil
Test oils were blended with varying levels of additives. To closely model current engine oil formulations, a Group 2 base stock oil was used. The base oil was tested to have a viscosity of 28.8 cst. at 400 C and 5.2 cst at 1000 C (tested with ASTM-D445) and a sulfur content of 23 ppm. For blending purposes, the metal content in the ZDDP was measured using ICP-AES (ASTM D-5185).
Table 4-1 Specification for 100% ZDDP solution
Table 4-2 Specification for OBCaSu solution
I UtN (mg runMg) Juu
Sulfated Ash (% wt.) 40
The additives were blended into the base oil by weight. ZDDP was blended on a percent-phosphorous basis and OBCaSu was blended to TBN levels comparable to those of typical oil formulations. Percent phosphorous was used as the measurement of ZDDP concentration as it is the primary means of measurement used by oil companies. The additives were first added to the base oil on a scale at room temperature. The oils were then heated to 600 C and mixed thoroughly for 30 minutes. The blends were mixed to have 2.4% of the ZDDP solution (0.2% wt. phos.) and varying levels of detergent: 0, 0.5, 1, 3, 6 and 15% OBCaSu by weight. The 15% blend was added to the analysis to observe the effect of high concentration OBCaSu. A special blend with no ZDDP and 3% OBCaSu was also made for a rubbing test. Table 4-3 shows the phosphorous and TBN content of each blend. Typical modem oil formulations are mixed with 0.08-0.12 % phosphorous to a TBN of 6-12. Although comparable ratios of ZDDP (% phos.) to TBN were used for this project, higher concentrations were employed for easier observation of changes.
Tahle 4-3 Sneeifieatinn nf hlended test nile U U.Z U 0.5 0.2 1.5 1 0.2 3 3 0.2 9 6 0.2 18 15 0.2 45 NoZDDP 0 9
4.2.2. Thermal Decomposition Test
Tests were also conducted to investigate the effect of OBCaSu on the thermal decomposition of ZDDP. Oil samples were heated at a controlled temperature using a PID temperature controller with a hotplate. Uniform temperature among the test oils was maintained by heating an intermediary heating oil instead of direct heating. The test oils were heated to 1200 C for 2, 5 and 15 hours and 1500 C for 11 hours. The oil samples were then analyzed using P31NMR. The oil samples were diluted with deuterated
chloroform and measured for decomposition of ZDDP in a Tecmag Apollo NMR machine at 400 Mhz. 52100 steel sheets were included in the oil samples heated for 2 hours to observe film formation by AES.
thermocouple test oils
heating oil o
heater
Additional heating tests were preformed to analyze the effect of OBCaSu on the adsorption of ZDDP and its decomposition products onto metal surfaces. Oils with 2.4% ZDDP were heated for 11 hours at 150' C to ensure a sufficient level of ZDDP decomposition products to facilitate thermal film formation. Different levels (1, 3, 6, 15%) of OBCaSu and 52100 steel coupons were then introduced into the oils, and they were heated for an additional 2 hours at 1200 C.
4.2.3. Rubbing test with tribometer
The tribometer was brought to thermally steady-state conditions before testing was begun. A 100 mL sample of the test oil was heated to 1000 C and the cylinder and oil housing were heated with a hot-air blower to -70' C before the oil was introduced into the tribometer. The oil preheating process was usually less than 15 minutes. The oil was continued to be heated in the housing until the testing temperature was reached. Typical heating times in the housing were -35 minutes, making total heating time about 50 minutes, most of which was below 1000 C. This kept thermal decomposition of ZDDP before testing to a minimum.
Once the operating oil temperature was reached, the heater for the plate test piece was turned on and the cylinder rotated at the testing speed. The data acquisition system (DAQ) was then initialized and the weights loaded. Temperature, friction and ECR signals were sampled with the DAQ at a rate of 1KHz, and data processing was performed by a rolling average, since quasi-steady-state operation kept transients to a minimum. Table 4-4 lists the testing parameters.
Table 4-4 Testing Conditions
Oil temperature 1050 C
Cylinder speed 23 cm/s (50 RPM)
Load 150 N (16 kg)
4.2.4 Post mortem analysis with AES
Post-mortem analysis with Auger electron spectroscopy (AES) was performed for surface analysis of anti-wear films. Since AES operates in ultra-high vacuum, the samples need to be subjected to intensive cleaning for two reasons. One is that high levels of hydrocarbon contamination in high vacuum will disturb the vacuum by out-gassing. The second reason lies in the accuracy of the results. If a noticeable level of viscous hydrocarbon (from oil or the solvent used to clean it) is left on the sample, profiling by sputtering will not be as effective in characterizing the film. The contamination is repelled away as sputtering shaves away the surface layers, but quickly flows back into the depressed sputtered region.
As anti-wear films are known to be sensitive to chemical cleaning, a tradeoff exists between measurement accuracy and film removal through intensive cleaning. For example, certain chelating acids such as ethylenediaminetetraacetic acid (EDTA) have been found to rapidly remove films made by ZDDP and OBCaSu [25]. Researchers in the past have cleaned using hexanes and ethanol by rinsing, wiping or ultrasonic cleaning, but due to the different methods of cleaning a number of instances have been documented which reported differences in measured film thickness [10, 37, 38].
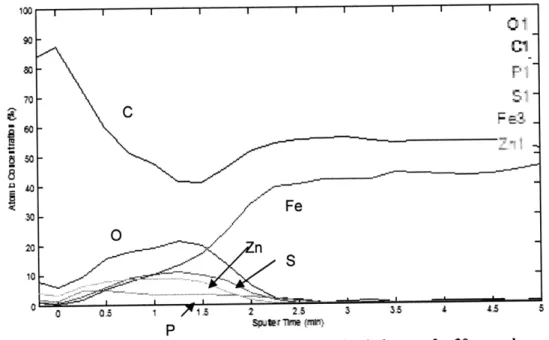
In light of this information, various methods of cleaning were attempted. Initial trials involved ultrasonic cleaning for 20 minutes with hexane. This resulted in "overcleaning," where the anti-wear film was dissolved from -30nm to -6nm. As hexane was adequate in cleaning the oil, following trials corrected for the film removal by reducing the cleaning time to 30 seconds. The result, as shown in figure 4-3, is a noticeable amount of (hydro)carbon contamination. The cause of the contamination may have been oil or hexane itself, as a visible hexane residue was found to remain on the samples after cleaning. To remedy this, a step-wise cleaning method was adopted. The sample was first lightly wiped with hexane to remove most of the oil and then ultrasonically cleaned in hexane for 2.5 minutes. It was then rinsed lightly in acetone to remove the hexane. The acetone was then rinsed off with water. Seemingly satisfactory
results were obtained with this method, but further literature review led to the realization that water rapidly removes the calcium-based tribofilms made from OBCaSu [25]. Another iteration followed in which the water rinsing was omitted, and this modified cleaning procedure was found to leave relatively little contamination while having minimal film disturbance.
However, it is important to note that if the longevity of the AES machine is not of concern, residual hydrocarbon contamination is not completely unfavorable and does not negate the entire analysis. At worst, there will be a misleadingly high signal for carbon, so calculations regarding elemental percentages in the film will be skewed. Besides this, the lack of cleaning means the crucial elements for analysis are left untouched, allowing
for "truer" detection.
90
-ci
0 408
30Fe 20 n 0 05 1 15 2 25 3 35 4 5Figure 4-3 Depth profiling after ultrasonic cleaning in hexane for 30 seconds
A large amount of contamination remains, lingering on past the depth of the film, although the ZDDP film elements are clearly visible. Besides the carbon contamination, the minimal film disturbance achieved with this method is
exceptional. Elemental profiling after sputtering for 5 minutes should have shown over 95% iron.
Analysis with AES was performed using a Physical Instruments PHI 700 Auger Spectrometer. Analyses consisted primarily of elemental depth profiling, using an Argon-ion gun operating at 2kV, 1 iiA and sputtering over a raster area of 2mm x 2mm. The etch rate was calibrated using a 50nm silicon oxide wafer. Settings that resulted in
an etch rate of 8nm/min were used, as it permitted economical analysis time and comparability with past studies [39, 40]. The sputter profile for the calibration wafer is shown in figure 4-4. The sudden change in atomic concentration signals the passage through the oxide layer.
i
°
Si40
0 8 16 24 32 40 48 56 64 72 80
sputter depth (nm)
Figure 4-4 Sputter calibration using a 50nm silicon oxide wafer
Table 4-5 Operation settings for AES Electron gun voltage 10kV
Electron gun current I 0nA
Ion gun voltage 2kV
Ion gun current I LA
Raster size 2 x 2mm
Sample position 30' tilt toward ion gun
Sputter rate 8nm/min Si0 2
As typical samples for AES are smaller than -2cm x 2cm and weigh less than -10 grams, effort was put into making analysis with AES physically possible for the 1" (2.54cm) x 1.4" (3.56cm), 18 gram steel sample. The standard AES sample mount was modified for weight reduction and an aluminum adaptor plate was fabricated to facilitate the mounting of the steel sample. Because the steel test plate was able to be directly placed in the AES
machine without destructive sample preparation, the plates were able to be reused for later tests.
5.
Experimental Results and Analysis
5.1. Thermal Decomposition of ZDDP (Test A)
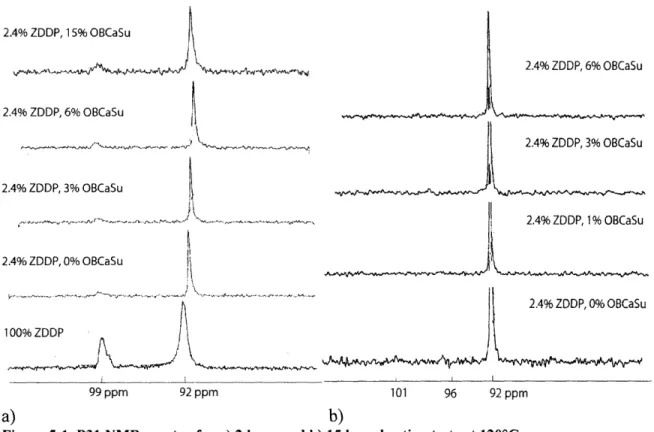
The P31NMR spectra in the following plots show the presence of two peaks, a large peak
at 92-93 ppm and a smaller peak at 99-100 ppm. These two peaks are attributed to the basic and neutral forms of ZDDP in equilibrium [16]. It is interesting to note that a number of changes occur as the ZDDP is introduced into the base oil. The peak corresponding to basic ZDDP decreases and shifts from 99 ppm to 99.8 ppm, suggesting an equilibrium shift from basic to neutral ZDDP and a mild interaction with the base oil, respectively. These results agree well with literature [16, 41]. Also, the neutral ZDDP peak location (chemical shift) is at 92.2 ppm for the oil samples containing 100% and 2.4% (0.2% phos.) ZDDP, but gradually shifts as detergent is added. At 3% OBCaSu, the chemical shift moves to 92.4 ppm, and 92.5 ppm at 6% OBCaSu. No further shifts are observed for the sample at 15% OBCaSu. Previous studies regarding ZDDP interactions with dispersants showed similar trends, with much larger shifts attributed to complexations [42]. Infrared spectroscopy studies by Ramakumar et al. have shown that small shifts in the P=S peak in the FTIR spectrum occur with the introduction of OBCaSu, and that these shifts are not due to complexations or the formation of chemical bonds but instead due to physical cohesion [20]. This is seen here as a small shift in the NMR peak.
2.4% ZDDP, 15% OBCaSu -,, -,.. . ,.k ' ,,,,,-.,.w 2.4% ZDDP, 6% OBCaSu 2.4% ZDDP, 3% OBCaSu 2.4% ZDDP, 0% OBCaSu 10099 ZD ppm 92 ppm 99 ppm 92 ppm 2.4% ZDDP, 6% OBCaSu 2.4% ZDDP, 3% OBCaSu 2.4% ZDDP, 0% OBCaSu 101 96 92 ppm a) b)
Figure 5-1 P31 NMR spectra for a) 2 hour and b) 15 hour heating tests at 1200C.
Note: The spectra are not precisely aligned with each other, so this display may not be used as a reference for peak shift. For larger size figures of the 2 hour heating teat, refer to Appendix D.
After 2 hours of heating at 1200C, a noticeable level of reduction can be seen for the basic form of ZDDP, while the neutral peak shows no signs of decrease. The decrease in the basic peak represents the reduction in the amount of basic ZDDP, which signifies a drastic change in chemical state or the reversion to its neutral form. Previous studies have shown that at elevated temperatures, the equilibrium is shifted towards the neutral ZDDP [2, 41, 13]. It is probable that a very small amount of decomposition is taking place for neutral ZDDP but is compensated by its replenishment from the reversion of basic ZDDP.
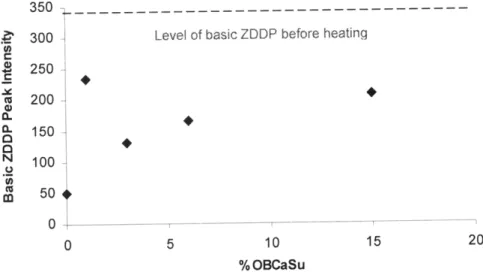
Figure 5-2 displays the effects of OBCaSu in the oil mixture through integration of the NMR spectra. As the concentration of OBCaSu is increased, the amount of basic ZDDP in the mixture is generally found to increase, though all cases show less basic ZDDP than before the heating. Similar trends have been observed in the past, in which OBCaSu was found to shift the ZDDP equilibrium towards the basic form [6].
Continued heating to 5 and 15 hours show a general disappearance of the basic peak, with the exception of 3% OBCaSu, even after 15 hours. With 15 hours of heating, the 0% OBCaSu spectrum develops a minor peak at 101 ppm from the intermediate products formed in the chemical transition from basic to neutral ZDDP [16]. However, at 1200C, even 15 hours of heating has little effect on neutral ZDDP decomposition. When the blends were heated to 1500C for 11 hours, complete decomposition was found as the NMR peaks had disappeared. Further testing at 1500C, heated for approximately 6 to 7 hours, may reveal a more clear effect of OBCaSu on ZDDP decomposition, as suggested
in literature [8, 6, 43]. 350
. 300 - Level of basic ZDDP before heating
250 a 200 (L 150 N 100 m 50 0 0 5 10 15 20 % OBCaSu
Figure 5-2 Effect of OBCaSu on the level of basic ZDDP in oil solution. The values are integrated results of P31NMR spectra. Data taken after 2 hours of heating.
Figure 5-3 Oil samples after 7 hours of heating at 150C
From the left: base oil, no heating for visual reference // base oil // 2.4%ZDDP // 2.4%ZDDP+1%OBCaSu
![Figure 2-1 Lubrication regimes and their effect on the coefficient of friction [9]](https://thumb-eu.123doks.com/thumbv2/123doknet/14732629.573376/18.918.276.673.133.567/figure-lubrication-regimes-effect-coefficient-friction.webp)
![Figure 2-2 Contour plot of the induction time, or the time taken until film formation occurs, for a variety of contact pressures and sliding speeds [10]](https://thumb-eu.123doks.com/thumbv2/123doknet/14732629.573376/20.918.257.659.191.509/figure-contour-induction-formation-variety-contact-pressures-sliding.webp)
![Figure 2-6 Typical layer diagram of an anti-wear film produced from ZDDP [2]](https://thumb-eu.123doks.com/thumbv2/123doknet/14732629.573376/22.918.161.765.169.334/figure-typical-layer-diagram-anti-wear-produced-zddp.webp)