COMPUTATIONAL COMPARATIVE GENOMICS: GENES, REGULATION, EVOLUTION
by
Manolis (Kellis) Kamvysselis
B.S. Electrical Engineering and Computer Science; M. Eng. Computer Science and Engineering Massachusetts Institute of Technology, 1999
Submitted to the Department of Electrical Engineering and Computer Science In Partial Fulfillment of the Requirements for the Degree of
Doctor of Philosophy in Computer Science at the
Massachusetts Institute of Technology June 2003
C 2003 Massachusetts Institute of Technology All rights reserved
Signature of Autho ... ... ngineerimuter Science May 22, 2003 C ertified by ... Eric S. Lander Professor of Biology Thesis Co-Supervisor Certified by ..
MASSA CHUSETTS INSTITUTE
OF TECHNOLOGY
JUL 07 2003
LIBRARIES
.. ...
... ...
Bonnie A. Berger Professor of Applied Mathematics Thesis Co-Supervjsr A ccepted by ...Arthur C. Smith
Chairman, Committee on Graduate Students Department of Electrical Engineering and Computer Science
Computational Comparative Genomics: Genes, Regulation, Evolution
by
Manolis (Kellis) Kamvysselis
Submitted to the Department of Electrical Engineering and Computer Science on May 23, 2003 in Partial Fulfillment of the Requirements for the Degree of
Doctor of Philosophy in Computer Science
ABSTRACT
Understanding the biological signals encoded in a genome is a key challenge of computational biology. These signals are encoded in the four-nucleotide alphabet of DNA and are responsible for all molecular processes in the cell. In particular, the genome contains the blueprint of all protein-coding genes and the regulatory motifs used to coordinate the expression of these genes. Comparative genome analysis of related species provides a general approach for identifying these functional elements, by virtue of their stronger conservation across evolutionary time.
In this thesis we address key issues in the comparative analysis of multiple species. We present novel computational methods in four areas (1) the automatic comparative annotation of multiple species and the determination of orthologous genes and intergenic regions (2) the validation of computationally predicted protein-coding genes (3) the systematic de-novo identification of regulatory motifs (4) the determination of combinatorial interactions between regulatory motifs.
We applied these methods to the comparative analysis of four yeast genomes, including the best-studied eukaryote, Saccharomyces cerevisiae or baker's yeast. Our results show that nearly a tenth of currently annotated yeast genes are not real, and have refined the structure of hundreds of genes. Additionally, we have automatically
discovered a dictionary of regulatory motifs without any previous biological knowledge. These include most previously known regulatory motifs, and a number of novel motifs.
We have automatically assigned candidate functions to the majority of motifs discovered, and defined biologically meaningful combinatorial interactions between them. Finally, we defined the regions and mechanisms of rapid evolution, with important biological
implications.
Our results demonstrate the central role of computational tools in modern biology. The analyses presented in this thesis have revealed biological findings that could not have been discovered by traditional genetic methods, regardless of the time or effort spent. The methods presented are general and may present a new paradigm for understanding the genome of any single species. They are currently being applied to a kingdom-wide exploration of fungal genomes, and the comparative analysis of the human genome with that of the mouse and other mammals.
Thesis Co-Supervisor: Eric Lander, professor of Biology
TABLE OF CONTENTS
O VERV IEW ... 7
Biological Signals... 7
Contributions of this thesis... 9
BACKG RO UN D ... 13
0.1. M olecular biology and the study of life. ... 13
0.2. G ene regulation and the dynam ic cell ... 15
0.3. Evolutionary change and com parative genom ics ... 17
0.4. Sequence alignm ent and phylogenetic trees... 19
0.5. M odel organism s and yeast genetics ... 20
0.6. Genom e sequencing and assem bly ... 22
CHA PTER 1: G EN O M E CO RRESPONDEN CE ... 25
1.1. Introduction ... 25
1.2. Establishing gene correspondence... 26
1.3. O verview of the algorithm ... 27
1.4. A utom atic annotation and graph construction... 28
1.5. Initial pruning of sub-optim al m atches ... 30
1.6. Blocks of conserved synteny ... 30
1.7. Best Unam biguous Subsets ... 32
1.8. Perform ance of the algorithm ... 34
1.9. Conclusion... 36
CHA PTER 2: G EN E IDEN TIFICA TION ... 37
2.1. Introduction ... 37
2.2. D ifferent conservation of genes and intergenic regions ... 38
2.3. Reading Fram e Conservation Test ... 40
2.4. Results: Hundreds of previously annotated genes are not real... 42
2.5. Refining Gene Structure... 44
2.6. Analysis of sm all O RFs... 48
2.7. Conclusion: Revised yeast gene catalog ... 50
CHAPTER 3: REGULATORY MOTIF DISCOVERY... 51
3.1. Introduction ... 51
3.2. Regulatory m otifs ... 52
3.4. Conservation properties of known regulatory m otifs... 55
3.5. G enom e-w ide m otif discovery ... 58
3.7. Results and com parison to know n m otifs... 63
3.8. Conclusion... 64
CHAPTER 4: REGULATORY MOTIF FUNCTION ... 65
4.1. Introduction ... 65
4.2. Constructing functionally-related gene sets. ... 66
4.3. A ssigning a function to the genome-w ide m otifs... 67
4.4. D iscovering additional m otifs based on gene sets... 71
4.7. Conclusion... 74
CHAPTER 5: COMBINATORIAL REGULATION ... 75
5.1. Introduction ... 75
5.2. M otifs are shared, reused across functional categories ... 75
5.3. Changing specificity of m otif com binations. ... 77
5.4. G enom e-w ide m otif co-occurrence m ap. ... 78
5.5. Results. ... 79
5.6. Conclusion... 80
CHA PTER 6: EVO LUTION A RY CHANG E ... 81
6.1. Introduction ... 81
6.2. Protein fam ily expansions localize at the telom eres. ... 82
6.3. Chromosomal rearrangements mediated by specific sequences. ... 84
6.4. Sm all num ber of novel genes separate the species... 85
6.5. Slow evolution suggests novel gene function. ... 86
6.6. Evidence and m echanism s of rapid protein change. ... 87
6.7. Conclusion... 89
CON CLU SION ... 91
C.1. Sum m ary... 91
C .2. Extracting signal from noise... 92
C.4. The road ahead... 94
REFERENC ES ... 95
ACKNOWLEDGEMENTS
I am indebted to Eric Lander, Bonnie Berger and Bruce Birren for their constant help, advice, support, and mentorship in all aspects of my thesis and graduate career. Many thanks to my colleague Nick Patterson whose help and advice contributed to chapters 3 and 4, to David Gifford and Gerry Sussman for their advice, and to my friends Serafim Batzoglou, Sarah Calvo, James Galagan, Julia Zeitlinger for invaluable advice and support.
I would like to acknowledge the contribution of Matt Endrizzi and the staff of the Whitehead/MIT Center for Genome Research Sequencing Center, who generated the shotgun sequence from the three yeast species; David Botstein, Michael Cherry, Kara Dolinski, Diana Fisk, Shuai Weng and other members of the Saccharomyces Genome Database staff for assistance and discussions, and for making the data available to the community through SGD; Ed Louis and Ian Roberts who provided the yeast strains; Tony Lee, Nicola Rinaldi, Rick Young and the Young Lab for sharing data about chromatin immunoprecipitation experiments and for discussions; Michael Eisen and Audrey Gasch for sharing information about gene expression clusters and for discussions.
Many thanks to Gerry Fink, Martin Kupiec, Sue Lindquist, Andrew Murray, Heather True-Krobb for discussions and understanding of yeast biology. Many thanks to Jon Butler, Gus Cervini, Ken Dewar, Leslie Gaffney, David Jaffe, Joseph Lehar, Li Jun Ma, Abigail Melia, Chad Nusbaum and members of the WICGR for help and discussions.
I owe my gratitude to my parents John and Anna Kamvysselis, to my siblings Peter and Maria, and to Alexandra Mazalek for their love and constant support.
OVERVIEW
Biological Signals
Understanding the biological signals encoded in a genome is a key challenge of modern biology. These signals are encoded in the four-nucleotide alphabet of DNA and are responsible for all molecular processes in the cell. In particular, the genome contains the blueprint of all protein-coding genes and the control signals used to coordinate the expression of these genes. The well-being of any cell relies on the successful recognition of these signals, and a large number of biological mechanisms have evolved towards this goal. Specific protein complexes are responsible for the copying of a gene segment from DNA to messenger RNA (transcription) and for its eventual translation into protein following the genetic code to assign an amino acid to every tri-nucleotide codon. A specific class of proteins called transcription factors help recruit the transcription machinery to a target gene by binding their specific DNA signals (regulatory motifs) in response to environmental conditions. An abundance of information within the cell guides these processes, involving protein-protein and protein-DNA interactions between a multitude of players, the state of DNA coiling, and other mechanisms that are still not well-understood.
The computational identification of genes however, can only rely on the primary DNA sequence of the organism. Current programs use properties about the protein-coding potential of DNA segments that are unseen by the transcription machinery. In particular, since genes always start with an ATG (start codon) and end in with TAG, TGA, or TAA (one of three stop codons), programs exist that specifically look for these stretches between a start and a stop codon called ORFs (Open Reading Frames). The basic approach is to identify ORFs that are too long to have likely occurred by chance. Since stop codons occur at a frequency of 3 in 64 in random sequence, ORFs of 60 or even 150 amino acids will occur frequently by chance, but longer ORIs of 300 or thousands of amino acids are virtually always the result of biological selective pressure. Hence, simple computational programs can easily recognize long genes, but many small genes will be indistinguishable from spurious ORFs arising by chance. This is evidenced by the considerable debate over the number of genes in yeast, with proposed counts ranging from 4800 to 6400 genes. The situation is worse for organisms with large,
complex genomes, such as mammals where estimated gene counts have ranged from 30 to 120 thousand genes.
The direct identification of the repertoire of regulatory motifs in a genome is even more challenging. Regulatory motifs are short (typically 6-8 nucleotides), and do not obey the simple rules of protein-coding genes. In any single locus, nothing distinguishes these signals from random nucleotides. Traditionally, their discovery relied on deletion studies of consecutive DNA segments until regulation was disrupted and the control region was identified6. With the sequence of multiple genes in the same pathway at hand, it became possible to search for the repetition of these signals in genes controlled by the same transcription factor. Computational methods have been developed to search for enriched sequence motifs in predefined sets of genes (for example, using expectation-maximization7 or gibbs-sampling8, reviewed in 9). As microarray analysis provided genome-wide levels of gene expression under a various experimental conditions, computational methods of gene clustering have resulted in hundreds of such sets of genes. Various computational methods have been used to mine these sets for regulatory motifs, and dozens of candidate motifs have resulted from each search. The vast majority of these candidate motifs are due to noise however, and only a total of about 50 real motifs have currently been discovered.
The current methods of motif identification suffer from a number of limitations. (a) First and foremost is that the weak signal of small motifs is hidden in the noise of relatively large intergenic regions. This inherent signal to noise ratio limits even the best programs from recognizing true motifs in the input data. (b) Additionally, the sets of genes searched, and hence the motifs discovered, are limited by our current biological knowledge of co-regulated sets of genes. The current knowledge is based on the
experimental conditions reproduced in the lab, which is likely to be a small fraction of the vast array of environmental responses yeast uses to survive in its natural habitat. (c) Finally, an emerging view of gene regulation has put in question the approaches that search for a single motif responsible for a pathway or environmental response. Pathways are not regulated as isolated components in the cell. Genes and transcription factors have multiple functions and are used in multiple pathways and environmental responses. More importantly, transcription factors do not act in isolation, and protein-protein interactions
between factors are as important as protein-DNA interactions between each individual
factor and its target genes. Hence, individual gene sets will be enriched in multiple
motifs, and individual motifs will be enriched in multiple gene sets. A comprehensive
understanding of regulatory motifs requires a novel, more powerful approach.
Comparative genome analysis of related species should provide such a general
approach for identifying functional elements without prior knowledge of function.
Evolution relentlessly tinkers with genome sequence and tests the results by natural
selection. Mutations in non-functional nucleotides are tolerated and accumulate over
evolutionary time. However, mutations in functional nucleotides are deleterious to the
organism that carries them, and become sparse or extinct. Hence, functional elements
should stand out by virtue of having a greater degree of conservation across the genomes
of related species. Recent studies have demonstrated the potential power of comparative
genomic comparison. Cross-species conservation has previously been used to identify
putative genes or regulatory elements in small genomic regions1
0-
3. Light sampling of
4,14
whole-genome sequence has been used as a way to improve genome annotation'
Complete bacterial genomes have been compared to identify pathogenic and other
genes
1-18.Genome-wide comparison has been used to estimate the proportion of the
mammalian genome under selection9.
Contributions of this thesis
The goal of this thesis is to develop computational comparative methods to
understand genomes. We develop and apply general approaches for the systematic
analysis of protein-coding and regulatory elements by means of whole-genome
comparisons with multiple related species. We apply these methods to Saccharomyces
cerevisiae, commonly known as baker's yeast. S. cerevisiae is a model organism for
which many genetic tools and techniques have been developed, leading to a wealth of
experimental information. This knowledge has allowed us to validate our biological
predictions and assess the power of the methods developed. We generated high-quality
draft genome sequences from three Saccharomyces species of yeast related to S.
cerevisiae. These data provide us with invaluable comparative information currently
unmatched by previous sequencing efforts. Starting with the raw nucleotide sequence
assemblies of the three newly sequenced species and the current sequence and annotation
of S. cerevisiae, we set out to discover functional elements in the yeast genome based on the comparison of the four species.
We first present methods for the automatic comparative annotation of the four species and the determination of orthologous genes and intergenic regions (Chapter 1). The algorithms enabled the automatic identification of orthologs for more than 90% of genes despite the large number of duplicated genes in the yeast genome.
Given the gene correspondence, we construct multiple alignments and present comparative methods for gene identification (Chapter 2). These rely on the different patterns of nucleotide change observed in the alignments of protein coding regions as compared to non-coding regions, specifically the pressure to conserve the reading frame of proteins. The method has high specificity and sensitivity, and enabled us to revisit the current gene catalogue of S.cerevisiae with important biological implications.
We then turn to the identification of regulatory motifs (Chapter 3). We present statistical methods for their systematic de-novo identification without use of prior
biological information. We automatically identified 72 genome-wide sequence elements, with strongly non-random conservation properties. To validate our findings, we
compared the discovered motifs against a list of known motifs, and found that we discovered virtually all previously known regulatory motifs, and an additional 41 motifs. We assign function to these motifs using sets of functionally related genes (Chapter 4), and we discover additional motifs enriched in these sets.
We further present methods for revealing the combinatorial control of gene expression (Chapter 5). We study the genome-wide co-occurrence of regulatory motifs, and discover significant correlations between pairs of motifs that were not apparent in a single genome. We show that these correspond to biologically meaningful relationships between the corresponding factors and that motif combinations can change the specific functional enrichment of target genes, thus increasing the versatility of gene regulation using only a limited number of regulatory motifs.
We finally focus on the differences between the species compared and discover the regions and mechanisms of evolutionary change (Chapter 6). We study rapid gene family expansions and discover that they localize in the telomeres. We show that
We find specific mechanisms of rapid protein change in environment adaptation genes, as
well as stretches of unchanged nucleotides suggesting novel functions for uncharacterized
genes.
Our results demonstrate the central role of computational tools in modern biology.
Our methods are general and applicable to the study of any organism. They are currently
being applied to a kingdom-wide exploration of fungal genomes and the comparative
analysis of the human genome with that of the mouse and other mammals. Comparison
of multiple related species may present a new paradigm for understanding the genome of
any single species.
BACKGROUND
0.1. Molecular biology and the study of life.
It is both humbling and bewildering that what separates humans from bacteria is merely the organization and assembly of the same basic bio-molecules. It is the study of these shared foundations of life that gave rise to the discipline of molecular biology. In the microscopic level, complex and simple organisms alike are made up of the same unit of life, the cell. A cell contains all the information and machinery necessary for its growth, maintenance and replication. It is delimited from its surrounding by a water-impermeable membrane and all communication and transport across the membrane is tightly controlled. Two major types of cells exist, prokaryotic cells with simple internal organization, and eukaryotic cells, with extensive compartmentalization of functions such as information storage in the nucleus, energy production in mitochondria, metabolism in the cytoplasm, etc. In unicellular organisms, the cell constitutes the complete organism, whereas multi-cellular organisms (typically eukaryotes) can contain up to trillions of cells, and hundreds of specialized cell types. In either case though, a cell can rarely be thought of in isolation, but is constantly interacting with its surrounding, sensing the presence of environmental changes, and exchanging stimuli with other cells that may be part of the same colony or organism.
Within a cell, virtually all functional roles are fulfilled by proteins, the most versatile type of macromolecule. Various types of proteins fulfill an immense array of tasks. For example, enzymes catalyze countless chemical reactions; transcription factors control the timing of gene usage; transporters carry molecules inside or outside the cell; trans-membrane channels regulate the concentrations of molecules in the cell; structural proteins provide support and shape to the cell; actins can cause motion; receptors recognize intra- or extra-cellular signals. This incredible versatility of proteins comes from the innumerable combinations of an alphabet of only 20 amino acid building blocks, juxtaposed in a single unbranched chain of hundreds or thousands of such amino acids.
All amino acids share an identical portion of their structure that forms the protein backbone, to which is attached one of 20 possible side chains of variable size, shape, charge, polarity, hydrophobicity. The precise sequence of amino acids dictates a unique
three-dimensional fold that optimizes electrostatic and other interactions between the side-chains and with the solvent.
DNA in turn carries the genetic information that encodes the precise sequence of
all proteins, the signals that control their production, and all other inheritable traits. DNA is also a macromolecule, consisting of the linear juxtaposition of millions of nucleotides. It encodes the genetic information digitally, like the bits of a digital computer, in the precise ordering of four types of nucleotides. Like amino-acids, these nucleotides share a fixed portion that forms a (phosphate) backbone to which is connected (via a deoxyribose sugar) a variable portion that is one of four bases, abbreviated A, C, G, T. Unlike
proteins however, the structure of DNA is fixed. It consists of two strands, like the sidepieces of a ladder, connected by pairs of bases, like the steps of ladder. The two strands are wrapped around each other and form a double-helix. The two phosphate backbones form the outside of the helix, and the base pairs, connected by weak hydrogen bonds, form the interior of the helix. Only two pairings of bases are possible, based on shape and charge complementarity: A always pairs with T and C always pairs with G. This self-complementarity of the DNA structure forms the very basis of heredity: during DNA replication, the two strands open locally, and each strand becomes the template for synthesizing the opposite strand, its sequence dictated by base complementarity. The DNA double helix is rarely exposed. It is typically wrapped around histone proteins and packaged in a coiled structure referred to as chromatin.
The complete DNA content of an organism is referred to as its genome, and is contained in one or more large uninterrupted pieces called chromosomes. Prokaryotic cells contain one circular chromosome, and eukaryotic cells contain varying numbers of linear chromosomes (16 in yeast, 23 pairs in human) that are compartmentalized within the cell nucleus. Each linear chromosome is marked by a well-defined central region, the
centromere and the chromosomal endpoints called telomeres. In a multi-cellular
organism, every cell contains an identical copy of the genome (with extremely few exceptions such as red blood cells that do not have a nucleus). In addition to the chromosomal DNA, cells typically contain additional small pieces of DNA in plasmids (small circular pieces found in bacteria and typically containing antibiotic resistance genes), or mitochondria and chloroplasts (energy production organelles found in
eukaryotes). Genome size varies widely across species, typically 5kb-200kb (kilo-bases)
for viruses2 0 2 2, 500kb to 5Mb for bacteria15, 10-30Mb for unicellular fungi23,24, 97Mb for
25 1927 28
the worm
,165Mb for the fly
26, 2-3Gb for mammals' ,, and 100Mb- 100Gb for plants
The amino-acid sequence of every protein is encoded within a single continuous
stretch of DNA called a gene. The transfer of information from the four-letter nucleotide
alphabet of DNA to the 20 amino-acid alphabet of proteins is ensured by a process called
translation. Consecutive nucleotide triplets (codons) are translated into consecutive
amino-acid residues, according to a precise translation table, referred to as the genetic
code. There are 64 possible codons and only 20 amino acids, hence the genetic code
contains degeneracies, and the same amino acid can be encoded by multiple codons.
Additionally, the codon ATG (that codes for Methionine) also serves as a special
translation initiation signal, and three codons (TGA, TAG, TAA) are dedicated
translation termination signals. These are typically called start and stop codons. DNA is
a directional molecule, and so are proteins. DNA is always read and synthesized in the 5'
to 3'direction (named after the 5' and 3' carbons in the carbon-ring of the sugar). Given
this directionality of either strand, we can refer to sequences upstream (5') or
downstream (3') of a particular nucleotide on the same strand. The two complementary
strands run in opposite direction and are called anti-parallel, hence upstream in one strand
is complementary to downstream on the opposite strand. Upstream and downstream are
typically used in relation to the coding strand of a gene (containing the sequence ATG).
Proteins are synthesized from the N terminus (encoded by the 5' part of the gene) to the
C terminus (encoded by the 3' part of the gene).
0.2. Gene regulation and the dynamic cell
DNA is not directly translated into protein, but it is first transferred by
complementarity into an intermediary single-stranded information carrier called
messenger RNA or mRNA in a process called transcription. The Central Dogma of
biology refers to this transfer of the genetic information from DNA to RNA to protein.
RNA is similar to DNA, but is single-stranded and contains a different type of sugar
connector between the phosphate backbone and the variable base (also the four bases are
A,C,G,U instead of A,C,G,T). This difference in structure enables RNA to assume
complex three-dimensional folds and perform a variety of cellular functions, only one of
which is information transfer between DNA and protein. In eukaryotic cells, transcription occurs in the nucleus where the DNA resides, and the resulting mRNA molecule is then transferred outside the nucleus where the translation machinery resides. During this transfer, the transcript undergoes a maturation step, including the excision
(called splicing) of untranslated gene portions (called introns), and the joining of the
remaining portions of the transcribed gene that are typically translated (called exons). The splicing of introns is dictated by subtle signals between 6 and 8 bp (base pairs) long that are found mainly at the junctions between exons and introns and within each intron. In prokaryotic cells, transcripts do not undergo splicing and sometimes contain multiple consecutively translated genes of related function.
The process of protein and RNA production, also called gene expression, is tightly controlled at multiple stages, but mainly at the stage of transcription initiation.
This involves the uncoiling of chromatin structure around the gene to be expressed and the recruitment of a number of protein players that include the transcription machinery.
These processes are regulated by a specific class of DNA-binding proteins called
transcription factors. These bind the double-stranded DNA helix in sequence-specific binding sites, recognizing electrostatic properties of the nucleotides at each contact point.
A regulatory motif describes the sequence specificity of a transcription factor, namely,
the nucleotide patterns that are in common to the sites bound. Transcription factors are classified according to their effect on the expression of their target genes: an activator increases the level of gene expression when bound, and a repressor decreases that level. Transcription factor binding is modulated by the protein concentration and localization of the transcription factor, the three-dimensional conformation of the transcription factor that may depend on chemical modifications, protein-protein interactions with other factors that may bind cooperatively or competitively, and chromatin accessibility
GAL1
Transcription factors Mig1 and Gal4 G mRNA recognize specific regulatory motifs to
induce or repress transcription of the protein
GAL1 gene and its eventual translation.
surrounding the binding site. Finally, in addition to transcription initiation, gene
expression is regulated at many stages, including mRNA transport and splicing,
translation initiation and efficiency, mRNA stability and degradation, post-translational
modifications of a protein, and protein stability.
These processes together modulate gene expression in response to environmental
changes, and are interlinked in complex regulatory networks, responsible for the dynamic
nature of the cell. These dynamics create the multitude of specific cell responses to
varying environmental stimuli. Gene regulation also creates the incredible variety of cell
types found within the same organism. For example heart, liver, lung, nail, skin, eye,
neurons, hair, or bone all have the exact same DNA content, but express a different set of
genes. Changes in gene expression however, can also be responsible for a number of
complex diseases. Understanding the dynamic cell is a major challenge for molecular
biology and modem medicine.
0.3. Evolutionary change and comparative genomics
The evolution of these complex mechanisms was shaped by the forces of random
change and natural selection. Random genomic change can generate new functions or
disrupt existing ones, and natural selection favors and keeps the fittest combinations. The
genotypic differences accumulated at the DNA level lead to observed phenotypic
differences between individuals of a population. Genomic changes can be as subtle as
the mutation, insertion or deletion of individual nucleotides, and as drastic as the
duplication or loss of chromosomal segments, entire chromosomes, or complete
genomes. Changes in a protein-coding gene can lead to multiple co-existing variants, or
alleles, of that gene within a population, that differ in specific residues and perform the
same function with slight differences. As the result of mating, the progeny will inherit a
combination of paternal and maternal alleles for different genes. The random mating of
individuals within a populations and the random segregation of chromosomal segments in
gamete formation creates new allelic combinations at each generation. The frequency of
these allelic combinations will vary through evolutionary time, either by selection for
their evolutionary fitness or by random genetic drift. As populations segregate and adapt
to their environment, different combinations of alleles dominate in each population. The
reproductive ability across sub-populations and the emergence of new species. The emergence of new functions in these changing species allowed adaptation to all niches on land, in the air, underground, or in the deepest oceans, in species as diverse as dinosaurs and amoebae. It is thought that all life in the planet descends from a single ancestral cell that lived around 3.5 billion years ago, and the incredible biodiversity observed today resulted from incremental changes of existing life forms.
The genomes of related species exhibit similarities in functional elements that have undergone little change since the species' common ancestor. Deleterious mutations in these functional regions have certainly occurred, but the individuals carrying them have been at a disadvantage and eventually eliminated by natural selection. Mutations in non-functional regions have no effect to an organism's reproductive fitness, and will accumulate over evolutionary time. Hence, the combined effects of random mutation and natural selection allow comparative approaches to separate conserved functional regions from diverged non-functional regions. Comparative genome analysis of related species should provide a general approach for identifying functional elements without prior knowledge of function, by virtue of having a greater degree of conservation across the genomes of related species. When selecting species for a pairwise comparative analysis, we face a tradeoff between closely related species (with many common functional elements but additional spuriously conserved non-functional regions), and distantly related species (with mostly diverged non-functional regions but fewer common functional elements). The use of multiple closely-related species may present an attractive alternative, exhibiting an accumulation of independent mutations in non-functional regions, while having most biological functions in common.
Recent studies have demonstrated the potential power of comparative genomic comparison. Cross-species conservation has previously been used to identify putative genes or regulatory elements in small genomic regionsI -3. Light sampling of
whole-4,14
genome sequence has been studied as a way to improve genome annotation' .Complete 15-18
bacterial genomes have been compared to identify pathogenic and other genes'
Genome-wide comparison has been used to estimate the proportion of the mammalian genome under selection19.
0.4. Sequence alignment and phylogenetic trees
The comparison of related sequences is typically represented as sequence
alignment (for an example see figure 3.2). The correspondence of nucleotides across the
sequences compared is given by offsetting the nucleotides of each sequence such that matching nucleotides are stacked at the same index across all sequences. To represent insertions or deletions (indels), gaps are typically inserted as dashes in the shorter sequence; these could represent a deletion in the sequence containing the gap, or an insertion in the other sequences. Typically, no reordering or repetition of nucleotides is allowed within a sequence, and hence no inversions, duplications, or translocations are represented in a sequence alignment. To construct an alignment of two sequences is equivalent to finding the optimal path in a two-dimensional grid of cells, and dynamic programming algorithms have been developed to align two sequences in time
proportional to the product of their lengths, and space proportional to sum of their lengths. The optimal alignment of two sequences minimizes the total cost of insertions, deletions, and nucleotide substitutions (gaps and mismatches), each penalized according to input parameters. These parameters are set to match estimated rates of insertions, deletions and nucleotide substitutions in well-conserved portions of carefully-constructed alignments. For example, substitutions between nucleotides of similar structure are more frequent and hence transitions between purines (A and G) or between pyrimidines (C and T) are penalized less than transversions from a purine to a pyrimidine and vice versa. Also, it is typical to penalize gaps using affine functions, namely adding a cost
proportional to the size of the gap to a fixed cost for starting a gap. Global alignments compare the entire length of the sequences compared, and local alignments only align sub-portions of the sequences.
The best match of a query sequence can be found in a database of sequences by scoring the local alignments between the query and each sequence in the database. Constructing the full dynamic programming matrix for each of the sequences in a large database can be costly, and efficient algorithms have been developed to only align a small subset of the database sequences. These algorithms take advantage of the fact that strong matches of a query sequence will typically contain stretches of perfectly conserved residues, and first select all database sequences that contain such stretches. To do so, a
hash table is first constructed for the database, listing all sequences and positions that
contain a particular k-mer. After this slow step that need only be performed once, the
lookup of all k-mers in a query sequence can be performed rapidly against a large
database, constructing a list of hits. Local alignments are then constructed around each
hit, extending the k-mer matches to longer high-scoring local alignments. These ideas
are implemented in the popular program BLAST, and used thousands of times daily to
query the genomes of dozens of sequenced species and millions of sequences. One
modification of the BLAST algorithm called two-hit Blast only constructs a local
alignment when at least two nearby hits are found. This allows the retrieval of more
distantly related sequences by searching for shorter k-mers, while still maintaining high
specificity by requiring multiple k-mer hits in common.
Multiple sequence alignments can also be constructed for more than two
sequences. Constructing the full dynamic programming matrix is exponential in the
number of sequences compared and typically impractical for long sequences. Therefore,
current algorithms work by extending multiple pairwise alignments between the
sequences compared. The similarities between all pairs of sequences can be used to
construct a phylogenetic tree, summarizing the most likely ancestry of the sequences,
linking them hierarchically from the most closely related pair to the most distantly related
outgroup. Multiple sequence alignment algorithms typically start by aligning the most
closely related sequences, and progressively merge alignments moving up the
phylogenetic tree from the leaves to the root. Algorithms to merge two alignments
typically use once-a-gap-always-a-gap methods, but more recent algorithms have been
developed to locally re-optimize multiple alignment portions by revisiting previously
added gaps and improving the overall alignment score.
0.5. Model organisms and yeast genetics.
The shared biology of related species allows one to study a biological process in
one organism and apply the knowledge to another organism. Simpler organisms provide
excellent models for developing and testing the procedures needed for studying the much
more complex human genome. Such model organisms include bacteria, yeast, fungi,
worms, flies and mice, each teaching us different aspects of human biology. For
has lead to medical application in humans. Mutant strains can be isolated containing
specific defects in genes that lead to disease phenotypes. Controlled crosses can
be used
to restore lost functions or inhibit genes at particular stages of development and study
their effects on the organism. The shorter the generation time of a model organism,
the
easier it is to perform multiple crosses.
The yeast Saccharomyces cerevisiae in
particular provides a powerful genetic system
with the availability of a wide array of tools such
as gene replacement, plasmids, deletion strains,
two-hybrid systems. Yeast is also amenable to
biochemical methods, such as the purification and
characterization of protein complexes. Because of
Figure 0.2. The yeast Saccharomycesthese experimental advantages, yeast has been the cerevisiae undergoing cell division.
system of choice to study the most basic cellular
functions common to eukaryotes such as cell division, cell structure, energy production,
cell growth, cell death, cell cycle, gene regulation, transcription initiation, cell signaling,
and other basic cell processes. More recently, yeast has become the organism of choice
for the development and testing of modem technologies for genome-wide experimental
studies. The complete parts-list of all genes has radically changed the face of biological
research. If a particular phenotype is due to the function of a single protein,
it is
necessarily encoded by one of these few thousand genes. Additionally, the
relatively
small number of genes (-6000) allows the simultaneous observation of the
complete
genome for mRNA expression, transcription factor binding, or protein-protein
interactions.
The public sharing of yeast strains, materials, and genome-wide
experimental data has provided a global view of the dynamic yeast genome unmatched
in
any other organism.
Yeast also presents an ideal organism for developing computational methods for
genome-wide comparative analysis. It is the most well-studied eukaryote, and
the vast
functional knowledge allows the immediate validation of our findings against previous
work. Additionally, the strong experimental system allows the experimental follow-up
of
biological hypotheses raised in the comparative work. The small genome size (250 times
smaller than human) allows the sequencing of multiple yeast species at an affordable
cost. Additionally, the small number of repetitive elements allows for easy
whole-genome-shotgun assembly (see next section). For all these considerations, we decided to
work on yeast.
0.6. Genome sequencing and assembly
We sequenced and assembled the complete genomes of S. paradoxus, S. mikatae
and S. bayanus, three yeast species that are close relatives of S. cerevisiae, within the
Saccharomyces sensu stricto group29 . Their divergence times from the S. cerevisiae
lineage are approximately 5, 10 and 20 million years (based on sequence divergence of
ribosomal DNA sequence).
Like S. cerevisiae, they all
20Myr
S.cerevisiae
S.paradoxus
have 16 chromosomes and
150Myr
their
genomes
contain
S.mikatae
about 12 million bases.
S.bayanus
These species were chosen
based on their evolutionary
Kluyveromyces
relationships
(closely
S.pombe
enough
related
that
functional elements be Figure 0.3: Phylogenetic tree of analyzed species. The newly conserved, and distant sequenced species are shown in bold. Star denotes inferred
genome-wide duplication of the yeast genome. Divergence times enough that non-functional are approximate and based on ribosomal DNA sequence divergence
bases have had enough
evolutionary time to diverge).
Reading the order of the nucleotides in any one segment of DNA relies on a
technology developed by Sanger in 1977 that uses the central agent of DNA replication,
DNA polymerase. This protein complex recognizes the transition from double-stranded
DNA to single-stranded DNA in an incomplete helix, and extends the shorter strand in
the 5' to 3' direction. By introducing a small fraction of faulty nucleotides that cause an
early termination of the extension reaction, and subsequently comparing the lengths of
resulting fragments in each of four reactions, this method infers the sequence of a DNA
fragment. The extension reaction can be initiated at any unique segment of DNA by
introducing a complementary segment called a primer. This primer binds single-stranded
DNA by complementarity, creating the double-strand to single-strand transition
recognized by DNA polymerase. Unfortunately, since the Sanger method works by
weight separation between fragments of different lengths, it can only determine the
sequence of small fragments (currently around 800 nucleotides). The weight difference
between fragments of 800 nucleotides and fragments of 801 nucleotides is too small to be
detected reliably.
To obtain the sequence of longer stretches of DNA, two methods are possible.
One is to synthesize a new primer at the end of 800 nucleotides and use it to sequence the
subsequent 800 nucleotides (and so on). Unfortunately, synthesizing new primers is
expensive and time-consuming since the primer to be used is not known until the
sequence is obtained, and this method is rarely used. An alternative method is to first
make many copies of the longer stretch of DNA and randomly break them into small
fragments, and then sequence 800 nucleotide reads from each of these fragments and
re-piece them together computationally (each of the fragments is inserted to a common
vector whose sequence is known, hence the same primer can be used to sequence the end
of each of these fragments). This alternative method is called shotgun sequencing, in
reference to the random breaking of the longer fragment as if struck by a shotgun.
Sequence reads can also be obtained from both ends of a fragment, providing linking
information between paired reads. This method is called paired-end shotgun
sequencing. The shotgun fragments are typically selected to be of a particular size,
providing additional information about the genomic distance between paired sequence
reads.
Shotgun sequencing depends heavily on the computational ability to correctly
assemble the resulting fragments of sequence. Fragment assembly searches for
sequences common between two sequence fragments (also called reads) and unique
otherwise, in order to join them into a longer sequence. This is made harder due to
sequencing errors that lead to sequence differences between reads that really come from
the same part of the genome, as well as repetitive sequences within genomes that lead to
identical sequences between reads that come from different parts of the genome. Modern
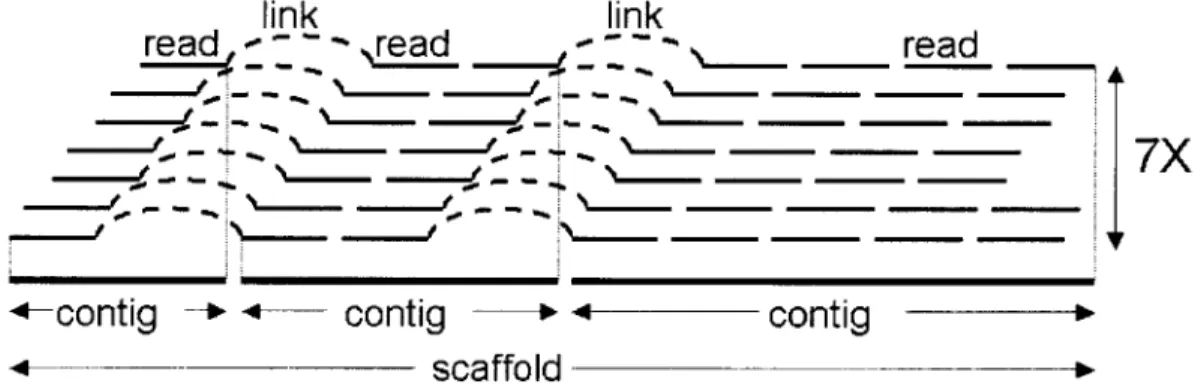
assembly programs produce stretches of continuous sequence called contigs, which are
linked into supercontigs or scaffolds, when their relative order, orientation, and estimated
spacing is given by the pairing of reads (Figure 0.4). To assemble complete genomes,
two methods are currently in use. Whole-genome shotgun (WGS) randomly breaks the
complete genome and assembles all fragments computationally. Clone-based methods
first partition the genome into large fragments (clones) and then use shotgun sequencing
for each of the fragments. Clone-based methods are more expensive but more reliable.
WGS methods are cheaper but rely more heavily on the ability of subsequent
computational assembly programs. Hybrids between WGS and clone-based methods are
used nowadays in major sequencing projects. It is also common to use WGS with links
of multiple sizes to provide both short-range and long-range connectivity information.
link
link
read.
::read
~
:_ _read--
-
---
7X
-contig
contig
contig
scaffold
Figure 0.4 Genome Assembly. Overlapping sequence reads are grouped into blocks of continuous sequence (contigs). The pairing of forward and reverse reads provides links across neighboring contigs, grouping them in supercontigs or scaffolds. Each base in the genome is observed on average in 7 overlapping reads.
CHAPTER 1: GENOME CORRESPONDENCE 1.1. Introduction
The first issue in comparative genomics is determining the correct correspondence of chromosomal segments and functional elements across the species compared. This
involves the recognition of orthologous segments of DNA that descend from the same region in the common ancestor of the species compared. However, it is equally important to recognize which segments have undergone duplication events, and which segments were lost since the divergence of the species. By accounting for duplication and loss events, we ensure that we are comparing orthologous segments.
We decided to use genes as discrete genomic anchors in order to align and compare the species. We constructed a bipartite graph connecting annotated protein-coding genes in S. cerevisiae to predicted protein-protein-coding genes in each of the other
species based on sequence similarity at the amino-acid level. This bipartite graph should contain the orthologous matches but also contains spurious matches due to shared domains between proteins of similar functions, and gene duplication events that precede the divergence of the species. Determining which matches represent true orthologs and
resolving the correspondence of genes across the four species will be the topic of this chapter.
We present an algorithm for comparative annotation that has a number of
attractive features. It uses a simple and intuitive graph theoretic framework that makes it easy to incorporate additional heuristics or knowledge about the genes at hand. It
represents matches between sets of genes instead of only one-to-one matches, thus dealing with duplication and loss events in a very straightforward way. It uses the
chromosomal positions of the compared genes to detect stretches of conserved gene order and uses these to resolve additional orthologous matches. It accounts for all genes compared, resolving unambiguous matches instead of simply best matches, thus ensuring that all I-to-I genes are true orthologs. It works at a wide range of evolutionary
1.2. Establishing gene correspondence
Previously described algorithms for comparing gene sets have been widely used for various purposes, but they are not applicable to the problem at hand.
Best Bidirectional Hits (BBH) 3 0,3 looks for gene pairs that are best matches of each other and marks them as orthologs. In the case of a recent gene duplication however, only one of the duplicated genes will be marked as the ortholog without signaling the presence of additional homologs. Thus, no guarantees are given that 1-to-I matches will represent orthologous relations and incorrect matches may be established.
Clusters of Orthologous Genes (COG) goes a step further and matches groups of genes to groups of genes. Unfortunately, the grouping is too coarse, and clusters of orthologous genes typically correspond to gene families that may have expanded before the divergence of the species compared. This inability to distinguish recent duplication events from more ancient duplication events makes it inapplicable in this case, since the genome of S. cerevisiae contains hundreds of gene pairs that were anciently duplicated before the divergence of the species at hand . COGs would not distinguish between the two copies of anciently duplicated genes, and many orthologous matches would not be detected (Koonin, personal communication).
We introduce the concept of a Best Unambiguous Subset (BUS), namely a group of genes such that all best matches of any gene within the set are contained within the set, and no best match of a gene outside the set is contained within the set. A BUS builds on both BBHs and COGs to resolve the correspondence of genes across the species. The algorithm, at its core, represents the best match of every gene as a set of genes instead of a single best hit, which makes it more robust to slight differences in sequence similarity. A BUS can be isolated from the remainder of the bipartite gene correspondence graph while preserving all potentially orthologous matches. BUS also allows a recursive application grouping the genes into progressively smaller subsets and retaining
ambiguities until later in the pipeline when more information becomes available. Such information includes the conserved gene order (synteny) between consecutive
1.3.
Overview of the algorithm
We formulated the problem of genome-wide gene correspondence in a
graph-theoretic framework. We represented the similarities between the genes as a bipartite
graph connecting genes between two species. We weighted every edge connecting two
genes by the amino acid sequence similarity between the two genes, and the overall
length of the match.
We separated this graph into progressively smaller subgraphs until the only
remaining matches connected true orthologs (Figure 1.1). To achieve this separation, we
eliminated edges that are sub-optimal in a series of steps. As a pre-processing step, we
eliminated all edges that are less than 80% of the maximum-weight edge both in amino
acid identity and in length. Based on the unambiguous matches that resulted from this
step, we built blocks of conserved gene order (synteny) when neighboring genes in one
species had one-to-one matches to neighboring genes in the other species; we used these
blocks of conserved synteny to resolve additional ambiguities by preferentially keeping
matches within synteny blocks. We finally searched for subsets of genes that are locally
optimal, such that all best matches of genes within the group are contained within the
group, and no genes outside the group have matches within the group. These best
unambiguous subsets (BUS) ensure that the bipartite graph is maximally separable, while
maintaining all possibly orthologous
relationships.
When no further separation was
possible, we returned the connected
components of the final graph. These
contain the one-to-one orthologous pairs
resolved as well as sets of genes whose
correspondence remained ambiguous in
a small number of homology groups.
Figure 1.1. Overview of graph separation.
A1 B 2 C 3 A 1 B 2 C 3 A 1 B 2 C 3 A2 B 2 C 3
We construct a bipartite graph based on the blast hits. We consider both forward and reverse matches for near-optimality based on synteny and sequence similarity. Sub-optimal matches are progressively eliminated simplifying the graph. We return the connected components of the undirected simplified graph.
1.4. Automatic annotation and graph construction
In this section, we describe the construction of the weighted bipartite graph G,
representing the gene correspondence across the species compared. We started with the
genomic sequence of the species and the annotation of S. cerevisiae, namely the start and
stop coordinates of genes. We then predicted protein-coding genes for each newly
sequenced genome. Finally we connected across each pair of species the genes that
shared amino-acid sequence similarity.
The input to the algorithm is based on the complete genome for each species
compared.
For S. cerevisiae, we used the public sequence available from the
Saccharomyces Genome Database (SGD) at genome-www.stanford.edu/Saccharomyces.
SGD
posts
sixteen
uninterrupted
sequences, one for each chromosome.
S. cerevisiae
S.
bayanus
The sequence was obtained by an
0
tholog
international sequencing consortium and
published in 1996. It was completed by
a clone-based sequencing approach and
directed sequence finishing to close all
gaps.
Subsequent to the publication,
updates to the original sequence have
been incorporated in SGD based on
resequencing of regions studied in labs
around the world.
lss
The genome sequence of S.
paradoxus, S. mikatae and S. bayanus
was obtained at the MIT/Whitehead
Institute Center for Genome Research.
We used a whole-genome shotgun
sequencing approach with paired-end
sequence reads of 4kb plasmid clones, Figure 1.2. Bipartite Graph Construction. with lab protocols as described at www- Annotated ORFs (vertical block arrows) are genome.wi.mit.edu. We used ~7-fold connected based on sequence similarity.
redundant coverage, namely every nucleotide in the genome was contained on average in
at least 7 different reads.
The information was then assembled with the Arachne
computer program35,36 into a draft sequence for each genome. The assembly contains
contigs, namely continuous blocks of uninterrupted sequence, and scaffolds or
supercontigs, namely uninterrupted blocks of linked contigs for which the relative order
and orientation is known. This order and orientation is given by the pairing of reads that
originated from the ends of the same 4kb clone. The draft genome sequence of each
species has long-range continuity (more than half of the nucleotides are in scaffolds of
length 230-500 kb, as compared to 942 kb for the finished sequence of S. cerevisiae),
relatively short sequence gaps (0.6-0.8 kb, which is small compared to a typical gene),
and contains the vast majority of the genome (-95%).
Once the genome sequences are available, we determine the set of protein-coding
genes for each species. For S. cerevisiae, we used the public gene catalogue at SGD. It
was constructed by including all predicted protein coding genes of at least 100 AA that
do not overlap longer genes by more than 50% of their length. It was subsequently
updated to include additional short genes supported by experimental evidence and to
reflect changes in the underlying sequence when resequencing revealed errors. For the
three newly sequenced species, we predicted all uninterrupted genes starting with a
methionine (start codon ATG) and containing at least 50 amino acids.
We then constructed the bipartite graph connecting all predicted protein coding
genes that share amino acid sequence similarities across any two species (Figure 1.2).
For this purpose, we first used protein BLAST
37to find all protein hits between the two
protein sets (we used WU-BLAST BlastP with parameters W=4 for the hit size in amino
acids, hitdist=60 for the distance between two hits and E=10-
9for the significance of the
matches reported). Since the similarity between query protein x in one genome and
subject protein y in another genome is sometimes split in multiple blast hits, we grouped
all blast hits between x and y into a single match, weighted by the average amino acid
percent identity across all hits between x and y and by the total protein length aligned in
blast hits. These matches form the edges of the bipartite graph G, described in the
following section.
1.5. Initial pruning of sub-optimal matches
Let G be a weighted bipartite graph describing the similarities between two sets of genes X and Y in the two species compared (Figure 1.1, top left panel). Every edge e=(x,y) in E that connects nodes x e X and y e Y was weighted by the total number of amino acid similarities in BLAST hits between genes x and y. When multiple BLAST hits connected x to y, we summed the non-overlapping portions of these hits to obtain the total weight of the corresponding edge. We constructed graph M as the directed version of G by replacing every undirected edge e=(x,y) by two directed edges (x,y) and (y,x) with the same weight as e in the undirected graph (Figure 1.1, top right panel). This allowed us to rank edges incident from a node, and construct subsets of M that contain only the top matches out of every node.
This step drastically reduced the overall graph connectivity by simply eliminating all out-edges that are not near optimal for the node they are incident from. We defined M80 as the subset of M containing for every node only the outgoing edges that are at least 80% of the best outgoing edge (any not in the upper 20% of all scores). This was mainly a preprocessing step that eliminated matches that were clearly non-optimal. Virtually all matches eliminated at this stage were due to protein domain similarity between distantly related proteins of the same super-family or proteins of similar function but whose separation well-precedes the divergence of the species. Selecting a match threshold relative to the best edge ensured that the algorithm performs at a range of evolutionary distances. After each stage, we separated the resulting subgraph into connected components of the undirected graph (Figure 1.1, bottom right panel).
1.6. Blocks of conserved synteny
The initial pruning step created numerous two-cycle subgraphs (unambiguous one-to-one matches) between proteins that do not have closely related paralogs. We used these to construct blocks of conserved synteny based on the physical distance between consecutive matched genes, and preferentially kept edges that connect additional genes within the block of conserved gene order (Figure 1.3). Edges connecting these genes to genes outside the blocks were then ignored, as unlikely to represent orthologous