HAL Id: tel-01486533
https://tel.archives-ouvertes.fr/tel-01486533
Submitted on 10 Mar 2017HAL is a multi-disciplinary open access
archive for the deposit and dissemination of sci-entific research documents, whether they are pub-lished or not. The documents may come from teaching and research institutions in France or abroad, or from public or private research centers.
L’archive ouverte pluridisciplinaire HAL, est destinée au dépôt et à la diffusion de documents scientifiques de niveau recherche, publiés ou non, émanant des établissements d’enseignement et de recherche français ou étrangers, des laboratoires publics ou privés.
Towards ecologically consistent remote sensing mapping
of tree communities in French Guiana
Emil Alexander Cherrington
To cite this version:
Emil Alexander Cherrington. Towards ecologically consistent remote sensing mapping of tree com-munities in French Guiana: Are forest types identifiable from spatio-temporal canopy reflectance pat-terns?. Biodiversity and Ecology. AgroParisTech-ENGREF; Technische Universität Dresden, 2016. English. �NNT : 2016AGPT0065�. �tel-01486533�
AgroParisTech - IRD Unite Mixte de Recherce AMAP
TA A-51 / PS1 Bd de la Lironde, 34398 Montpellier cedex 5, FRANCE N°: 2016 AGPT 0065
présentée et soutenue publiquement par
Emil CHERRINGTON
le 14 Décembre 2016
Towards ecologically consistent remote sensing mapping of tree
communities in French Guiana: Are forest types identifiable from
spatio-temporal canopy reflectance patterns?
Doctorat AgroParisTech
T H È S E
pour obtenir le grade de docteur délivré par
L’Institut des Sciences et Industries
du Vivant et de l’Environnement
(AgroParisTech)
Spécialité : Écosystèmes et Sciences Agronomiques
Directeur de thèse : Raphaël PÉLISSIER Co-directeur de thèse : Uta BERGER
Jury
M. Jean-Philippe GASTELLU ETCHEGORRY, Professeur des Universités, Université de Toulouse Présidentde jury M. Steve SCHILL, Professeur adjoint, Brigham Young University Rapporteur
M. Bernard RIERA, Chargé de recherche, CNRS Examinateur
M. Grégoire VINCENT, Chargé de recherche, IRD Examinateur
M. Karl-Heinz FEGER, Professeur des Universités, Technische Universität Dresden Examinateur Mme Uta BERGER, Professeur des Universités, Technische Universität Dresden Co-directeur
Faculty of Environmental Sciences Department of Forest Sciences
Institute of Forest Growth and Forest Computer Sciences, Chair of Forest Biometrics and Systems Analysis
TOWARDS ECOLOGICALLY CONSISTENT REMOTE SENSING
MAPPING OF TREE COMMUNITIES IN FRENCH GUIANA: ARE
FOREST TYPES IDENTIFIABLE FROM SPATIO-TEMPORAL CANOPY
REFLECTANCE PATTERNS?
Emil CHERRINGTON
Born on: 10.12.1980
DISSERTATION
to achieve the academic degree
DOCTOR RERUM SILVATCARUM (DR. RER. SILV.)
Supervisors
Dr. Raphaël PÉLISSIER, Institut de recherche pour le développement
Prof. Dr. Uta BERGER, Technische Universität Dresden
Referees
Prof. Dr. Jean-Philippe GASTELLU ETCHEGORRY, Université de
Toulouse
Dr. Steve SCHILL, Brigham Young University
Submitted on: 17 October 2016
DECLARATION OF CONFORMITY
I hereby certify that this copy is identical with the original dissertation titled:
Towards ecologically consistent remote sensing mapping of tree communities in
French Guiana: Are forest types identifiable from spatio-temporal canopy reflectance
patterns?
Montpellier, 15 October 2016
1
Dedication
To the people of my native Belize, and to the people of Panamá, les États
Unis, French Guiana, France, and Germany… Thank you.
The declaration “Liberté, égalité, fraternité!” of 1789 has and continues to
inspire a world still thirsting for liberty, equality, fraternity, and peace…
To my wife Betzy, my late father Glenn, my mother Emelia, my
grandmother Rita, Aunt Carolyn, and Aunt Katherine, for whose
unconditional support I will always be indebted…
In honour of Saint Jude, the Roman Catholic patron saint of pilgrims in
need and in search of deeper meanings…
And to all of our ancestors before us for the sacrifices they made and the
debts they paid, and to our descendants to follow… Namaste!
2
Acknowledgements
This thesis is the result of the contributions of a large number of collaborators and institutions. Sincere thanks go to my supervisor, Dr. Raphaël Pélissier, without whose support, guidance, mentorship, and patience this research would not have been possible. I also owe a debt of gratitude to my co-supervisor, Prof. Uta Berger whose unwavering faith in this project, guidance, and patience are greatly appreciated. Thanks are also due to Dr. Grégoire Vincent and Dr. Daniel Sabatier who provided direction in terms of research gaps in French Guiana; it was your passion for French Guiana that made it possible for me to do research on a country I was unfamiliar with. To Dr. Nicolas Barbier I owe a great deal of thanks for sharing your expertise, and for nudging me against my will into the world of coding. To Dr. Christophe Proisy, I am also appreciative of your expertise and the introduction to the world of radiative transfer modelling. To Prof. Jean-Philippe Gastellu Etchegorry, I owe a great deal of thanks for all of the support provided in implementing DART and for agreeing to review this manuscript. To Dr. Jean-Baptiste Feret, I also appreciate all of the brainstorming discussions we had. To Dr. Stéphane Guitet and Dr. Valéry Gond, thank you for all of the feedback and providing access to your data. Thanks are also due to Dr. Steve Schill for agreeing to review my manuscript, and to Dr. Bernard Riera and Prof. Karl-Heinz Feger for agreeing to participate on the jury of the defence of this doctoral thesis. I would also like to thank Prof. Raphaël Manlay, Dr. Frédérique Seyler, and Prof. Karl-Heinz Feger for participating on my PhD supervisory committee, and to acknowledge all of the support provided over the past three years by Valérie Roinel, Noemie Cauquil, Murielle Salas, Frau Sabine Schenk, and Dr. Pierre-Yves Vion. A great deal of thanks are also owed to Julien Heurtebize for all of the support provided in my use of AMAPvox. The support of IRD / AMAP, CIRAD, AgroParisTech, and the Forest Biometry and Forest Systems Analysis lab of the Technische Universität Dresden is greatly appreciated, as well as the financial support provided by the European Commission’s Erasmus Mundus programme, via the Forest & Nature for Society (FONASO) consortium, which was led by the University of Copenhagen (Specific Grant Agreement 2013-1462/001-001-EMIIE-MJD). The support of UCPH Prof. Carsten Smith-Hall is also appreciated. This research was also partly supported by the DynForDiv project (2014–2017), funded by the BGF program of France’s Ministère de l’Écologie, du Développement durable et de l’Énergie (MEDDE).
This research also builds on the skills gained during an almost decade-long sejour with the Centro del Agua del Trópico Húmedo de América Latina y el Caribe (CATHALAC) in Panama, while working on the USAID- and NASA-supported SERVIR-Mesoamerica project. Enormous thanks go to CATHALAC’s former Director, Emilio Sempris, and to NASA’s Dan Irwin, both of whose mentorship during the SERVIR years paved the way for my eventual return to the university. Thanks are also due to Dr. Freddy Picado, Prof. Matias Carrera, Alexis Vega, Francisco Delgado, Eric Anderson, Africa Flores, Eloisa Dutari, Miroslava Moran, Alejandro del Castillo, Marcelo Oyuela, and other CATHALAC colleagues too numerous to mention here. Stu Frye and Pat Cappelaere of the NASA EO-1 team also deserve a great deal of thanks for all of the Hyperion hyperspectral data tasked for this study.
I would likewise like to acknowledge my undergraduate university mentors Prof. Bernadette Roche and Prof. Thomas Ward of Loyola University Maryland, and my graduate advisor at the University of Washington’s College of Forest Resources, Prof. Clare Ryan. To Prof. Phil Hurvitz, I owe a great deal for the introduction to GIS, without which so many doors would have been closed. I must also acknowledge Prof. Rob Griffin, Prof. Tom Sever, Dr. Ashutosh Limaye, Ray French, Dr. Nancy Searby, Woody Turner, Dr. Mike Freilich, Jan Meerman, Marydelene Vasquez, Jeanne Link, and Prof. Elma Kay. Many, many thanks are also due to the countless inspiring teachers and professors I had during my studies at St. Joseph’s Primary School, St. John’s College, Loyola University, and the UW. You all lit the flame. I also acknowledge both the Organization of American States (OAS) and Belize’s Protected Areas Conservation Trust (PACT) for supporting my earlier studies.
3
On a personal note, I would like to acknowledge the friends and colleagues without whose friendship and encouragement this research would ultimately not have been possible. To my AMAP fellow PhD students, thank you for the lunch-time discussions et de me permettre d'améliorer mon français: Mathieu Milan, Marco Escalante, Raphaël Perez, Sourabh Pargal, Rinny Rahmania, Awaz Mohamed, Diane Bouchet, Yan Wang, Charléne Arnaud, Ruksan Bose, Francisca Perreira, Jerome Nespoulous, Lorenzo Rossi, Junior Perez-Molina, Jimmy Le Bec, Vincent Bazile, Romain Lehnebach, Valaire Yatat, Alexis Tamen, Moses Libalah, Adewole Olagoke, and Pierre Ploton. To Adewole – thank you for the hospitality during the time spent in Dresden. To Raphaël and Pierre, I especially owe thanks for, respectively, pestering me to learn R, and for helping me to finally dive into R (better late than never). To Kirkland, Sherwin, Ryan, and Dr. Cedric – thank you. Big up to Lowell, Luke, Darwin, Andres, Aaron, and Armando (RIP). To Derek, Dave, Andrew, Ephraim, Liz, Shawki and Ismoil – thank you. Thanks also to my friends from my FIUTS days at the UW, including Anita, Carolyn, Lori, Charlotte, Sabrina, KT, Dewi, Nancy, Koko, OP, Michelle, Diana, Adi, Hula, Aimi, I Nong, Kara, Yutaka, Craig, and others.
To my family I owe a great deal of gratitude. To my late father Glenn, I give thanks for your unconditional support of your only child, regardless of how unsupportable I could be. I hope that this work honours your memory and I regret not being able to share this with you. May you continue to rest in peace. To my mother Emelia, I thank you for all you have done for me over the years, including believing in me and fostering in me an insatiable thirst for knowledge. To my grandmother Rita, I thank you for all of the sacrifices you and Granddad made for us all, and for the faith you always had in me. To my Aunt Carolyn, please know that you and Dr. Mahung always inspired me to follow in your footsteps, and your patronage over the years comes to fruition in this thesis. There is no way that I can ever thank you. To my Aunt Katherine, you have been a second mother to me, and your faith in my capacity has sustained me through difficult periods. And to my uncles Karl, David, Bobby, Stan, and Santos – you likewise inspired in a young man a love for science. To my cousins Karl, Ishmael, Jordana, Natasha, Matthew, Santana, Anya, Giselle, Signa, Madiba, and the future Dr. Karl Leacock and Dr. Cressida Mahung, I love you all. A la familia Hernandez Sandoval, muchas gracias por todo, incluso sus oraciones. Lastly, to my wife I owe the greatest debt of gratitude. You have been with me through the thick and thin, through some of the most challenging moments, and through my proudest ones. Have no doubt that the sacrifices made have been for the benefit of our family. Thank you for your unconditional support, love, and the many almost sleepless nights which helped bring this thesis to reality.
4 TABLE OF CONTENTS Dedication 1 Acknowledgements 2 List of Figures 6 List of Tables 8 General Introduction 9 I. Context 9
II. Study Objectives 16
III. Geographic scope and available data 17
IV. PhD thesis structure 18
Methods 20
I. Overview 20
II. Evaluating the spatial patterns of variation of forest type distribution 20 Bi-directional effects and estimates of spatial variation of forest types 20 Effects of seasonality on mapping the spatial variation of forest types 27 III. Evaluating the temporal patterns of variation of tropical forests 29 Assessing seasonal variation of vegetation indices at the regional level 29 Assessing seasonal variation of vegetation indices at the plot level 31 Assessing seasonal variation of vegetation indices by forest type 37 IV. Examining patterns of spatio-temporal variation for forest type mapping 40
Chapter 1: Spatial variation of forests in French Guiana 43
Overview of the chapter 45
Introduction 45
Results 48
Discussion 57
Chapter 2: Temporal variation of forests in French Guiana 64
Overview of the chapter 64
Introduction 64
Results 66
Discussion 79
5 Introduction 89 Results 91 Discussion 95 General discussion 98 I. Summary of findings 98
II. Contextualizing the findings 99
III. Study implications 102
IV. Limitations 104
V. Perspectives on future research 105
VI. Overall scientific contribution 107
References 109
Résumé étendu 122
Abstract 137
6
List of Figures Fig.
no.
Figure name Page
1 Mean MODIS (MCD43A4)-derived reflectance imagery of French Guiana for the month of September and the location of French Guiana in South America
18
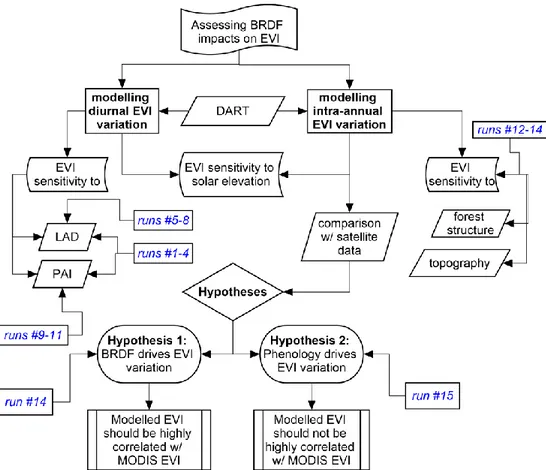
2 Links between the thesis’ main chapters 18
3 Landsat tiles covering French Guiana and Landsat sensor scan angles 21
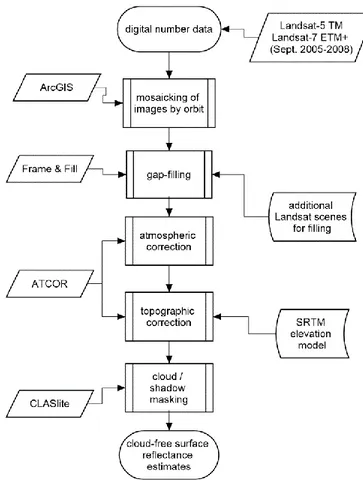
4 Work flow of Landsat data processing for BRDF assessment 23
5 Workflow for mapping of French Guiana’s forest types using Landsat data 25
6 Sensor scan angles for the Landsat images used, for the MODIS Terra data, and for the MODIS Aqua data
27
7 Percent missing data for French Guiana in the monthly mean archive of MODIS MCD43A4 reflectance data.
28
8 Location of the study areas for regional-level assessment of VI variation 30
9 Location of the three 1-ha plots across French Guiana, overlain on mean MODIS (MCD43A4)-derived reflectance imagery for September and simulated false colour imagery (MODIS band combination 1-2-3) of plot canopies generated from aerial-LiDAR data and radiative transfer modelling
32
10 Overall modelling and analysis strategy 37
11 MCD43B4-derived September reflectance for French Guiana (12-year average), and location of 4 study sites
40
12 Work flow for the generation of forest type maps from VI time series and for analysing the correlation between EVI spatial patterns and environmental gradients
41
13 Environmental gradients extracted for French Guiana 43
14 Effects of Landsat sensor viewing angles 46
15 Land cover classifications of French Guiana 47
16 Landsat path 227 reflectance versus the sensor scan angle 49
17 MODIS reflectance versus the sensor scan 50
18 Landsat-MODIS reflectance bias versus the sensor scan angles 50
19 Landsat-MODIS reflectance bias for Landsat path 227 data from September 2005, compared to mean MCD43A4 reflectance for September
51
20 Landsat-derived surface reflectance estimates 52
21 MODIS surface reflectance estimates for 27 September 2005 53
22 Separability of forest classes for Landsat reflectance data not corrected for BRDF, and Landsat reflectance data corrected for BRDF, based on the Jeffries-Matusita distance
54
23 Maps of forest types, based on mean reflectance from August and September 55
24 Monthly separability of forest classes, at different spectral resolutions 56
25 Number of spectrally distinct forest classes detected, estimate of spectral noise, EVI
56
7
27 Average monthly variation (2002-2014) in solar elevation, incident shortwave solar radiation, precipitation, temperature, and the vegetation indices
68
28 Correlations among the explanatory variables 68
29 Daily variation in EVI from radiative transfer modelling at Paracou for 15 September and 15 December
71
30 Modelled daily variation in EVI at Paracou for 15 September, under varying Leaf Angle Distributions (LAD), Plant Area Index, PAI and LAD
73
31 Monthly variation in solar elevation at solar noon and modelled variation in EVI at the three study sites (based on a spherical LAD)
74
32 Compared monthly variation in EVI observed at Paracou, (MODIS) and DART-modelled
75
33 Correlations among observed EVI, solar variation-modelled EVI, solar variation and PAI variation-modelled EVI, solar elevation, aerosol optical depth, and leaf area index, for the Paracou plot
76
34 Mean monthly variation in the different VIs, at the scale of French Guiana 77
35 Monthly variation in FCOVER at the scale of French Guiana 77
36 Mean monthly MODIS-derived LAI variation at the 4 sites in French Guiana 78
37 Monthly variation in MODIS-derived LAI at the Kaw site 79
38 Patterns of spatial variation in the mean annual estimates of selected vegetation indices and variables, extracted for French Guiana
91
39 Monthly variation in the extracted seasonal pattern of EVI, derived from the January 2003 – December 2014 time series
92
40 Boxplot of monthly variation in EVI for all pixels, based on the extracted seasonal pattern
93
41 French Guiana forest types, based on spatio-temporal analysis of EVI time-series data
93
42 Boxplot of monthly variation in EVI for all pixels, based on the extracted seasonal pattern
94
43 Variance partitioning with respect to how the different environmental variables (divided between climatic ones and topographic ones) explain the spatial variation in EVI
8
List of Tables Table
no.
Table name Page
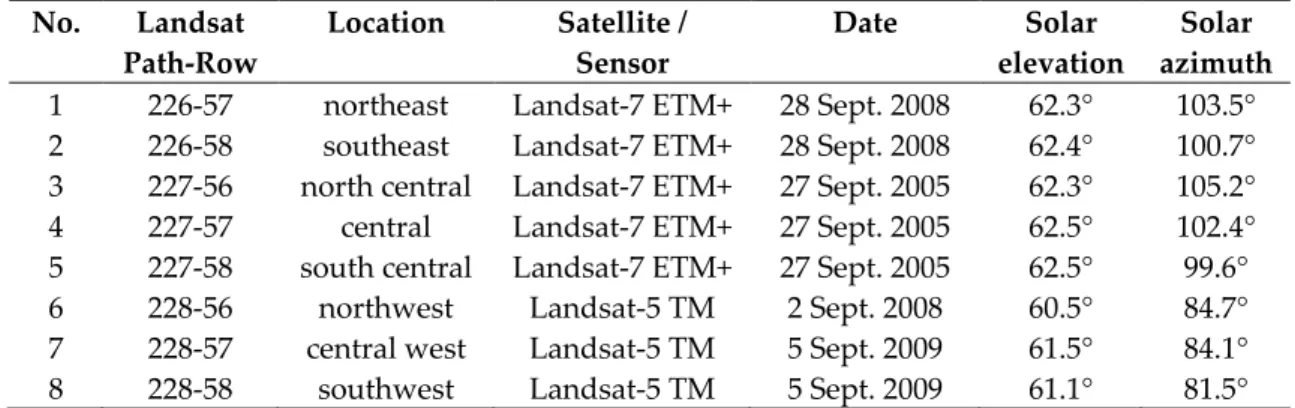
1 Landsat imagery used for the creation of an image mosaic of French Guiana 22
2 Classification system used in mapping French Guiana’s forest types 26
3 Factors used in regression and correlation analyses 31
4 Study site characteristics, with mean stand parameter of 1-ha plots as extracted from the aerial LiDAR data
33
5 Details of radiative transfer simulations run using DART 36
6 Vegetation indices used in this study 38
7 Environmental variables used in the OLS regression of spatial variation of the different vegetation indices
44
8 Landsat surface reflectance estimates at different scan angles, based on data acquired for orbits 227 and 228
49
9 Correlations among the enhanced vegetation index (EVI), the fraction of green vegetation cover index (FCOVER), and the leaf area index (LAI)
66
10 Summary of main regression models analysed 69
11 Supplementary regression models analysed 70
12 Regression models analysed using all variables, contrasted with the enhanced vegetation index (EVI), the fraction of green vegetation cover index (FCOVER), and the leaf area index (LAI)
71
13 DART-derived reflectance values and EVI for the Paracou plot, on 15 September and 15 December
72
14 DART-derived reflectance and EVI for the three study plots 74
9
General Introduction
I. Context
Tropical forests provide important ecosystem functions (e.g. primary production, carbon and nitrogen cycling, the hydrogen cycle, etc.) as well as ecosystem services (e.g. pharmaceuticals, timber, air and water purification, climate stabilization, etc.) (Tallis et al. 2013; Virginia and Wall 2013). Despite their important role in providing such functions and services, tropical forests and the species within them are increasingly being lost, due in part to increasing deforestation (Hansen et al. 2013). One recent study, for instance, places 36%-57% of Amazon tree species at risk of extinction (ter Steege et al. 2015). Where forests are communities of trees, i.e. inter-species associations (Chave 2009; Duckworth et al. 2000; Helmer et al. 2012)) and not merely random collections of individuals, there is therefore a need to understand the patterns of the diversity of tree communities in the tropics. Understanding the patterns of tree diversity is ultimately also necessary for adequate management and conservation of tropical forests, and such information can also aid in evaluating how forests will respond to future environmental perturbations.
Tropical tree community assembly rules
Toward an understanding of the diversity of tree communities in the tropics, distinctions are made between the processes by which tropical tree communities form (assemble) and the spatial patterns formed by the assembly of such communities (Gaston and Blackburn 2000).
Processes in tropical tree community assembly
In terms of understanding the processes regarding the assembly of tropical tree communities, as one author frames the issue, “understanding the causes of spatial variation in floristic composition is one of the overarching goals of plant ecology” (Chave 2008). The two main prevailing [and competing] theories have been that of the “niche theory” and the “neutral theory” (Chave 2009).
As summarized in two studies (Madeleine et al. 2007, Chave 2009), the theory of ecological niches (Hutchinson 1957) - also termed “habitat specialization” (Chave 2008) - posits that tree species possess innate preferences for abiotic conditions and resources which will lock them into particular ecological niches via specific adaptations that make them more competitive than others in a given environment. While the issue of competition for niches has been the hallmark of the theory, later studies (e.g. Grubb 1977) have suggested “niche differentiation” as an evolutionary force counteracting the early Gause’s principle of competitive exclusion (Gause 1934). This suggests, for example, that the large number of species in the tropics is evidence of the sharing of resources both in space and in time, limiting competition between species (Schoener 1974, Madeleine et al. 2007, Pélissier 2010). Additionally, intrinsically linked to the concept of ecological niches is the concept that plants’ life history strategies will place them into certain [species-independent] “functional groups,” such as, but not limited to the following (Grime 1974; Swaine and Whitmore 1988; Oldeman and van Dijk 1991):
10 Pioneers Light-demanding species Gap specialists Shade-tolerant species Non-pioneers
The “neutral theory” (Hubbell 1979; Hubbell 2001) stands in contrast to the niche theory in emphasizing that “all individuals in all species have the same prospects of reproduction and death, irrespective of the environment they grow in” (Chave 2008). Unlike the niche theory, the neutral theory is based on random (stochastic) processes and is thus not seen as deterministic, and suggests that “demographic processes may cause a rare species to be present in a community by chance rather than because it is a superior competitor” (Chave 2009). With the neutral theory, compositions of tree communities thus have more to do with stochastic processes like occasional long distance dispersal events than they do with deterministic species-habitat preferences.
Further, both competing theories have implications for observing spatial patterns of diversity of tropical forests. For instance, based on the niche theory, composition of tree communities should be more or less predictable based on the environmental factors which determine the niches. And in contrast, based on the neutral theory, composition of tree communities will depend on a range of stochastic factors such as demography, dispersal, migration, among others. Likewise, there is also evidence for the operation of both deterministic and stochastic processes in the assemblage of ecological communities. Within French Guiana in the Guiana Shield, for instance, various studies have suggested niche preferences of tropical species (Molino and Sabatier 2001, Pélissier et al. 2002, Madeleine et al. 2007). Further on the topic of French Guiana, a recent study (Guitet et al. 2015; Guitet et al. 2016) found that that beta diversity could be predicted by geomorphology, suggesting that tree community dynamics “co-evolved” over the long term along with the processes of landforms formation driven by tectonic, climatic and marine events. These results provide additional evidence for an enlarged vision of the niche theory as geomorphological landscapes may reflect imprints of past environmental filters and historical biogeographical processes that contributed to shape the actual differences in forest composition.
Those studies contrast with a limited number of other studies (Condit et al. 2002; Maaß et al. 2014) which suggest that beta diversity in the tropics are more driven by ‘neutral’ processes than by habitat specialization. In the former study, for instance, data from both Amazonia and Panama showed that the similarity between forest plots declined with distance between the plots, suggesting that the composition of the plots was heavily influenced by dispersal patterns (Condit et al. 2002). However, that same study likewise provided evidence that both dispersal and habitat specialization influenced species turnover, suggesting that aspects of both niche theory and neutral theory are at play. In terms of explaining the spatial patterns of diversity in tree communities, this suggests that one does not necessarily need to choose between niche theory and neutrality theory, as the composition of tropical forests likely reflects both niche assembly and dispersal assembly rules.
Patterns in tropical tree community assembly
While there is considerable debate among proponents of either theory (Leigh 2007, Chave 2009, Rosindell et al. 2012, May et al. 2015), such theories concern the processes from which the
11
patterns of spatial variation result (Chave 2008). Characterizing such patterns is ultimately the
area into which this PhD thesis will delve, with the ambition that the detected patterns could as far as possible reflect the underlying ecological processes. That said, it bears noting that traditionally, ecological knowledge has been derived from punctual studies of the individuals comprising communities (Tucker et al. 2005, Losos and Leigh 2004, Chave 2008, Levin 2009, Pélissier 2009, ter Steege et al. 2013). Although, as pointed out in one review (Cord et al. 2013), the main advantage of field studies is that the data are highly accurate, the disadvantage is that punctual studies do not cover great spatial extents. Thus, while there are multiple networks for monitoring forest dynamics worldwide, the Center for Tropical Forest Studies (CFTS)’ network, for instance, only covers 11.22 km2 of approximately 16.2 million km2 of total
forest area (FAO 2010; Anderson-Teixeira et al. 2015). That thus only covers 0.00007% of the total area of tropical forests. It is therefore unlikely, even summing the plots from other networks, that the current plot network is sufficiently representative. While that may not represent a gap in research per se, it does represent a gap in data as concerns tropical forests. Remote sensing offers opportunities to address such data gaps and gain a broader perspective on tropical forest ecology. For instance, remote sensing allows for the quantification, at global and finer scales, of changes in forest area (e.g. Hansen et al. 2013) which in turn allows for assessments of changes in the ecosystem functions and services offered by forests (e.g. Chambers et al. 2007).
Remote sensing of tropical forests
Remote sensing pertains to the acquisition of information about objects without being in direct contact with them. While remote sensing of the environment dates to the use of aerial photographs to map vegetation since the 1920s (Jensen 2006; Morgan et al. 2010), since the early 1970s, remote sensing changed with the introduction of sensors mounted on Earth observing satellites (Aplin 2004, Jensen 2006, Lillesand et al. 2007). In essence, what spaceborne sensors have allowed is for synoptic observation of entire landscapes, a feat not feasible with field measurement (Turner et al. 2003). Ideally, remote sensing permits for the upscaling of field observations. One study of the Amazon (Tuomisto 1998), for instance, explored how field measurements could be used in combination with landscape-level satellite data to understand the spatial patterns of tree diversity. Although they possess spatial scale dependencies, the spatial patterns evident in remotely sensed images – particularly imagery of the near-infrared and short-wave infrared parts of the electromagnetic spectrum – correlate with patterns of spatial variation of forests which can be measured in the field (Tuomisto 1998; Jensen 2006; Lillesand et al. 2007; Muro et al. 2016).
Remote sensing and functional traits
In terms of interpreting those spatial patterns and understanding what can be measured at large spatial scales using remote sensing, it is worth pointing out that, to date, spaceborne sensors allow for the estimation of a variety of parameters of the vegetation (Ustin and Gamon 2010), ranging from (i) forest structure (Johansen and Phinn 2006) to (ii) canopy biochemistry (Baldeck and Asner 2013) to (iii) canopy physiology (McDonald et al. 1994) to (iv) phenological variation (Viennois et al. 2013). Of the parameters proposed, Ustin and Gamon 2010 propose using static data on structure, biochemistry, and physiology (mainly to characterize spatial variation), while using the phenology data to assess temporal variation. Additionally, each of
12
the traits (structure, biochemistry, physiology, and phenology) also correspond to the different ways with which to observe trees or communities (depending on the scale) with remote sensing.
Organizational levels and remote sensing
On the one hand, at least since the advent of ‘very high spatial resolution’ (VHSR) remote sensing data with the launch of the commercial Ikonos satellite in 1999, a great deal of effort in remote sensing has been dedicated to the identification of individual tree species based on their canopy-level spectral response patterns (Clark et al. 2004, Lillesand et al. 2007). This essentially followed approaches pioneered much earlier (i.e. in the earlier part of the 20th
Century) using [high spatial resolution] aerial photography which likewise allowed for the identification of tree species, mainly based on the textural information contained within such photographs (Morgan et al. 2010). But besides mapping individual trees, as indicated earlier, there are other ways that remote sensing can be used to examine the spatial variation of forests (tropical and otherwise).
Beyond the identification of individual trees, ecological remote sensing has also seen advances in terms of identifying associations of individuals, i.e. tree communities (Helmer et al. 2012), as well as the identification of functional groupings (Ustin and Gamon 2010; Huesca et al. 2015). Regarding the former concept (communities), one study (Helmer et al. 2012) showed, in the tropical forest setting of the island republic of Trinidad and Tobago, that it was possible to identify tree associations based on canopy spectral characteristics identified in both wet and dry season imagery. Nevertheless, such a concept has not been widely implemented outside of the one study, and it may just be that there are scale dependencies to identifying communities using remote sensing. That is to say following on arguments posited in Couteron et al. (2012), the spatial resolution of the input remote sensing data may limit the ability to identify tree communities if the number of individuals per unit area is high. And generally, in tropical forests, the number of individuals per unit area may indeed be high, with estimates ranging from 100 to over 200 tree species per hectare in tropical rainforests (Phillips et al. 1994, Turner 2001, Turner 2004).
Contrasting concepts of functional groups
Regarding the concept of functional groupings, a recent review paper (Ustin and Gamon 2010) suggests that it should be possible to identify plant functional types (PFTs) based on the combination of forest structure, canopy biochemistry and physiology, and phenology. Whereas it was previously mentioned that in niche theory, plant life history strategies will put individuals into broad groups like “pioneers” and “shade tolerant species” among others, the remote sensing-based plant functional type concept (Ustin and Gamon 2010) uses a concept of “functional traits”, which requires clarification as it is distinct from the classical notion of functional types in ecological theory. One comprehensive review of ecological theory on such defines functional traits as “morpho-physio-phenological traits which impact fitness indirectly via their effects on growth, reproduction and survival, the three components of individual performance” (Violle et al. 2007).
13
The review study (Violle et al. 2007) indicates that functional traits are particular to individuals (and must be measured at the individual level), but in considering higher organizational levels (e.g. communities and ecosystems), scaling up can be done using integration functions (Violle et al. 2007). A contrast is made between individual level “functional traits” and “community or ecosystem properties” which are “feature[s] or process[es] measured at the community or ecosystem level” (Violle et al. 2007). “Functional traits” are indicated to refer specifically to any of the following (Violle et al. 2007):
(i) physiological processes such as photosynthesis or plant respiration, (ii) life history processes such as germination, growth or reproduction, (iii) individual fitness, or
(iv) performance measures.
The remote sensing-based concept of functional types were termed “optical types” by their proponents (Ustin and Gamon 2010), because they are based on what optical remotely sensed imagery perceives of forest canopies. These “optical types,” however do stand in some contrast to the aforementioned ecological concept in a few ways. For one, the ecological “functional trait” concept is indicated to focus on the individual level and may differ from the “optical types,” which may apply to individuals or to higher levels of organization (i.e. communities or ecosystems), although it is hypothesized that variations in canopy reflectance even at the community scale may represent variations in functional responses at the individual level. The two concepts (the ecological concept of functional traits and the remote sensing-based one) are therefore not diametrically opposed, even as they may not necessarily apply at the same scale. This does not, however, discount the potential utility of the ‘optical type’ approach to the remote sensing of tropical forests, as, to repeat, overall variations in canopy reflectance even at even the plot level may be indicative of variations in functional responses at the individual level.
It is important to note the novelty of the “optical type” approach over other more traditional methods in remote sensing. The “optical type” approach is novel in that it combines the use of proxies for canopy biochemistry and physiology, vegetation structure and phenology - i.e. high temporal frequency data (Ustin & Gamon 2010). In contrast, traditional methods only utilize canopy reflectance estimates from imagery acquired at a single point in time or reflectance estimates averaged over time (Jensen 2006; Lillesand et al. 2007; GOFC-GOLD 2009). In following up the “optical type” concept but utilizing only remotely sensed data on phenological variation, a recent study (Huesca et al. 2015) demonstrated the principal value of the concept in combining spatial and temporal information to address how plant communities change seasonally. That is to say, while other studies (Helmer et al. 2012) have suggested that it is possible to identify plant communities on the basis only of one time acquisition of canopy reflectance data, it is theorized that there are limitations to such approaches which can be overcome if temporal patterns as well as spatial ones are considered. In other words, and as elaborated in the following section, high frequency temporal data likely allows for observing patterns of variation of forests which obviously cannot be observed at only single points in time.
14
The use of temporal patterns to characterize the diversity of tropical rainforests, in fact, represents a research gap as well as a potential opportunity. Previous studies have indicated that the temporal patterns of forests observed by remote sensing pertain to seasonal phenological variation (Myneni et al. 1997, Tucker et al. 2005, Zhang et al. 2006). With regard to tropical forests, in terms of that seasonal phenological variation, it is understood that such variation is more pronounced in tropical deciduous forests than in tropical evergreen forests, i.e. tropical rainforests (Aerts 1995; Borchert et al. 2005; Bendix et al. 2006; Devi and Garkoti 2013). Nevertheless, even tropical evergreen forests such as those in French Guiana will experience seasonal phenological variation, exhibited through periodic changing of leaves (resulting in litterfall peaks), and the production of flowers (Sabatier and Puig 1985, Wagner et al. 2012). Studies of phenological variation likewise indicate that climate drives phenology, but the timing of phenological events is also linked to species-specific endogenous developmental rhythms (Kikuzawa 1995; Fenner 1998; Forrest and Miller-Rushing 2010; Méndez-Alonzo et al. 2013). In other words, phenological variation is not entirely determined by environmental variation but represents the interplay between external environmental controls and endogenous forces.
Where remote sensing allows for monitoring phenological variation, it is also important to consider what aspects of phenology can be thus observed since, as pointed out earlier, phenological variation can include flowering cycles as well as patterns of how leaves are shed or are replaced (Fenner 1998). In remote sensing, since the 1970s, computationally simple vegetation indices have been developed as ratios of the reflected light observed by satellite sensors (i.e. “spectral bands”) – mainly red and near-infrared reflected light (Tucker 1979, Lillesand et al. 2007). Field validation studies [in temperate zones] have shown that the intra-annual variation of the vegetation indices correlates principally with variation in leaf area caused by shedding (Myneni et al. 1997; Tucker et al. 2005). The correlation between seasonal variation in vegetation indices and leaf phenology has also been demonstrated in the tropics, although this has not been without some controversy (Lopes et al. 2016). The overarching message is that remote sensing data can be used to examine temporal patterns in the form of leafing phenology.
Separate from the use of [remotely sensed] temporal pattern data to monitor phenology at single sites is the concept of combining such temporal pattern data with spatial pattern data. The concept of using both spatial and temporal remote sensing data to examine forest types is not completely new, as it has been suggested in the “optical type” study (Ustin and Gamon 2010) and was implemented for Spain (Huesca et al. 2015). Still, in the context of tropical forests, only a few studies have explored such approaches. In one study of central Africa, for instance, forest types were clustered based on the temporal patterns of satellite-derived vegetation indices (Viennois et al. 2013). It was found that it was possible to develop a typology of forests in central Africa based on the combined spatio-temporal approach (Viennois et al. 2013).
Based on those previous limited applications (Viennois et al. 2013a; Huesca et al. 2015), there is therefore evidence to suggest that tropical forests in particular can be identified based on spatial and temporal patterns – at the scales of communities or ecosystems. It is theorized that a given assemblage of species will react distinctly to external environmental and endogenous drivers than a different assemblage of species. Linking that to the remote sensing, it would
15
then be theoretically possible to identify a given spatial pattern in terms of tropical tree species composition based on differential spatio-temporal patterns of phenological variation. It should also be emphasized that while such an approach is not completely novel since it has been implemented in temperate forests (Huesca et al. 2015), the spatio-temporal approach contrasts greatly with the current approach to characterizing (mapping) forests based only on spatial patterns of canopy reflectance obtained from single points in time, or from values averaged over periods of time. It should be expected that combining spatial patterns of canopy reflectance with how these patterns change seasonally across the year should theoretically yield a better characterization than just using data from a single date. Examining how a forest changes over time should likely yield more information on species composition than just examining a forest at a single point in time.
Limitations of remote sensing with regard to ecological applications
While it should therefore be possible to characterize the spatial variation of tropical forests (i.e. a goal in terms of understanding tropical forest diversity) using a combined spatial-temporal approach previously described, such an approach is not without obstacles to be overcome. Overcoming such obstacles will constitute a significant part of the research to be presented later in this thesis. Because [satellite] remote sensing involves observing vegetation from sensors located tens of thousands of kilometres in space, one consistent challenge has been atmospheric conditions which at times obscure the signal collected by optical satellite sensors (Jensen 2006; Lillesand et al. 2007). However, methods have been developed for correcting atmospheric effects in remotely sensed data (Vermote and Vermeulen 1999; Kotchenova and Vermote 2007; Claverie et al. 2015). In recent years, much more attention has been focused on obstacles to exploiting remotely sensed spatio-temporal data which are largely instrumental in nature (Morton et al. 2014; Soudani and François 2014; Nagol et al. 2015).
The most significant instrumental artefact described in recent years has been that of the bi-directional reflectance distribution function (BRDF), which essentially indicates that depending on the angles at which objects are viewed, they will reflect light differently (anisotropically). Such anisotropic reflectance of light is of particular interest for tropical forests because their diverse canopy architectures creates varying patterns of shading. And this also depends on the absolute elevation and azimuth of the sun, and the position of the sun relative to the viewing sensor (Roujean et al. 1992; Bicheron and Leroy 2000; Morton et al. 2014). As explored in one review study (Soudani and François 2014), forests will, in general, appear brighter (e.g. ‘greener’) when the sun is behind the viewing sensor and the forest is not being viewed in shade. However, if the position of the sun changes and the same forest is being viewed as it were in shade, the forest will appear less green (Soudani and François 2014). But not only will the apparent greenness of the forests change, their patterns of [satellite sensor observed] red and near-infrared reflectance will also change, because such radiation is not reflected isotropically (Soudani and François 2014). In that way, the same forest will appear different in estimated reflectance or in derived vegetation indices just on the basis of changing illumination patterns, independent of real changes in the vegetation.
There are ways of either accounting for or outright correcting for bi-directional effects (BRDF) in satellite-derived reflectance estimates. For instance, if a particular forest plot is being
16
observed with the same sensor view angle and under the same illumination conditions (i.e. same solar elevation and solar azimuth), it is possible to compare reflectance estimates without doing outright correction for bi-directional effects. However, imaging a forest under such conditions may be challenging for satellite sensors which generally have fixed overpass times (e.g. 10:30 am Equatorial crossing for the French SPOT-5 satellite), and the solar elevation and azimuth at a given time changes daily (Lillesand et al. 2007). But in addition to merely trying to account for BRDF, methods for outright correction of BRDF have been developed (Danaher et al. 2001; Schaaf et al. 2002; Hansen et al. 2008; Potapov et al. 2012; Flood 2013; Roy et al. 2016). Some of these correction methods generally make use of information on solar position to model reflectance based on stable solar parameters (Schaaf et al. 2002). Thus, where BRDF results in differential reflectance estimates across sensor scanning angles, BRDF corrections adjust reflectance estimates across scanning angles, effectively normalizing all views to nadir (Schaaf et al. 2002).
Returning to the topic of the use of remotely sensed spatio-temporal pattern data for monitoring seasonal changes in tropical forest, even with corrections for BRDF and methods of accounting for BRDF, there has been controversy in the application of remote sensing data. The controversy largely resolves around remotely sensed temporal data for the Amazon. In 2006 and 2007, two studies were published which made the following arguments: that tropical evergreen forests in the Amazon (i) regularly experience leaf flushing during the dry season, and (ii) experienced leaf flushing during the 2005 drought in that region (Huete et al. 2006; Saleska et al. 2007). Responses refuting the findings of both studies were forthcoming in 2010, 2012, and 2014 (Samanta et al. 2010; Samanta et al. 2012; Morton et al. 2014) and these posited instrumental and atmospheric artefacts as causing the appearance of leaf flushing.
The latter studies essentially drew into question the very feasibility of using remote sensing data to monitor tropical phenology. However, more in-depth analysis shows that the principal issue is that the earlier studies did not base their conclusions on BRDF-corrected data. Their findings were also supported by later field validation studies which have provided evidence that Amazonian forests do indeed experience dry season leaf flush (Lopes et al. 2016; Wu et al. 2016). All in all, the controversy regarding leaf flushing in the Amazon highlights the potential pitfalls to using remote sensing data for examining temporal variations of tropical forests. Likewise, they point to potential challenges applying spatio-temporal remotely sensed data for examining forest typology – as well as potential opportunities.
II. Study objectives
Taking the aforementioned review of the literature into context, the overall objective of this PhD thesis is to evaluate the extent to which the use of remotely sensed spatio-temporal
data allows for a consistent characterization of forest types via observations of canopy reflectance.
Toward that objective, prior to examining the combined spatio-temporal patterns, it will also be useful to separately examine the spatial and temporal patterns of tropical forests because of how instrumental artefacts (caused by naturally occurring qualities like BRDF)
17
differentially affect patterns of spatial variation and temporal variation. To assess that, the specific research questions are as follows:
PART 1: Evaluating the spatial variation in the distribution of tropical forests
1. How do bi-directional effects affect the spatial variation of spectral response of tropical forests, and how do they affect the spatial variation of estimated distributions of forest types?
2. How do estimated spatial distributions of forest types change seasonally?
PART 2: Evaluating temporal variation of tropical forests
3. To what extent does the observed seasonal variation in vegetation indices (VIs) of tropical
forests correspond to seasonal climatic variation or to instrumental or atmospheric artefacts?
4. To what extent does VI variation modelled as a function only of solar elevation change correlate with remotely sensed observations?
5. Provided that the seasonal variation in VIs is not an artefact, what do corrected data
indicate in terms of the seasonal patterns for tropical forests?
PART 3: Examining combined patterns of spatio-temporal variation to identify forest types
6. To what extent can using spatio-temporal data allows for a consistent characterization of the spatial patterns of forest types?
III. Geographic scope and available data
For this study, French Guiana was chosen as the principal study area. Besides being located in the tropics (see Figure 1), there is ongoing research into forest dynamics in French Guiana (e.g. Molino and Sabatier 2001; Madelaine et al. 2007; Wagner et al. 2013). At higher levels of ecological organization, data on the distributions of tree communities or forest ecosystems are also lacking, although there have been multiple efforts to map French Guiana’s forest types (Girou 2001; Gond et al. 2011; Guitet et al. 2015). Similarly, regarding the issue of landscape level phenology, although one study (Pennec et al. 2011) examined such patterns using vegetation indices, its findings have essentially been brought into question following a later study of the broader Amazon basin (Morton et al. 2014). Further regarding the geographic scale of the analyses performed, scales of analysis were variable (e.g. plot level versus landscape level), as is elaborated in the section on the thesis structure.
In terms of examining the thesis’ research questions, there was also a great deal of data available for French Guiana. At the field plot level, available data on forest composition come from botanical transects across French Guiana and collected by researchers from different French research agencies like IRD, CIRAD, the ONF, and others. Those data are also
18
complemented by aerial laser scanning (ALS) data for large field sites across French Guiana, collected mainly within the last few years (~2009-2016), and mainly relevant to the issue of forest structure. Beyond the LiDAR data, the remote sensing data is also complemented by canopy reflectance estimates from a range of sensors, including Landsat-1 to Landsat-8 (1972-present), SPOT VEGETATION (1998-2014), and MODIS (2000-present).
Figure 1. Left: Mean MODIS (MCD43A4)-derived reflectance imagery of French Guiana for
the month of September; right: location of French Guiana in South America.
IV. PhD thesis structure
This PhD thesis takes the form of a monograph. Each of the six research questions is within the appropriate chapter. The overall conceptual flow of the thesis is presented in Figure 2.
19
The Methods presents the detailed, specific methods utilized in the generating the results presented in Chapters 1-3, which themselves present the main findings of this thesis.
Chapter 1 focuses on analysis of satellite data to examine landscape-level spatial variation of
French Guiana’s forests. The last section of the chapter in particular examines how forests’ spatial variation varies temporally and thus provides for a transition to the following chapter on temporal variation.
Chapter 2 focuses exclusively on temporal variation in French Guiana, with comparisons to
forests in central Africa and northern Borneo (forests on similar geographic latitudes). The chapter addresses temporal variation at spatial scales ranging from 1 hectare plots to the territorial level (all of French Guiana) to larger landscapes spanning 10-degree by 10-degree areas across South America, Africa, and Southeast Asia. Data analysis was comprised of the use of statistical techniques for analysing time series, and radiative transfer modelling. The last section of the chapter examines the nexus between temporal variation and forest types and provides a lead-in for the following chapter which examines combined spatio-temporal variation, and a specific chapter discussion likewise the three papers’ findings in context.
Chapter 3 focuses on how remotely sensed spatio-temporal patterns of variation can be used
to characterize French Guiana’s forests. It builds on the findings of the previous chapters and uses time-series analysis techniques to analyse spatial and temporal patterns of canopy variation to develop a forest typology for French Guiana as a proof of concept. The chapter demonstrates that it is indeed possible to map forests based on spatial and temporal patterns, in contrast with more traditional remote sensing methods.
The General Discussion synthetizes the findings of the three preceding chapters. Besides
summarizing how the thesis’ component studies have, overall, responded to the research questions set out in the General Introduction chapter, the General Discussion also examines the overall ecological implications of the findings. It also provides perspectives on future research directions.
20
Methods
I. Overview
Different methods were required to address this thesis’ six research questions. For the assessment of the patterns of spatial variation of French Guiana’s forests, analyses involved classifications of Landsat and MODIS data as means of characterizing spatial variation of forests. That characterization was also aided by analysis of how bi-directional effects affect canopy reflectance estimates. Complementary to those analyses, time-series data from MODIS and SPOT VEGETATION were analysed with statistical methods to characterize the seasonal temporal patterns of variation, at the landscape level. And in contrast to the characterization of spatial patterns of variation, the characterization of temporal patterns of variation were also complemented by analyses of potential environmental drivers of that variation, as well as analyses of atmospheric and instrumental artefacts’ influence on such variation. The analysis of the time-series were also complemented by radiative transfer modelling simulations which allowed for understanding, at the plot level, which processes may be driving temporal variation. Lastly, where insights into spatial and temporal patterns had been gleaned, a large archive of spatial and temporal data were analysed using time-series decomposition techniques to characterize forest types.
The following sections, divided into three main axes (i. spatial variation, ii. temporal variation, and iii. spatio-temporal variation of tropical forests), present the detailed methods used to address each of this thesis’ six principal research questions.
II. Evaluating the spatial patterns of variation of forest type distribution i. Bi-directional effects and estimates of spatial variation of forest types
The following methods address the first research question, related to how bi-directional effects affect the spatial variation of spectral response of tropical forests. As elaborated in the General Introduction, the focus of the research question was to broadly understand how instrumental artefacts caused by BRDF not only affect estimates of canopy spectral response, but also the implications such artefacts have for mapping forest types in the tropics. The South American territory of French Guiana, whose approximate area is 83,534 km2, was selected as
the study area due to its high estimated overall forest cover (Barret at al. 2001). In terms of the coverage of the remote sensing data used to address the research question (i.e. Landsat-5, Landsat-7 and MODIS), the territory covers some eight scenes in the Landsat World Reference System-2 (see Figure 3), and is located entirely within MODIS tile h12v08.
Selection of a method for assessing BRDF effects in reflectance data
With regard to estimating the impacts of BRDF on the reflectance data from those sources, as a number of methods of both assessing [and correcting] the bi-directional effects in Landsat data have been proposed, part of the study design involved selection of an appropriate method for such assessment. One set of methodologies originally tested over Australia, for instance, uses the reflectance estimates from overlapping satellite overpasses to develop BRDF
21
correction factors based on sensor scan angles, among other factors (Danaher et al. 2001; Wu et al. 2001; Danaher 2002; Flood 2013; Flood et al. 2013).
Figure 3. Landsat tiles covering French Guiana (left); Landsat sensor scan angles (right).
On the other hand, another means of assessing and correcting bi-directional effects in Landsat data is proposed by studies piloted over the Congo Basin (Hansen et al. 2008; Potapov et al. 2012). In that method, Landsat data are compared with MODIS surface reflectance estimates to determine the bias between the two reflectance estimates. However, in that approach, the authors proposed evaluating the Landsat-MODIS bias using the MOD09 surface reflectance product which is not corrected for bi-directional effects. A modification on that approach would thus be to calculate the Landsat-MODIS bias using the MODIS surface reflectance data which are already corrected for BRDF effects (i.e. the MCD43A4 product, see (Schaaf et al. 2002), and this was the approach employed in the present study. (As a caveat, it should be mentioned that it is difficult to indicate how well the BRDF correction of the MCD43A4 product is, but this was addressed somewhat by this research.) In addition to being atmospherically corrected, both the MOD09 and MCD43A4 surface reflectance are already corrected for topographic artefacts (Strahler and Muller 1999; Vermote and Vermeulen 1999).
Generation of reference MODIS reflectance dataset
Nadir BRDF-corrected reflectance estimates from MODIS from the MCD43A4 product (MODIS collection 5) were acquired from the publicly accessible NASA Reverb portal (http://reverb.echo.nasa.gov/reverb/) for the period July 2002 – March 2014 for the h12v08 tile which covers French Guiana. The quality assessment / quality control (QA/QC) flags from the corresponding MCD43A2 product were used to filter the reflectance data by extracting only data corresponding to “best quality, full [BRDF] inversion” (Schaaf et al. 2002). Since the Landsat data to which the MODIS reflectance was to be compared corresponded to data from September (of different years), a single September composite of the filtered MCD43A4 data was generated by averaging reflectance data corresponding to the multiple, overlapping 16-day datasets which cover September. These included the data for Julian 16-days 241 (29 August
22
to 13 September), 249 (covering 6-21 September), and 257 (14-29 September). Averaging the data over the period indicated was used as a means of both reducing noise in the MODIS reflectance data, and maximizing the number of observations over French Guiana, necessitated by shifting cloud cover. Further, the September composite was assembled by using minimum reflectance in all of the spectral bands, with the exception of the near-infrared band, for which maximum reflectance was extracted. This was also done as a means of removing noise, as proposed in an earlier study (Hansen et al. 2003). As evidenced by earlier research, aerosols tend to increase spectral reflectance in most visible and mid-infrared parts of the electromagnetic spectrum, but they actually decrease spectral reflectance in the near-infrared part of the spectrum (Kaufman et al. 1992). Hence, compositing using the maximum near-infrared reflectance will tend to remove aerosol-contaminated pixels.
Generation of Landsat surface reflectance dataset
The assembly of a Landsat surface reflectance mosaic for French Guiana involved more data processing than that of assembling the MODIS mosaic (see Figure 3). For one, imagery from multiple dates with slightly differing illumination conditions had to be selected because of persistent cloud cover over French Guiana, which is even a problem in the dry season. The imagery used were acquired via the U.S. Geological Survey’s Glovis portal (http://glovis.usgs.gov), and had acquisition dates ranging from 27 September 2005 to 5 September 2009 (Table 1). Where reflectance is known to be impacted by solar elevation, it should be noted that the images had a maximum difference in solar elevation of only 2 degrees (Nagol et al. 2015).
Table 1. Landsat imagery used for the creation of an image mosaic of French Guiana. No. Landsat Path-Row Location Satellite / Sensor Date Solar elevation Solar azimuth
1 226-57 northeast Landsat-7 ETM+ 28 Sept. 2008 62.3° 103.5° 2 226-58 southeast Landsat-7 ETM+ 28 Sept. 2008 62.4° 100.7° 3 227-56 north central Landsat-7 ETM+ 27 Sept. 2005 62.3° 105.2°
4 227-57 central Landsat-7 ETM+ 27 Sept. 2005 62.5° 102.4°
5 227-58 south central Landsat-7 ETM+ 27 Sept. 2005 62.5° 99.6°
6 228-56 northwest Landsat-5 TM 2 Sept. 2008 60.5° 84.7°
7 228-57 central west Landsat-5 TM 5 Sept. 2009 61.5° 84.1°
8 228-58 southwest Landsat-5 TM 5 Sept. 2009 61.1° 81.5°
Following acquisition of the images, three image strips were generated using the mosaic function in the ArcGIS software platform, corresponding to eastern, central, and western French Guiana. Due to the absence of data from every 7th line of Landsat-7 data caused by the
Scan-Line Corrector malfunction, the Landsat-7 image strips were further processed using the “Frame and Fill” software package to fill the data gaps using the most cloud-free data from other dates (Lillesand et al. 2007, Irish 2009). Following gap-filling, the image strips were atmospherically corrected to remove the effects of haze using the haze optimization transform method included in the ATCOR package (Zhang et al. 2002; Richter and Schlaper 2016).
23
In contrast with other available tools, ATCOR was selected for the image atmospheric corrections because that correction was also coupled with topographic correction, which was necessary due to the complex topography of French Guiana (Richter & Schlaper 2016). The topographic correction – which made use of the 30m SRTM digital elevation model of French Guiana – aided in minimizing the distortions that topographic shadowing has on surface reflectance (Richter and Schlaper 2016). Via such processing, the Landsat data were transformed from digital numbers to estimates of surface reflectance, comparable to the surface reflectance estimates of MODIS, albeit at different spatial resolutions (i.e. 30m vs. 463m). As a final step, the data were also masked of clouds and cloud shadows using masks generated via use of the CLASlite software package (Asner 2009; Asner et al. 2010). Complementary to this, for the Landsat data, raster surfaces of the approximate sensor scan angles were generated (Figure 3). For the forest type mapping, the Landsat surface reflectance data were also adjusted for BRDF using the September reference reflectance dataset which had been assembled from the MODIS MCD43A4 Nadir BRDF-adjusted Reflectance (NBAR) data (Schaaf et al. 2002). This was done by generating, band by band, BRDF adjustment factors from the Landsat-MODIS reflectance differences. This adjustment resulted in the development of a wall-to-wall, BRDF-corrected Landsat mosaic of French Guiana.
Figure 4. Work flow of Landsat data processing for BRDF assessment.
Evaluation of anisotropy in reflectance data
The subsequent step in the assessment consisted of examining the degree of anisotropy in the reflectance data, across the sensors’ scanning angles. This consisted of examining how the
24
Landsat surface reflectance estimates varied with the scanning angle, looking for residual anisotropy in the BRDF-corrected MODIS reflectance estimates, and examining the degree to which the differences between surface reflectance from MODIS and Landsat were dependent on the scan angle. In order to compare the Landsat and MODIS surface reflectance estimates, the Landsat data were resampled up to the resolution of the MODIS data (i.e. 463m), using the resample function in ArcGIS (McCoy et al. 2001). Nearest neighbour resampling was chosen as it mostly preserved the original spectral values, relative to other resampling methods which may have distorted the reflectance values (Jensen 2006; Lillesand et al. 2007; Studley and Weber 2011).
Following this, spectral band by spectral band, the data from the two sources were compared, using the raster subtraction function of ArcGIS (McCoy et al. 2001), allowing for pixel-to-pixel comparisons, to indicate the extent to which the reflectance estimates differed. The results of those comparisons were raster surfaces whose individual pixels indicated the differences in reflectance between MODIS and Landsat. Absolute reflectance differences exceeding 5% were considered to be caused by factors other than BRDF, and were filtered out, as these might reflect differences due to land clearings between the two image dates or residual clouds or cloud shadows, with the 5% threshold following an earlier study (Potapov et al. 2012). Where those differences varied spatially, mean estimates of the differences per band were reported as a means of understanding how BRDF impacts each spectral band globally, and not locally.
Complementary to the calculations of the reflectance data differences, simple statistical analyses were also done using the raster data and linear models constructed in the software platform R (R Foundation 2011) to assess the following (with j as the model coefficients and
i the model error):
i.
the extent to which the Landsat reflectance estimates varied across the scanning track (Landsatreflectancei = 0 + 1 scan anglei + i)ii.
the extent to which the MODIS reflectance estimates varied across the scanning track (MODIS reflectancei = 0 + 1 scan anglei + i)iii.
the extent to which differences in reflectance between MODIS and Landsat were correlated with the Landsat sensors’ scan angles (Reflectance differencei = 0 + 1 scananglei + i)
In the case of the above, it is assumed that the anisotropy of the Landsat reflectance follows a linear function with respect to the view zenith angle. By contrast, if MODIS imagery are properly corrected for BRDF, such linear effects should not be noted in MODIS reflectance data. Following the assessment of anisotropy, the spatial distribution of forest types were evaluated, with the overall approach used in that forest type mapping depicted in Figure 5. Further, to test the impact of BRDF on the mapping of French Guiana’s forest type, a dual-pronged approach was tested:
i. using imagery not corrected for BRDF effects, and ii. using imagery corrected for BRDF effects.
25
Figure 5. Workflow for mapping of French Guiana’s forest types using Landsat data.
Forest type mapping
While there are multiple ways of mapping forests using remote sensing, the present analysis focused on use of the ‘classical’ supervised spectral classification approach, arguably the most common approach used for forest type mapping (Lillesand et al. 2007). As one of the main inputs to supervised classification is a classification scheme, as a first filter, a preliminary forest classification scheme was developed based on data from botanical transects, including the types of forests listed in Table 2.
Per the workflow, in order to evaluate the impacts of bi-directional effects on the reflectance data, as indicated previously, two separate data streams were used in the classification, i.e. (i) data not corrected for BRDF, and (ii) data corrected for BRDF. For the classification itself, field plot data was utilized along with the imagery to generate spectral signatures of the respective forest types. Supervised classification was then performed on the two mosaics, using the maximum likelihood classification algorithm, generating preliminary forest type maps. Via the maximum likelihood classification approach, individual pixels from the Landsat mosaics were mapped to one class (of the 15 classes indicated in Table 2) to which they were most similar spectrally (Lillesand et al. 2007). In that sense, a classification is merely a clustering