HAL Id: hal-00296132
https://hal.archives-ouvertes.fr/hal-00296132
Submitted on 30 Jan 2007
HAL is a multi-disciplinary open access
archive for the deposit and dissemination of
sci-entific research documents, whether they are
pub-lished or not. The documents may come from
teaching and research institutions in France or
abroad, or from public or private research centers.
L’archive ouverte pluridisciplinaire HAL, est
destinée au dépôt et à la diffusion de documents
scientifiques de niveau recherche, publiés ou non,
émanant des établissements d’enseignement et de
recherche français ou étrangers, des laboratoires
publics ou privés.
Technical Note: Use of a beam width probe in an
Aerosol Mass Spectrometer to monitor particle
collection efficiency in the field
D. Salcedo, T. B. Onasch, M. R. Canagaratna, K. Dzepina, J. A. Huffman, J.
T. Jayne, D. R. Worsnop, C. E. Kolb, S. Weimer, F. Drewnick, et al.
To cite this version:
D. Salcedo, T. B. Onasch, M. R. Canagaratna, K. Dzepina, J. A. Huffman, et al.. Technical Note: Use
of a beam width probe in an Aerosol Mass Spectrometer to monitor particle collection efficiency in
the field. Atmospheric Chemistry and Physics, European Geosciences Union, 2007, 7 (2), pp.549-556.
�hal-00296132�
www.atmos-chem-phys.net/7/549/2007/ © Author(s) 2007. This work is licensed under a Creative Commons License.
Chemistry
and Physics
Technical Note: Use of a beam width probe in an Aerosol Mass
Spectrometer to monitor particle collection efficiency in the field
D. Salcedo1,2, T. B. Onasch3, M. R. Canagaratna3, K. Dzepina2,4, J. A. Huffman2,4, J. T. Jayne3, D. R. Worsnop3, C. E. Kolb3, S. Weimer5,*, F. Drewnick6, J. D. Allan7, A. E. Delia8, and J. L. Jimenez2,4
1Centro de Investigaciones Qu´ımicas, Universidad Aut´onoma del Estado de Morelos, Cuernavaca, Morelos, M´exico 2Cooperative Institute for Research in the Environmental Sciences (CIRES), University of Colorado at Boulder, CO, USA 3Center for Aerosol and Cloud Chemistry, Aerodyne Research Inc., Billerica, MA, USA
4Department of Chemistry and Biochemistry, University of Colorado at Boulder, Boulder, CO, USA 5Atmospheric Sciences Research Center, University at Albany, Albany, NY, USA
6Particle Chemistry Department, Max Planck Institute for Chemistry, Mainz, Germany
7Department of Physics, University of Manchester Institute of Science and Technology, Manchester, UK 8Program in Atmospheric and Oceanic Sciences, University of Colorado at Boulder, Boulder, CO, USA *now at: EMPA, Duebendorf, Switzerland and Paul Scherrer Institute, Villigen, Switzerland
Received: 2 May 2005 – Published in Atmos. Chem. Phys. Discuss.: 28 June 2005 Revised: 8 January 2007 – Accepted: 21 January 2007 – Published: 30 January 2007
Abstract. Two Aerodyne Aerosol Mass Spectrometers (Q-AMS) were deployed in Mexico City, during the Mexico City Metropolitan Area field study (MCMA-2003) from 29 March–4 May 2003 to investigate particle concentrations, sources, and processes. We report the use of a particle beam width probe (BWP) in the field to quantify potential losses of particles due to beam broadening inside the AMS caused by particle shape (nonsphericity) and particle size. Data from this probe show that no significant mass of particles was lost due to excessive beam broadening; i.e. the shape- and size-related collection efficiency (Es) of the AMS during
this campaign was approximately one. Comparison of the BWP data from MCMA-2003 with other campaigns shows that the same conclusion holds for several other urban, ru-ral and remotes sites. This means that the aerodynamic lens in the AMS is capable of efficiently focusing ambient parti-cles into a well defined beam and onto the AMS vaporizer for particles sampled in a wide variety of environments. All the species measured by the AMS during MCMA-2003 have similar attenuation profiles which suggests that the particles that dominate the mass concentration were internally mixed most of the time. Only for the smaller particles (especially below 300 nm), organic and inorganic species show different attenuation versus particle size which is likely due to partial external mixing of these components. Changes observed in the focusing of the particle beam in time can be attributed, in part, to changes in particle shape (i.e. due to relative
hu-Correspondence to: J. L. Jimenez
midity) and size of the particles sampled. However, the rela-tionships between composition, atmospheric conditions, and particle shape and size appear to be very complex and are not yet completely understood.
1 Introduction
The Aerodyne Aerosol Mass Spectrometer (AMS) has been widely used to measure concentrations of non-refractory species in particles smaller than about 1 µm (NR-PM1) with high time and size-resolution. However, in previous studies using the AMS (Allan et al., 2004; Drewnick et al., 2004b; Hogrefe et al., 2004; Zhang et al., 2005b) it has been ob-served that there is a systematic (but highly reproducible) underestimation of the mass concentration of aerosols mea-sured with the AMS when compared to other quantitative aerosol measurements such as the Particle Into Liquid Sam-pler (PILS) or Scanning Mobility Particle Sizer (SMPS). In these studies, the underestimation in mass concentration ob-served with the AMS indicates AMS Collection Efficiencies (CE) ranging from 0.43 to 1.
Huffman et al. (2005) have recently defined the observed AMS collection efficiency as the product of three terms:
CE=EL∗Es ∗Eb. Previously, the latter two effects (and
sometimes all three effects) had been included in one collec-tion efficiency (CE=Es∗Ebor CE=EL∗Es∗Eb) (Alfarra
et al., 2004; Drewnick et al., 2004a; Zhang et al., 2004). The
ELterm accounts for the fraction of particles in PM1that are not transmitted into the AMS due to limited transmission of
550 D. Salcedo et al.: AMS beam width probe in the field the inlet and lens of the AMS (Jayne et al., 2000; Zhang et
al., 2004). Esand Ebaccount for possible effects that cause
non-detection of the PM1 particles that are introduced into the instrument and exit the aerodynamic lens. The bounce-related collection efficiency (Eb) could be smaller than one
if some of the dry less-volatile particles (such as those with a high proportion of (NH4)2SO4) bounce after impacting the AMS vaporizer, instead of evaporating. The shape- and size-related collection efficiency (Es) could be less than one for
nonspherical particles because the efficiency with which they are focused by the lens is reduced due to lateral forces acting upon the particles during the acceleration in the lens (Jayne et al., 2000; Huffman et al., 2005). This could, in principle, cause some irregular particles to “miss” the AMS vaporizer.
While EL is less than 1 at the small and large particle
size ends of the aerodynamic lens transmission range due to spherical particle losses in the inlet and aerodynamic lens,
ES accounts for additional particle loss due to the potential
inability of the aerodynamic lens to focus irregular particles onto the AMS vaporizer for detection. The latter effect may be important for particles less than 100 nm in diameter and is especially significant for sampling nanoparticles (Wang et al., 2005) because spherical particles at these sizes are less well focused by the lens, and any additional effect that de-grades focusing (such as non-sphericity) is more likely to cause particle losses than for larger sizes which are very well focused.
The use of a particle beam width probe (BWP) to deter-mine Es in the laboratory (Jayne et al., 2000; Huffman et
al., 2005) and in the field (Allan et al., 2006a; Weimer et al., 2006) has been described previously. However, this is the first report that analyzes in detail data from a BWP deployed in the field and compares the results obtained in several field studies.
The Mexico City Metropolitan Area field experiment (MCMA-2003) was an intensive 5-week campaign that took place in the spring of 2003 (31 March–4 May). It was con-ducted with the goal of investigating the atmospheric chem-istry of the MCMA, with particular focus on emissions quan-tification, gas-phase photochemistry, and secondary particu-late matter formation. During the MCMA campaign, we de-ployed two Aerodyne Quadrupole Aerosol Mass Spectrome-ters (Q-AMS); one at the CENICA supersite, located in the southeast area of Mexico City (Salcedo et al., 2006), and one on the Aerodyne Mobile Laboratory (Kolb et al., 2004). Both AMSs used a BWP to investigate the particle beam disper-sion and to estimate the shape- and size-related collection ef-ficiency of the Q-AMSs. In this paper, we briefly describe the BWP and analyze the particle beam width measurements as a function of relative humidity and particle size at the CENICA supersite and at La Merced, a site downtown Mexico City in an area of heavy vehicle traffic.
Results from beam width probe deployments at other sites in a wide variety of environments are briefly presented here and compared to the MCMA results:
1. New York City (NY): Q-AMS measurements were carried out during the Particulate Matter Technology Assessment and Characterization Study – New York (PMTACS-NY) 2004 winter campaign. The site was located in the campus of Queens College, within 1 km of two major traffic highways in the New York City metropolitan area (Weimer et al., 2006).
2. Duke Forest: the measurements were part of the Chem-ical Emission, Loss, Transformation and Interactions within Canopies (CELTIC) study, which took place during July 2003. The site was based at the Forest-Atmosphere Carbon Transfer and Storage (FACTS-I) facility located in the Blackwood Division of Duke For-est, near Durham, North Carolina. The forest is com-posed primarily of trees that emit both isoprene and ter-penes, leading to likely formation of biogenic secondary organic aerosol. The site is also impacted by regional pollution transport (Delia, 2004).
3. Pinnacle Park: Pinnacle State Park in Addison, NY, is a rural site surrounded by a 9-hole golf course, a pic-nic area, undeveloped state forest lands, abandoned pas-tures, a 20 hectare pond, and a handful of homes. Mea-surements were part of the PMTACS-NY program in August 2004 (Schwab et al., 2006).
4. Chebogue Point: as part of the International Consortium for Atmospheric Research on Transport and Transfor-mation (ICARTT) intensive field study during the sum-mer of 2004, a fixed field site was operated at Chebogue Point. This was a remote site located on the coast of southern Nova Scotia which was designed to study the emissions from mainland North America within the boundary layer a period of hours to days after emission (Allan et al., 2006b1).
The particle beam width and the shape- and size-related col-lection efficiency (Es) was calculated and compared at all the
above sites to test the efficiency of the aerodynamic lens to focus the particles sampled in different environments.
2 Experimental
The Q-AMS has been described in detail previously (Jayne et al., 2000; Jimenez et al., 2003) and the details of its op-1Allan, J. D., Coe, H., Cubison, M. J., Jimenez, J. L., Huffman,
J. A., DeCarlo, P. F., Northway, M., Canagaratna, M. R., Onasch, T., Cross, E. S., Coulson, G., Zhang, Q., Goldstein, A. H., Williams, B. J., Millet, D. B., Ogren, J., Andrews, E., Sheridan, P., Jefferson, A., Roberts, J. M., Kreisberg, N. M., Hering, S. V., Russell, L., Gilardoni, S., Quinn, P., and Worsnop, D. R.: Overview of In Situ Measurements of Particle Composition at Chebogue Point, Nova Scotia, During Summer 2004 and Insights into Organic Chemical Processes, J. Geophys. Res., submitted, 2006b.
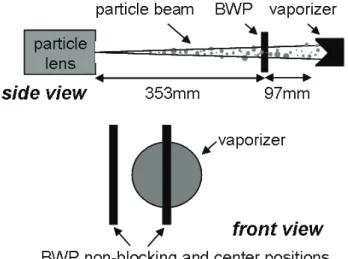
Fig. 1. Schematic diagram of the AMS vaporizer and Beam Width
Probe (BWP). The dimensions in the figure correspond to a long chamber (Huffman et al., 2005).
eration and main results from the CENICA supersite are de-scribed elsewhere (Salcedo et al., 2006). The BWP was used to allow the estimation of the potentially reduced particle col-lection efficiency due to particle size and shape, as well as to study the degree of nonsphericity of the ambient aerosol. The design of the probe and the techniques for analysis and in-terpretation of its data have been extensively discussed else-where (Jayne et al., 2000; Huffman et al., 2005).
Figure 1 schematically shows the probe used at CENICA, which consisted of a 0.41 mm diameter wire which casts a “shadow” 0.52 mm wide at the surface of the vaporizer. The wire was moved intermittently to several fixed positions blocking different parts of the particle beam from reaching the AMS vaporizer, in order to determine the attenuation of the signal versus wire position. The BWP was alternated be-tween the “out” position (not blocking any part of the va-porizer) and one of the seven partially blocking positions in front of the 3.81 mm diameter vaporizer. One of the seven blocking positions covered the center of the vaporizer and the other six were symmetrically located on each side of the beam center. When the BWP was on the center position, its shadow covered 21.8% of the total area of the vaporizer. The probe was moved every two minutes, with a total cy-cling time (rotating through the entire round of positions) of 28 min. Note that due to imperfections in the construction of the aerodynamic lens, different particle sizes can be fo-cused along slightly different axis (Huffman et al., 2005), with this effect being more pronounced for the smaller parti-cles transmitted by the lens. Since the alignment of the BWP and aerodynamic lens is always performed with particles in the accumulation mode size range, this may lead to a system-atic bias with lower particle beam attenuation for the smaller particles. 100 80 60 40 20 0 % signal attenuation -2 -1 0 1 2
BWP distance from center (mm) vaporizer width (3.81mm) projected wire width (0.52 mm) CENICA airbeam nitrate sulfate ammonium organics
Fig. 2. Average signal attenuation for the airbeam and the main
AMS species measured at CENICA as a function of distance of the BWP from the center of the vaporizer. Nitrate, sulfate, and organics curves are not visible because they are behind the ammonium curve. The relative sizes of the vaporizer and the BWP (projected onto the plane of the vaporizer) are shown at the bottom of the figure.
The Q-AMS has been deployed using a number of dif-ferent configurations, with two difdif-ferent chamber lengths (“long” and “short”) (Huffman et al., 2005), as well as sev-eral designs of the aerodynamic lens (Zhang et al., 2004). All the AMS instruments mentioned in this paper used a long chamber (see Fig. 1) and a “standard” aerodynamic lens. Al-though the operation of the BWP was similar in all the instru-ments, the diameter of the wire used was different. The wire used at NY and Pinnacle Park was 1.0 mm in diameter, while the wire used at La Merced, Duke Forest and Chebogue Point had a diameter of 0.5 mm.
3 Results and discussion
The time series of the signal attenuation at CENICA was cal-culated for each AMS species by comparing the particle sig-nal when the wire was blocking the beam to the nonblocking position signals in the 2 minutes preceding and following the attenuated measurement. The average signal attenuation for each species measured as a function of BWP position across the particle beam is shown in Fig. 2. Non-refractory chlo-ride is not included because its concentration was generally very low most of the time and its attenuated signal profile is very noisy. The attenuation at each position is similar for all species, and it is large only when the BWP is at the center po-sition. This means that the particle beam is well-focused on the vaporizer, covering only a small area in the center of it. The area under the curve in Fig. 2 does not add up to 100%, as is expected if all the wire positions are situated next to each other, with no overlapping or gapping. The reason is that, due to an error in the wire mechanism setup, there were
552 D. Salcedo et al.: AMS beam width probe in the field 100 80 60 40 20 0 % signal attenuation 2 1 0 -1 -2
BWP distance from center (mm) vaporizer width (3.81mm) projected wire width (0.64mm)
La Merced 2D Gaussian organics sulfate nitrate slv
Fig. 3. Average signal attenuation for the main AMS species
mea-sured at La Merced as a function of distance of the BWP from the center of the vaporizer. Line: signal attenuation caused by a 0.5 mm wire, calculated using the 2-D Circular Gaussian model described by Huffman et al. (2005).
small gaps between the middle wire positions that caused the wire not to cover 100% of the vaporizer area. The fact that the profiles in Fig. 2 of all species are similar suggests that the ambient particles that accounted for most of the submi-cron mass were typically internally mixed during MCMA-2003. Similar conclusions were obtained from the analysis of the speciated size distributions (Salcedo et al., 2006) and from electron microscopy studies of individual particles col-lected at the CENICA site (Johnson et al., 2005).
The airbeam signal (grey trace in Fig. 2) is attenuated at all positions except the outermost one, which indicates that the airbeam is not as well-focused as the particle beam. The attenuation of the airbeam is not symmetrical around the cen-ter of the AMS vaporizer. This asymmetry in the airbeam might be caused by slight imperfections in the apertures and skimmers that the airbeam traverses inside the AMS. These imperfections do not appear to significantly affect the par-ticle beam focusing. Another possible cause of the slight asymmetry of the broad airbeam distribution is a potential asymmetry of the electron density in the ionizer, caused by the position of the filament. If that is indeed the case, the particle beams are probably too narrow and the resolution of the spatial measurements are too low to observe a similar asymmetry in the particle signal.
Huffman et al. (2005) have used a 2-D Circular Gaussian model to describe the particle density distribution (the beam shape) after the aerodynamic lens. Using this model, it is possible to determine the beam width at the vaporizer from the particle signal attenuation observed due to the BWP. Fig-ure 3 shows the average signal attenuation for speciated mass loading measured at La Merced, compared with the expected attenuation for the 0.5 mm wire used, calculated using the 2-D Gaussian model. The beam width was fitted so that ex-pected attenuation showed the best correlation with the field data. The plot for ammonium is not included because the
0.9 0.8 0.7 0.6 0.5 0.4 0.3 0.2 0.1 0.0 σlv (mm)
CENICA La Merced NY Duke Pinnacle Chebogue
0.9 0.8 0.7 0.6 0.5 0.4 0.3 0.2 0.1 0.0 σ lv (mm) 1.0 0.9 Es
Fig. 4. Box-whisker plots of the beam width for several campaigns
using Q-AMSs equipped with a BWP. Dots represent the average beam width (σlv); horizontal lines represent the median; bottom and
top of the boxes represent the 25 and 75 percentiles, respectively; and the bottom and the top whiskers represent the 5 and 95 per-centiles, respectively. On the right side, the shape- and size-related collection efficiency (Es) as a function of beam width is shown.
attenuation profile is noisier than for the other species due to higher noise at the mass peaks used by the AMS to quan-tify this species (mainly caused by interference from O+ions
from O2and water with the NH+2 ions). However, the atten-uation profile for ammonium is very similar to the profiles for nitrate and sulfate. The agreement between the observed and the expected attenuation due to the BWP indicates that the 2-D Gaussian model is consistent with the particle beam shapes observed for ambient particles.
Applying the 2-D Circular Gaussian model of Huffman et al. (2005) to the attenuation profile of the total AMS mass concentrations, we calculated the time dependent particle beam width at the vaporizer plane (σlv) for each of the
cam-paigns listed above. σlvis the standard deviation for the 2-D
Circular Gaussian function, centered at the axis defined by the lens and the center of the vaporizer, that describes the particle density distribution in the beam at the plane of the va-porizer of a long chamber AMS. Figure 3 shows the average
σlv for the La Merced study. The resulting time dependent
particle beam width was then averaged over all the sampling time in each study. The mean values, along with the median, and the 5, 25, 75, and 95 percentiles, are shown in Fig. 4. This figure also shows the relation between particle beam width and the shape- and size-related collection efficiency (Es), (Fig. 4 in Huffman et al., 2005). The particle beam
width values measured during MCMA-2003 correspond to a collection efficiency for the AMS vaporizer that is larger than 99% (Es∼1). Thus, no significant particle mass went
undetected because of excessive beam divergence. Although the other sites represent very different environments (one ur-ban, two rural and one remote) with correspondingly differ-ent particle chemical compositions and size distributions, the AMS particle beam in nearly all cases was sufficiently well focused for complete collection at the vaporizer (Es∼1).
6 4 2 0 d M /dlog Dva (µg m -3 ) 7 8 9 100 2 3 4 5 6 7 8 91000 Nitrate (a) 100 80 60 40 20 0 % signal att 7 8 9 100 2 3 4 5 6 7 8 91000
Vacuum Aerodynamic Diameter (nm)
CENICA Nitrate Organics Sulfate Laboratory Ammonium nitrate Ammonium sulfate Oleic acid and DOS
(c) Es= 0.95 Es= 0.99 30 20 10 0 d M /dlog D va (µg m -3 ) 7 8 9 100 2 3 4 5 6 7 8 91000 Organics (b)
Vacuum Aerodynamic Diameter (nm) no BWP
BWP at center
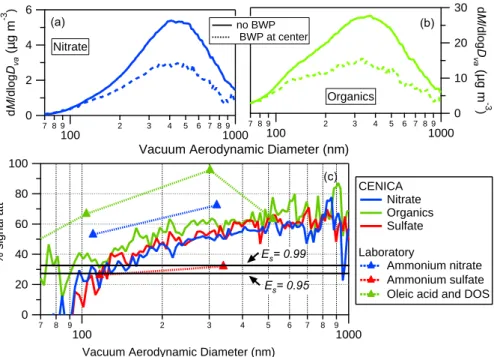
Fig. 5. Panels (a) and (b): Campaign-average size distributions obtained by the AMS with the BWP in the non-blocking and particle beam
center-blocking positions, measured at CENICA during MCMA-2003. Panels (c): signal attenuation caused by the BWP at the center position as a function of particle size. Also included is data from laboratory experiments with ammonium nitrate, ammonium sulfate, oleic acid (Huffman et al., 2005), and DOS (Liu et al., 1995) particles.
Only few periods were observed during the NY and Pin-nacle studies when the sampled particle beam widths were greater than 0.77 mm, corresponding to a loss of ∼5% of the particles due to inadequate focusing. Thus, the standard aerodynamic lens used in the AMS is capable of efficiently focusing the particles that dominate the mass distribution into a narrow particle beam, with particle mass losses due to inad-equate focusing close to zero for a broad variety of different aerosols most of the time, with ES rarely smaller than 0.95.
Interestingly, the Chebogue data shows a very narrow beam most of the time. This is probably due to the relatively high RH during the campaign, because the site was within 100 m of the ocean and frequently under foggy conditions.
Particle beam focusing in aerodynamic lenses is known to be a function not only of shape, but also of particle size (Zhang et al., 2004; Huffman et al., 2005). In order to ex-plore the focusing of the ambient particle beam as a function of particle size, panels (a) and (b) in Fig. 5 show the size dis-tribution for particulate nitrate and organics at the CENICA site, compared with the size distribution measured when the BWP was blocking the center of the particle beam. Panel (c) in Fig. 5 shows the signal attenuation when the BWP was on the center position as a function of particle size for ni-trate, organics and sulfate. The plot for ammonium is not included because of the reasons explained above. However, the attenuation profile for ammonium is very similar to the profiles for nitrate and sulfate. For the non-center wire
posi-tions, the measured attenuation was near zero and therefore no size-dependent attenuation was observed.
Panel (c) in Fig. 5 also shows the attenuation expected for monodisperse pure-component particles calculated from laboratory measurements (Liu et al., 1995; Huffman et al., 2005). The attenuation for oleic acid particles, which are spherical, represent the maximum attenuation expected for a given particle diameter. Ammonium nitrate and sulfate particles show less attenuation than oleic acid because they are crystalline solids (nonspherical), the effect being more pronounced for ammonium sulfate. Ambient particles gen-erally show much less attenuation than spherical oleic acid, indicating that ambient particles are not spherical, and in be-tween those observed in the laboratory for pure ammonium nitrate and ammonium sulfate, indicating that ambient non-sphericity falls in between that of those two types of pure particles. Figure 5 also reveals a size dependence of the BWP signal attenuation that is qualitatively similar for parti-cles with a vacuum aerodynamic diameter (dva) (DeCarlo et
al., 2004) below 350 nm for all species in the laboratory and the field. Smaller ambient particles are not as well focused as spherical particles of the same size. This leads to a somewhat reduced Es at small particle sizes (dva<∼120 nm), which is
of minor importance in terms of the total particle mass since a very small fraction of the mass is typically found at those small sizes.
554 D. Salcedo et al.: AMS beam width probe in the field 80 70 60 50 40 30 20 % signal att. 14/04/03 16/04/03 18/04/03 20/04/03 100 80 60 40 20 0 RH 1.0 0.8 Es % signal att. RH more spherical less spherical 80 70 60 50 40 30 20 % signal att. 12/04/03 14/04/03 16/04/03 0.6 0.4 0.2 0.0 mass fraction 1.0 0.8 Es % signal att. Total (10 - 200 nm) larger smaller
Fig. 6. Time series of the signal attenuation caused by the BWP
at the center position, ambient RH and mass fraction of particles with dva<200 nm, measured at CENICA during MCMA-2003. On
the right side of both panels, Es is shown as a function of signal
attenuation, calculated using Huffman et al. (2005) model for the dimensions of the instrument and BWP used during this campaign (long chamber and a wire of 0.41 mm).
Zhang et al. (2004) estimated that spherical particles would suffer from incomplete collection below ∼60 nm. Figure 5 suggests that the effect becomes important be-low ∼120 nm due to the additional effects of nonspheric-ity. This is consistent with the observation by Salcedo et al. (2006) that the ultrafine particle mode is dominated by non-spherical combustion particles in Mexico City. Because the combustion-related organics are likely internally mixed with soot, these particles are often nonspherical and should form a wider beam, showing a lower attenuation. The atten-uation of smaller particles is likely to be further reduced by the slight dependence of the particle focusing center on par-ticle size, as discussed above. Thus, the parpar-ticle beam widths and Es deduced from these data should be considered upper
and lower limits, respectively. Particles in the accumulation mode (300–800 nm) show much larger attenuation, indicat-ing that they are better focused than the smaller particles. The similar attenuation of all species in the accumulation mode is again suggestive of internal mixing for this mode. However, for the smaller size range (<300 nm), the attenuation is dif-ferent for the organics, sulfate and nitrate, which suggests that the organic and inorganic species in the smaller particles are at least partially externally mixed, again consistent with previous observations (Salcedo et al., 2006).
Figure 6 presents time series of the attenuation of the to-tal signal at the CENICA site, caused by the BWP at the position that blocks the center of the particle beam. The data have been smoothed over time 5 points (∼2 h) to reduce
high-Table 1. Correlation coefficients (r2) calculated for the attenuation caused by the BWP at the center position vs. different parame-ters at the CENICA site during MCMA-2003. The data have been smoothed by 5 points (∼2 h) before calculating r2to reduce high-frequency noise.
Parameter Linear Correlation
Coefficient (r2)
RH 0.064
OOA fraction 0.033
HOA fraction 0.032
Mass fraction of particles with dva<200 nm 0.026
Mass fraction of particles with dva>200 nm 0.026
Sulfate fraction 0.022
BC fraction 0.009
frequency noise. The attenuation of the signal fluctuates in time, indicating changes in the particle beam focusing which might be attributed to changes in particle size distribution and the degree of nonsphericity. Only few days of the campaign are shown because the purpose of the figure is only to illus-trate the range of variation of this measurement. The figure also illustrates the relation between the attenuation caused by a 0.41 mm wire and Es from the model of Huffman et
al. (2005).
In order to explore the relationship between particle shape and size and the BWP signal attenuation (i.e. with particle beam width), the relative humidity (RH) and the mass frac-tion of particles with dva<200 nm are also shown in Fig. 6.
RH is expected to correlate with particle shape because hy-groscopic particles are likely liquid at higher RH leading to more spherical shapes (Allan et al., 2006a). Figure 6 shows that some of the variability in the signal attenuation appears to correlate with RH and some with the mass fraction of the smaller particles. However, these correlations do not always hold. Other parameters that may be correlated with parti-cle sphericity or nonsphericity include mass fractions of oxy-genated organic aerosol (OOA, which might be an indication of particle aging (Zhang et al., 2005a; Zhang et al., 2005c)), black carbon, sulfate, and hydrocarbon-like organic com-pounds (HOA, mostly primary combustion aerosol (Zhang et al., 2005c)). Table 1 shows correlation coefficients cal-culated for BWP attenuation vs. these parameters. None of these parameters explains more than 6.4% of the variance in the BWP signal attenuation. Similarly as for RH and smaller particle mass fraction, the correlation or anti-correlation be-tween those parameters and signal attenuation is not always clear from their time series. These results indicate that mul-tiple parameters may affect the measured signal attenuation (and thus particle beam width) in a complex way. In order to better understand this issue, detailed laboratory work with particles of known sizes, composition and shapes (e.g. com-bined with off-line electron microscopy measurements) as
well as under known RH conditions, and in-depth analysis of field data using multiple regression models need to be per-formed.
4 Conclusions
We report the use of a particle beam width probe inside two Q-AMSs in Mexico City during the MCMA-2003 field cam-paign to probe the surrogate shape of the particles, and to quantify potential losses of particles due to beam broaden-ing. Results from these measurements show that the 2-D Circular Gaussian model of Huffman et al. (2005) is well suited to describe the particle distribution within the particle beam during ambient measurements. Particle losses due to dispersion of the beam were caused by shape and size of the particles and were very small (Es∼1) in Mexico City during
MCMA-2003. This is typically also true for other campaigns in various urban, rural and remote sites.
Attenuation of measured aerosol mass loading signals due to the BWP was similar for all the chemical species measured by the AMS, which is indicative of particles being internally mixed most of the time. Particles smaller than 300 nm ex-hibited somewhat different attenuations for the organic and inorganic components likely indicating partial external mix-ing of these smaller particle components. Observed attenu-ation of the ambient particles was found to be significantly lower than one would expect for spherical particles, and was generally between those determined for pure ammonium ni-trate and ammonium sulfate particles in the laboratory. This also suggests internal mixture of the various aerosol compo-nents, resulting in moderately nonspherical particle shapes that produce intermediate particle beam broadening. Tempo-ral variations in the BWP attenuation indicate changes in the particle beam focusing likely attributable to changes in the particle shape and size. However, the relationships among the particle shape, size and particle beam focusing are com-plex and more laboratory and field work is needed in order to better understand this issue.
Acknowledgements. The authors are very grateful to R. Ramos from the Government of the Federal District for help with logistical and customs issues. We thank Q. Zhang of CU for assistance with Q-AMS data analysis. We acknowledge funding from the US National Science Foundation (Grants ATM-0308748, ATM 0449815, and ATM-0528634), NASA (Grant NNG04GA67G), and the US Department of Energy (Office of Biological and Environmental Research (BER), Grant DE-FG02-05ER63981). D. Salcedo acknowledges Consejo Nacional de Ciencia y Tecnolog´ıa (CONACyT - M´exico) for financial support. K. Dzepina is a recipient of an Advanced Study Program Graduate Fellowship from the National Center for Atmospheric Research (NCAR). A. Huffman is grateful for a NASA Earth Science fellowship (grant NGT5-30516). We thank the AMS Users community for many helpful discussions.
Edited by: U. P¨oschl
References
Alfarra, M. R., Coe, H., Allan, J. D., Bower, K. N., Boudries, H., Canagaratna, M. R., Jimenez, J. L., Jayne, J. T., Garforth, A., Li, S. M., and Worsnop, D. R.: Characterization of Urban and Regional Organic Aerosols In the Lower Fraser Valley Using Two Aerodyne Aerosol Mass Spectrometers, Atmos. Environ., 38, 5745–5758, 2004.
Allan, J. D., Alfarra, M. R., Bower, K. N., Coe, H., Jayne, J. T., Worsnop, D. R., Aalto, P. P., Kulmala, M., Hy¨otyl¨ainen, T., Cav-alli, F., and Laaksonen, A.: Size and composition measurements of background aerosol and new particle growth in a Finnish forest during QUEST 2 using an Aerodyne Aerosol Mass Spectrometer, Atmos. Chem. Phys., 6, 315–327, 2006a.
Allan, J. D., Bower, K. N., Coe, H., Boudries, H., Jayne, J. T., Canagaratna, M. R., Millet, D. B., Goldstein, A. H., Quinn, P. K., Weber, R. J., and Worsnop, D. R.: Submicron aerosol composition at Trinidad Head, CA during ITCT 2K2, its re-lationship with gas phase volatile organic carbon and assess-ment of instruassess-ment performance, J. Geophys. Res., 109, D23S24, doi:10.1029/2003JD004208, 2004.
DeCarlo, P. F., Slowik, J. G., Worsnop, D. R., Davidovits, P., and Jimenez, J. L.: Particle Morphology and Density Characteriza-tion by Combined Mobility and Aerodynamic Diameter Mea-surements. Part 1: Theory, Aerosol Sci. Technol., 38, 1185– 1205, doi: 10.1080/027868290903907, 2004.
Delia, A. E.: Real-Time Measurements of Non-Refractory Parti-cle Composition and Interactions at Forested Sites, Ph.D. thesis, University of Colorado, Boulder, CO, 2004.
Drewnick, F., Jayne, J. T., Canagaratna, M. R., Worsnop, D. R., and Demerjian, K. L.: Measurement of Ambient Aerosol Com-position During the PMTACS-NY 2001 Using an Aerosol Mass Spectrometer. Part II: Chemically Speciated Mass Distributions, Aerosol Sci. Technol., 38, 104–117, 2004a.
Drewnick, F., Schwab, J. J., Jayne, J. T., Canagaratna, M. R., Worsnop, D. R., and Demerjian, K. L.: Measurement of Ambient Aerosol Composition During the PMTACS-NY 2001 Using an Aerosol Mass Spectrometer. Part I: Mass concentrations, Aerosol Sci. Technol., 38, 92–103, doi:10.1080/02786820390229507, 2004b.
Hogrefe, O., Schwab, J. J., Drewnick, F., Lala, G. G., Peters, S., Demerjian, K. L., Rhoads, K., Felton, H. D., Rattigan, O. V., Hu-sain, L., and Dutkiewicz, V. A.: Semicontinuous PM2.5Sulfate and Nitrate Measurements at an Urban and a Rural Location in New York: PMTACS-NY Summer 2001 and 2002 Campaigns, J. Air. Waste Manage., 54, 1040–1060, 2004.
Huffman, J. A., Jayne, J. T., Drewnick, F., Aiken, A. C., Onasch, T., Worsnop, D. R., and Jimenez, J. L.: Design, Modeling, Op-timization, and Experimental Tests of a Particle Beam Width Probe for the Aerodyne Aerosol Mass Spectrometer, Aerosol Sci. Technol., 39, 1143–1163, 2005.
Jayne, J. T., Leard, D. C., Zhang, X., Davidovits, P., Smith, K. A., Kolb, C. E., and Worsnop, D. R.: Development of an Aerosol Mass Spectrometer for Size and Composition Analysis of Sub-micron Particles, Aerosol Sci. Technol., 33, 49–70, 2000. Jimenez, J. L., Jayne, J. T., Shi, Q., Kolb, C. E., Worsnop, D. R.,
Yourshaw, I., Seinfeld, J. H., Flagan, R. C., Zhang, X., Smith, K. A., Morris, J., and Davidovits, P.: Ambient aerosol sampling us-ing the Aerodyne Aerosol Mass Spectrometer, J. Geophys. Res., 108, 8425, doi:10.1029/2001JD001213, 2003.
556 D. Salcedo et al.: AMS beam width probe in the field
Johnson, K. S., Zuberi, B., Molina, L. T., Molina, M. J., Iedema, M. J., Cowin, J. P., Gaspar, D. J., Wang, C., and Laskin, A.: Processing of soot in an urban environment: case study from the Mexico City Metropolitan Area, Atmos. Chem. Phys., 5, 3033– 3043, 2005,
http://www.atmos-chem-phys.net/5/3033/2005/.
Kolb, C. E., Herndon, S. C., McManus, J. B., Shorter, J. H., Zah-niser, M. S., Nelson, D. D., Jayne, J. T., Canagaratna, M. R., and Worsnop, D. R.: Mobile Laboratory with Rapid Response In-struments for Real-Time Measurements of Urban and Regional Trace Gas and Particulate Distributions and Emission Source Characteristics, Environ. Sci. Technol., 38, 5694–5703, 2004. Liu, P., Ziemann, P. J., Kittelson, D. B., and McMurry, P. H.:
Gen-erating particle beams of controlled dimensions and divergence. 2. Experimental evaluation of particle motion in aerodynamic lenses and nozzle expansions, Aerosol Sci. Technol., 22, 314– 324, 1995.
Salcedo, D., Onasch, T. B., Dzepina, K., Canagaratna, M. R., Zhang, Q., Huffman, J. A., DeCarlo, P. F., Jayne, J. T., Mor-timer, P., Worsnop, D. R., Kolb, C. E., Johnson, K. S., Zuberi, B., Marr, L. C., Volkamer, R., Molina, L. T., Molina, M. J., Car-denas, B., Bernab´e, R. M., M´arquez, C., Gaffney, J. S., Marley, N. A., Laskin, A., Shutthanandan, V., Xie, Y., Brune, W., Lesher, R., Shirley, T., and Jimenez, J. L.: Characterization of ambient aerosols in Mexico City during the MCMA-2003 campaign with Aerosol Mass Spectrometry: results from the CENICA Super-site, Atmos. Chem. Phys., 6, 925–946, 2006,
http://www.atmos-chem-phys.net/6/925/2006/.
Schwab, J. J., Felton, H. D., Rattigan, O. V., and Demerian, K. L.: New York State Urban and Rural Measurements of Continuous PM2.5 Mass by FDMS, TEOM, and BAM., J. Air. Waste Man-age., 56, 372–383, 2006.
Wang, X., Kruis, F. E., and McMurry, P. H.: Aerodynamic Focus-ing of Nanoparticles: I. Guidelines for DesignFocus-ing Aerodynamic Lenses for Nanoparticles, Aerosol Sci. Technol., 39, 611–623, 2005.
Weimer, S., Drewnick, F., Hogrefe, O., Schwab, J. J., Rhoads, K., Orsini, D., Canagaratna, M. R., Worsnop, D. R., and Demerjian, K. L.: Size-Selective Non-Refractory Ambient Aerosol Measurements during the PMTACS-NY 2004 Winter Intensive in New York City, J. Geophys. Res., 111, D18305, doi:10.1029/2006JD007215, 2006.
Zhang, Q., Alfarra, M. R., Worsnop, D. R., Allan, J. D., Coe, H., Canagaratna, M. R., and Jimenez, J. L.: Deconvolution and Quantification of Hydrocarbon-like and Oxygenated Organic Aerosols Based on Aerosol Mass Spectrometry, Environ. Sci. Technol., 39, 4938–4952, doi:10.1021/es048568l, 2005a. Zhang, Q., Canagaratna, M. R., Jayne, J. T., Worsnop, D. R.,
and Jimenez, J. L.: Time and Size-Resolved Chemical Com-position of Submicron Particles in Pittsburgh. Implications for Aerosol Sources and Processes, J. Geophys. Res., 110, D07S09, doi:10.1029/2004JD004649, 2005b.
Zhang, Q., Worsnop, D. R., Canagaratna, M. R., and Jimenez, J. L.: Hydrocarbon-like and Oxygenated Organic Aerosols in Pitts-burgh: Insights into Sources and Processes of Organic Aerosols, Atmos. Chem. Phys., 5, 3289–3311, 2005c.
Zhang, X., Smith, K. A., Worsnop, D. R., Jimenez, J. L., Jayne, J. T., Kolb, C. E., Morris, J., and Davidovits, P.: Characterization of Particle Beam Collimation. Part II: Integrated Aerodynamic Lens-Nozzle System, Aerosol Sci. Technol., 38, 619–638, 2004.