HAL Id: hal-00297389
https://hal.archives-ouvertes.fr/hal-00297389
Submitted on 4 Jul 2005
HAL is a multi-disciplinary open access
archive for the deposit and dissemination of
sci-entific research documents, whether they are
pub-lished or not. The documents may come from
teaching and research institutions in France or
abroad, or from public or private research centers.
L’archive ouverte pluridisciplinaire HAL, est
destinée au dépôt et à la diffusion de documents
scientifiques de niveau recherche, publiés ou non,
émanant des établissements d’enseignement et de
recherche français ou étrangers, des laboratoires
publics ou privés.
Assessing the potential of SWVI (Soil Wetness Variation
Index) for hydrological risk monitoring by means of
satellite microwave observations
T. Lacava, M. Greco, E. V. Di Leo, G. Martino, N. Pergola, F. Romano, F.
Sannazzaro, V. Tramutoli
To cite this version:
T. Lacava, M. Greco, E. V. Di Leo, G. Martino, N. Pergola, et al.. Assessing the potential of SWVI
(Soil Wetness Variation Index) for hydrological risk monitoring by means of satellite microwave
obser-vations. Advances in Geosciences, European Geosciences Union, 2005, 2, pp.221-227. �hal-00297389�
Advances in Geosciences, 2, 221–227, 2005 SRef-ID: 1680-7359/adgeo/2005-2-221 European Geosciences Union
© 2005 Author(s). This work is licensed under a Creative Commons License.
Advances in
Geosciences
Assessing the potential of SWVI (Soil Wetness Variation Index) for
hydrological risk monitoring by means of satellite microwave
observations
T. Lacava1, M. Greco1,2,3, E. V. Di Leo1, G. Martino2, N. Pergola1, F. Romano1, F. Sannazzaro2, and V. Tramutoli1,2,3 1Istituto di Metodologie per l’Analisi Ambientale – CNR, Tito Scalo (Potenza), Italy
2Dip. di Ingegneria e Fisica dell’Ambiente, Universit`a della Basilicata, Potenza, Italy 3CIMA – Universit`a della Basilicata, Universit`a di Genova, Italy
Received: 14 November 2004 – Revised: 18 April 2005 – Accepted: 20 April 2005 – Published: 4 July 2005
Abstract. In the last years satellite remote sensing
appli-cations in hydrology have considerably progressed. A new multi-temporal satellite data-analysis approach has been re-cently suggested in order to estimate space-time changes of geophysical parameters possibly related to the increase of environmental and hydro-geological hazards. Such an ap-proach has been already used both for flooded area mapping (using AVHRR data) and for soil wetness index estimation (using AMSU data).
In this work, a preliminary sensitivity analysis of the pro-posed Soil Wetness Variation Index (SWVI) is made in the case of low intensity meteorological events by the compari-son with hydrological (precipitation) data. This analysis, as a first step of a more complex work in progress, is targeted to a first evaluation of the reliability of the SWVI in describ-ing soil response to precipitations of different duration and intensity.
1 Introduction
Soil moisture is the key state variable in hydrology: it is the switch that controls the proportion of rainfall that percolates, runs off or evaporates from the land. In particular, the knowl-edge of soil moisture and/or soil wetness is very important for flood prediction systems; runoff generation processes, in fact, are related to antecedent soil moisture conditions, espe-cially regarding the water content at the very soil surface.
Precise in situ measurements of soil moisture are gener-ally sparse and each value is only representative of a limited area. Furthermore, ground-based networks cannot guaran-tee global coverage at sustainable costs. Remote sensing products, if achievable with sufficient accuracy and relia-bility, would provide truly meaningful wide-area soil wet-ness/moisture data for hydrological studies over large
conti-Correspondence to: T. Lacava
(lacava@imaa.cnr.it)
nental regions. Traditional satellite techniques for soil mois-ture monitoring exploit the advantages of microwave sensors data. At these frequencies, in fact, electro-magnetic radia-tion leaving the Earth’s surface is practically not affected by clouds (in the absence of rain), allowing an all-weather and all-time (as the microwave signal is available both during the day and the night) capability of observing the Earth’s surface conditions. Moreover, thanks to the large contrast between dielectric properties of water and dry soil, microwaves are highly sensitive to the water content in the soil (Eagleman and Lin, 1976; Jackson et al., 1981). On the other hand, the estimate of soil moisture by using microwave radiances is strongly influenced by surface roughness and vegetation cover, whose contributions to the measured signal can drasti-cally reduce the sensitivity of the retrieval algorithms for soil moisture (Choudhury et al., 1979; Wang et al., 1983; Jackson and Schmugge, 1989; Schmugge et al., 2002).
An innovative Soil Wetness Variation Index (SWVI) has been recently proposed (Lacava et al., 2004) using data ac-quired by the microwave radiometer AMSU (Advanced Mi-crowave Sounding Unit) which flies aboard NOAA (National Oceanic and Atmospheric Administration) satellites. This in-dex, based on a general approach for multi-temporal satellite data analysis (RAT – Robust AVHRR Techniques, Tramu-toli 1998), seems to be able to overcome (or strongly reduce) the above mentioned limitations. The SWVI has been already applied with good results, both in terms of reliability and sen-sitivity, in the observation of some extreme flooding events which occurred in the past in Europe (Lacava et al., 2005).
In this work, a preliminary SWVI sensitivity analysis is proposed in order to study the relations, in the space-time domain, between the proposed index and precipitations. It should be stressed that this work represents a prelimi-nary stage of a more complex multiphase analysis whose subsequent development will be opened to the comparison with other ancillary information such as land cover maps, litho-geological maps, etc. This analysis has been per-formed for some precipitation events, documented by the
222 T. Lacava et al.: Assessing the potential of SWVI
10
Figure 1
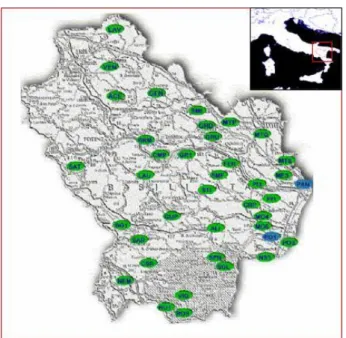
Figure 1: The pilot area: Basilicata region in Southern Italy. In green and in blue are plotted the 40 measurement stations of Agenzia Lucana per lo Sviluppo e l’Innovazione in Agricoltura (ALSIA) measurement network (from http://www.alsia.it/servizi.htm).
Fig. 1. The pilot area: Basilicata region in Southern Italy. In green and in blue are plotted the 40 measurement stations of Agenzia Lu-cana per lo Sviluppo e l’Innovazione in Agricoltura (ALSIA) mea-surement network (from http://www.alsia.it/servizi.htm).
micro-meteorological measurement network of the Agenzia Lucana per lo Sviluppo e l’Innovazione in Agricoltura (AL-SIA), with different intensity and duration, which affected the Basilicata region located in the South Italy.
2 The Soil Wetness Variation Index
The RAT approach is a change-detection scheme which iden-tifies signal anomalies in the space-time domain as deviations from a normal state that has been preliminarily identified (and usually given in terms of time average and standard de-viation of the signal at sensor) on the basis of satellite obser-vations collected during several years, under similar observa-tional conditions, for each image pixel and in the same period of the year. Such an approach has already been successfully applied to several natural and environmental emergencies, such as volcanic eruptions (Pergola et al., 1998, 2001, 2004), forest fires (Cuomo et al., 2001) and earthquakes (Tramutoli et al., 2001; Di Bello et al., 2004; Filizzola et al., 2004). A detailed description of the theoretical background of RAT approach can be found in Tramutoli (1998).
RAT approach has been recently applied for soil wetness variation monitoring (Lacava et al., 2004, 2005). In these works, the proposed index was able to overcome all the above mentioned site effects, not only the ones due to sur-face roughness or vegetation cover, but also those due to the presence of permanent water bodies within the instantaneous field of view (IFOV) of the sensor. The same site observed under the same observational conditions, same month of year and same time of day, in fact, is expected to have the same
roughness and quite similar vegetation cover, so that the pos-sible residual emissivity variations observed can be mainly attributed to moisture variations in the soil (Lacava et al., 2004).
The Soil Wetness Variation Index (SWVI) has been defined as:
SW V I (x, y, t ) = SW I (x, y, t ) − µSW I(x, y) σSW I(x, y)
(1) where: SWI(x,y,t) is the Soil Wetness Index proposed
by Grody (2002)1 that identifies as wet all the pixels in an AMSU image which have values of the difference (SWI=T89 GHz−T23 GHz)between the radiance (expressed in
Brightness Temperature) measured in the AMSU channels 15 (at 89 GHz) and 1 (at 23 GHz), respectively, higher than 5 Kelvin; µSW I(x, y) is its time average and σSW I(x, y)
is the standard deviation describing its natural fluctuations, both computed on a selected multi-annual AMSU imagery data-set, composed only of AMSU data collected during the same month of the year and acquired at around the same hour of the day, according to the RAT prescriptions (Tramutoli 1998). The SWVI(x,y,t) gives, for each pixel (x, y) and time t of observation, the actual SWI excess compared to its unper-turbed conditions, weighted by the normal variability, histor-ically observed under similar observational conditions. The site effects due to surface roughness or vegetation cover as well as to the presence of permanent water bodies within the IFOV, are in this way strongly reduced, as the SWVI(x,y,t) index is solely sensitive to SWI variations (for each place mainly depending on soil moisture) and not to its absolute value (strongly depending instead also on surface roughness and vegetation cover). We expect, then, that higher values of
SWVI(x,y,t) will be associated to the relative increase of soil
wetness at each specific location. More specifically, positive
SWVI values would indicate soil wetter than “normal”
condi-tions. In order to reduce possible false alarms, we have cho-sen to classify as moderately wet (respect to the unperturbed conditions) all those pixels with SWVI values between 2 and 3. Pixels with SWVI values greater than 3 and lower than 4 suggest (anomalous) wet conditions, while those with SWVI values higher than 4 should describe extremely wet condi-tions. However, it should be noted that, being SWVI a qual-itative index describing relative, rather than absolute con-ditions, higher positive SWVI not necessarily identify soils close to the saturation state.
3 The sensitivity analysis
In this work a preliminary sensitivity analysis of the proposed
SWVI is presented. This analysis, performed by the
compari-son of the proposed satellite indicator with hydrological data, will allow us to give a first assessment of the reliability of
SWVI in describing soil response to no-extreme precipitation
events with different duration and intensity.
1Grody, N. C.: An AMSU Soil Wetness Index, (private
T. Lacava et al.: Assessing the potential of SWVI 223
11
Figure 2
Figure 2: Sensitivity analysis for the September 1999 event: a), b), c) SWVI maps respectively for September 12th, 13th and 14th; d), e), f), g) regional cumulative rainfall map for September 11th, 12th, 13th, 14th respectively.
Red dots identify ALSIA network measurement stations. Colour bars show the whole range of fluctuation for each field. All the maps are in the same geographic projection (UTM-WGS84). Note the quite good spatial-temporal correlation between the measured rainfall and the SWVI. Highest SWVI values are in fact present in the image of September 14th after the precipitation fallen in the previous days.
Fig. 2. Sensitivity analysis for the September 1999 event: (a), (b), (c) SWVI maps respectively for 12th, 13th and 14th September; (d), (e), (f), (g) regional cumulative rainfall map for 11th, 12th, 13th, 14th September respectively. Red dots identify ALSIA network measurement stations. Colour bars show the whole range of fluctuation for each field. All the maps are in the same geographic projection (UTM-WGS84). Note the quite good spatial-temporal correlation between the measured rainfall and the SWVI. Highest SWVI values are in fact present in the image of September 14th after the precipitation fallen in the previous days.
The pilot area, represented in Fig. 1, is the Basilicata re-gion in Southern Italy and the hydrological data, provided by the ALSIA rain gauges network which, through 40 mea-surement stations working during 2004, covers the region
at whole. In this work we use only the data coming from 29 measurement stations which, working since 1998, have a more complete temporal overlapping with AMSU histori-cal data-set. AMSU data, in fact, are available since 1998,
224 T. Lacava et al.: Assessing the potential of SWVI when NOAA 15 has been launched. NOAA 15 ensures
two passes per day, one around 5:00 GMT and another one around 17:00 GMT (12 h later). In order to generate refer-ences fields, we considered two different data sets, one in-cluding all the imagery acquired during the morning passes, the other one using the afternoon passes. The images ac-quired during the months of events occurrences have been analysed for the whole period of AMSU data availability (since 1998 up to now) processing, in average, about 240 passes per each event (120 for each data set).
The main idea, in order to perform the sensitivity analysis, is to relate the computed value of SWVI to the observed rain-fall for some precipitation events which have been prelimi-narily selected (the ones occurred in September 1999, April 2001 and November 2002). As a first step of the full analysis (in progress), only a qualitative correlation has been carried out, neglecting, at this stage, other possible input variables (i.e. land cover maps, digital terrain models, etc.) and/or tun-ing parameters (i.e. variable temporal lag, different cumulat-ing periods, etc.) which will be considered in the next phases. Preliminary comparisons have been performed analysing the correlation between the daily (24 h) cumulative rainfall data (used as input for the kriging technique applied to gen-erate the regional daily rainfall map) and the corresponding spatial distribution of the SWVI for each available AMSU im-age acquired the same day. It should be stressed (and taken into account analysing the results) that the SWVI is an instant observation, referred to a specific acquisition time of the day, whereas the rainfall map is considered here as a “daily” ob-servation, obtained cumulating all the available data recorded during the same day.
3.1 Results
Results obtained for the events occurred during 11–14 September 1999, 12–16 April 2001 and 18–19 November 2002 and they are shown in the next figures and discussed in the following.
Figure 2 shows both the maps of SWVI and the regional cumulative rainfall maps referring to September 1999 event. The analysis of the figure highlights a good spatial and tem-poral correlation between the rainfall and the proposed in-dex. The northern part of the region, in fact, is characterized by anomalous values of SWVI which reach their maximum values, both in terms of intensity and spatial distribution, in the image of 14 September, as a direct consequence of the precipitation that affected the area in the previous days (Figs. 2d–g). This is a first indication of the potential of the proposed index because, although the clearly non-extreme nature of the considered precipitation event (both in terms of duration and intensity) the SWVI was sensitive enough to record a significant variation (higher than 3 sigma over the unperturbed values expected for those places in this season) in soil wetness conditions.
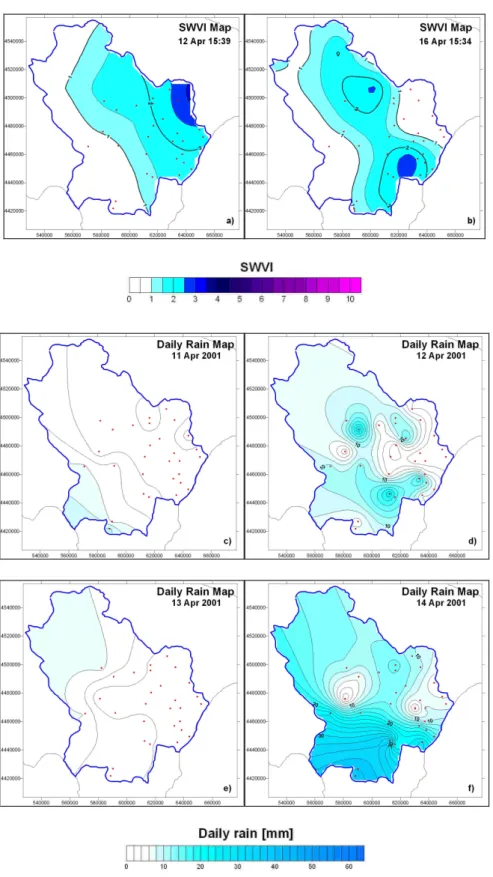
In Fig. 3 the results obtained by the analysis of April 2001 event are shown. Note how, after the precipitation which af-fected the Basilicata region during 11–12 April, high values
of SWVI appear (Fig. 3a). Rainfall interested the whole area in the following days reaching their top on 14 April. In the first AMSU image available after this date (on 16 April), pix-els with anomalous values of SWVI are shown again, appear-ing in quite a good spatial correlation with the actual pre-cipitations. Moreover, it should be stressed, as an additional result that, although the geographical area investigated was greater than the region of interest, no false positive SWVI (false alarms) have been identified in any of the considered AMSU scenes.
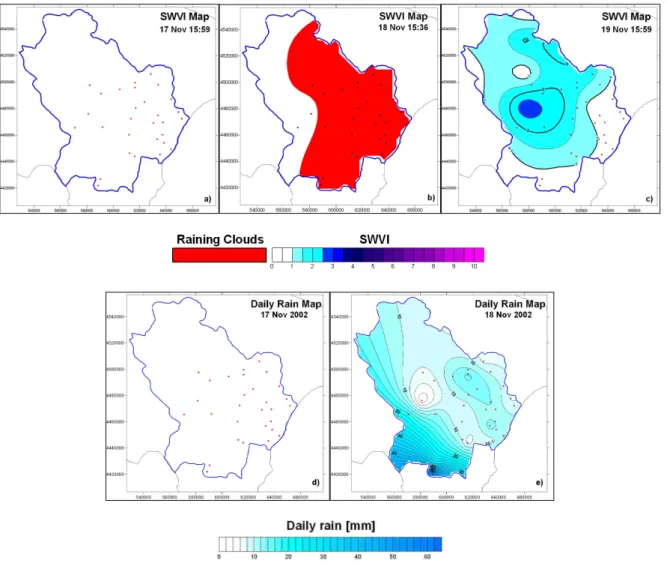
Figure 4 reports the results for the analysis of the Novem-ber 2002 event. In detail, in the figure is shown the response of SWVI for 17 November, just before the storm occurred the day after (18 November), outlining an almost “dry” condition of the area confirmed also by the absence of significant rain-fall (Fig. 4d). Looking at Fig. 4b, which refers to the AMSU scene of 18 November, is clearly detected the presence of a raining cloud system located over Basilicata region (identi-fied by a screening test proposed by Grody et al. (2000) using AMSU data), confirmed by the investigation of rain-gauge network data as well (Fig. 4e reveals a significant storm oc-curred on 18 November) In the SWVI map of 19 November (Fig. 4c) a lightly perturbed condition for SWVI within the investigated area is shown, confirming once more the timely sensitivity of the proposed index to the preceding rainfall.
In conclusion, the preliminary results obtained in this work, although they need further assessments over extended sets of events, seem to confirm that also no-extreme precip-itation events, confined in time and space, like those above described may produce a significant response of the SWVI which shows, then, quite a good sensitivity to such events as well. Moreover, this work represents a further confirma-tion of the reliability of the proposed index which, in all the three considered study cases, resulted completely false alarms-proof.
4 Conclusions
In this paper, preliminary results of a sensitivity analysis of a new satellite surface wetness index (the SWVI) are presented. The SWVI, generated by a multi-temporal analysis of AMSU data, has been already applied with encouraging results to the observations of some flooding events occurred in the past in Europe. The qualitative sensitivity analysis, performed in this work by comparison with rain gauge data obtained by a dense ground network located in Basilicata Region (Southern Italy), allow us to give a first assessment of the capabilities of the SWVI in describing soil response to precipitations of different duration and intensity.
The first results achieved in this work, obtained by means of a correlation analysis with precipitation data during some minor raining events occurred in Basilicata region, encour-age to continue research in this field, suggesting the possibil-ity to employ the SWVI as a further parameter to be used in the prediction chain devoted to the mitigation of the hydro-logical risk.
T. Lacava et al.: Assessing the potential of SWVI 225
12
Figure 3
Figure 3: Sensitivity analysis for the April 2001 event: a), b) SWVI maps for April 12th, 16th; c), d), e), f)
regional cumulative rainfall map respectively for April 11th,12th,13th,14th. Red dots identify ALSIA network
measurement stations. Colour bars show the whole range of fluctuation for each field. All the maps are in the same geographic projection (UTM-WGS84). The whole region was affected by rainfall mainly on 12 and 14 April 2001, consequently anomalous SWVI values appear in the images of April 12th and 16th.
Fig. 3. Sensitivity analysis for the April 2001 event: (a), (b) SWVI maps for 12th, 16th April; (c), (d), (e), (f) regional cumulative rainfall map respectively for 11th, 12th, 13th, 14th April. Red dots identify ALSIA network measurement stations. Colour bars show the whole range of fluctuation for each field. All the maps are in the same geographic projection (UTM-WGS84). The whole region was affected by rainfall mainly on 12 and 14 April 2001, consequently anomalous SWVI values appear in the images of 12th and 16th April.
226 T. Lacava et al.: Assessing the potential of SWVI
13
Figure 4
Figure 4: Sensitivity analysis for the November 2002 event: a), b), c) SWVI maps for November 17th, 18th and 19th; d), e) regional cumulative rainfall map for November 17th and 18th respectively. Red dots identify ALSIA
network measurement stations. Colour bars show the whole range of fluctuation for each field. All the maps are in the same geographic projection (UTM-WGS84). In figure 4b, the soil is masked by the raining clouds affecting the region (they have been identify by a screening test proposed by Grody et al., 2000, see text). Note as after the intense precipitation fallen during November 18th, intense SWVI values consequently appear (on the
November 19th map).
Fig. 4. Sensitivity analysis for the November 2002 event: (a), (b), (c) SWVI maps for 17th, 18th and 19th November; (d), (e) regional cumulative rainfall map for 17th and 18th November respectively. Red dots identify ALSIA network measurement stations. Colour bars show the whole range of fluctuation for each field. All the maps are in the same geographic projection (UTM-WGS84). In Fig. 4b, the soil is masked by the raining clouds affecting the region (they have been identify by a screening test proposed by Grody et al. (2000), see text). Note as after the intense precipitation fallen during 18th November, intense SWVI values consequently appear (on the 19th November map).
In the next future, a switch from a qualitative sensitivity analysis to a quantitative study, already planned, will give us more reliable and detailed indications. This will be achieved by means of a point-to-point 2-D correlation analysis, car-ried out giving more importance to other local input data, like land cover maps, litho-geological data, digital terrain model. Moreover, additional tuning parameters will be taken into ac-count, as for instance variable temporal lags and different cu-mulating periods, in order to better assess the actual potential of the proposed indicator for a reliable, timely and efficient monitoring of soil wetness which, although its crucial role, still remains one of the main missing information.
Edited by: L. Ferraris
Reviewed by: anonymous referees
References
Agenzia Lucana di Sviluppo e di Innovazione in Agricoltura, http: //www.alsia.it/, 2000.
Choudhury, B. J., Schmugge, T. J., Chang, A., and Newton, R. W.: Effects of Surface Roughness on the Microwave Emission from Soil, J. Geophys. Res., 84 (C9), 5699–5706, 1979.
Cuomo, V., Lasaponara, R., and Tramutoli, V.: Evaluation of a new satellite-based method for forest fire detection, Int. J. Rem. Sens., 22 (9), 1799–1826, 2001.
Di Bello, G., Filizzola, C., Lacava, T., Marchese, F., Pergola, N., Pietrapertosa, C., Piscitelli, S., Scaffidi, I., and Tramutoli, V.: Robust Satellite Techniques for Volcanic and Seismic Hazards, Annals of Geophysics, 47 (1), 49–64, 2004.
Eagleman, J. R. and Lin, W. C.: Remote Sensing of Soil Mois-ture by a 21-cm Passive Radiometer, J. Geophys. Res., 81, 3660– 3666, 1976.
Filizzola, C., Pergola, N., Pietrapertosa, C., and Tramutoli, V.: Ro-bust satellite techniques for seismically active areas monitoring:
T. Lacava et al.: Assessing the potential of SWVI 227 a sensitivity analysis on September 7th 1999 Athens’s
earth-quake, Special issue on Seismo Electromagnetics and Related Phenomena, Phys. Chem. Earth, 29 (4–9), 517–527, 2004. Grody, N. C., Weng, F., and Ferraro, R. R.: Application of AMSU
for hydrological parameters, in: Microwave radiomemetry and remote sensing of the earth’s surface and atmosphere, edited by: Pampaloni, P. and Paloscia, S., VSP, The Netherlands, 339–352, 2000.
Jackson, T. J., Schmugge, T. J., Nicks, A. D., Coleman, G. A., and Engman, E. T.: Soil Moisture Updating and Microwave Re-mote Sensing for Hydrological Simulation, Hydrological Sci-ences Bulletin, 26 (3), 305–319, 1981.
Jackson, T. J. and Schmugge, T. J.: Passive Microwave Remote Sensing System for Soil Moisture: Some Supporting Research, IEEE Trans. Geosci. Rem. Sens., 27, 225–235, 1989.
Lacava, T., Di Leo, E. V., Pergola, N., Romano, F., Sannazzaro, F., and Tramutoli, V.: Analysis Of Multi-Temporal Satellite Records For Extreme Flooding Events Monitoring, Proceedings of the 5th EGS Plinius Conference held at Ajaccio, Corsica, France, Octo-ber 2003, edited by: Testud, J., Mugnai, A., and Santucci, J. F., 231–237, 2004.
Lacava, T., Cuomo, V., Di Leo, E. V., Pergola, N., Romano, F., and Tramutoli, V.: Improving soil wetness variations monitoring from passive microwave satellite data: the case of April 2000 Hungary flood, Rem. Sens. Environ., accepted, 2005.
Pergola, N., Pietrapertosa, C., and Tramutoli, V.: Satellite Remote Sensing of Volcanic Aerosol: a new, AVHRR-based, approach, Satellite Remote Sensing of Clouds and Atmosphere III, edited by: Russel, J. E., Proceedings of SPIE, 3495, 188–197, 1998. Pergola, N., Pietrapertosa, C., Lacava, T., and Tramutoli, V.: Robust
Satellite Techniques for Volcanic Eruptions Monitoring, Annals of Geophysics, 44 (2), 167–177, 2001.
Pergola, N., Lacava, T., Marchese, F., Scaffidi, I, and Tramutoli, V.: Improving volcanic ash cloud detection by a robust satellite technique, Rem. Sens. Env., 90, 1–22, 2004.
Schmugge, T. J., Kustas, W. P, Ritchie, J. C., Jackson, T. J., and Rango, A: Remote Sensing in hydrology, Adv. Water Res., 25, 1367–1385, 2002.
Tramutoli, V.: Robust AVHRR Techniques (RAT) for Environmen-tal Monitoring theory and applications, in: Earth Surface Remote Sensing II, edited by: Cecchi, G. and Zilioli, E., SPIE 3496, 101– 113, 1998.
Tramutoli, V., Di Bello, G., Pergola, N., and Piscitelli, S.: Robust Satellite Techniques for Remote Sensing of Seismically Active Areas, Annals of Geophysics, 44 (2), 295–312, 2001.
Wang, J. R., O’Neill, P. E., Jackson, T. J., and Engman, E. T.: Multifrequency Measurements of the effects of Soil Moisture, Soil Texture and Surface Roughness, IEEE Trans. Geosci. Rem. Sens., GE-21(1), 44–51, 1983.