HAL Id: hal-02901451
https://hal-amu.archives-ouvertes.fr/hal-02901451
Submitted on 15 Sep 2020
HAL is a multi-disciplinary open access
archive for the deposit and dissemination of
sci-entific research documents, whether they are
pub-lished or not. The documents may come from
teaching and research institutions in France or
abroad, or from public or private research centers.
L’archive ouverte pluridisciplinaire HAL, est
destinée au dépôt et à la diffusion de documents
scientifiques de niveau recherche, publiés ou non,
émanant des établissements d’enseignement et de
recherche français ou étrangers, des laboratoires
publics ou privés.
Distributed under a Creative Commons Attribution - NonCommercial| 4.0 International
License
confocal microscopy
Md Rasedujjaman, Kévin Affannoukoué, Nicolas Garcia-Seyda, Philippe
Robert, Hugues Giovannini, Patrick C. Chaumet, Olivier Theodoly,
Marie-Pierre Valignat, Kamal Belkebir, Anne Sentenac, et al.
To cite this version:
Md Rasedujjaman, Kévin Affannoukoué, Nicolas Garcia-Seyda, Philippe Robert, Hugues Giovannini,
et al.. Three-dimensional imaging with reflection synthetic confocal microscopy. Optics Letters,
Optical Society of America - OSA Publishing, 2020, 45 (13), pp.3721-3724. �10.1364/OL.397364�.
�hal-02901451�
Three-dimensional imaging with reflection synthetic
confocal microscopy
M
DR
ASEDUJJAMAN1, K
ÉVINA
FFANNOUKOUÉ1, N
ICOLASG
ARCIA-S
EYDA2, P
HILIPPER
OBERT2,
H
UGUESG
IOVANNINI1, P
ATRICKC. C
HAUMET1, O
LIVIERT
HEODOLY2, M
ARIE-P
IERREV
ALIGNAT2,
K
AMALB
ELKEBIR1, A
NNES
ENTENAC1,
ANDG
UILLAUMEM
AIRE1,*1Aix Marseille Univ, CNRS, Centrale Marseille, Institut Fresnel, Marseille, France
2Laboratoire Adhesion et Inflammation, UMR INSERM 1067, UMR CNRS 7333, Aix-Marseille Université, Assistance Publique–Hôpitaux de Marseille, Case
937, 13288 Marseille Cedex 09, France
*Corresponding author: [email protected]
Compiled May 29, 2020
Biomedical imaging lacks label free microscopy tech-niques able to reconstruct in 3D and with high reso-lution the contour of biological cells in soreso-lution, as re-quired for the fast diagnosis of numerous diseases. In-spired by computational OCT techniques, we present a tomographic diffractive microscope in reflection geom-etry used as a synthetic confocal microscope, compati-ble with this goal and validated with the 3D reconstruc-tion of a human effector T lymphocyte. © 2020 Optical Society of America
http://dx.doi.org/10.1364/ao.XX.XXXXXX
1. INTRODUCTION
Optical diffraction microscopy is an important tool in biological and biomedical imaging as it can be used on live cells and does not require staining. Yet, its poor axial resolution compared to the transverse one limits its interest for three-dimensional imaging. Now, an increasing number of applications would benefit from highly resolved 3D images of cells. In particular, the ability to observe the contour deformation of two interacting cells is of major interest as conformational changes can be the
precursor of important biological phenomena [1].
Presently, the best resolved marker-free 3D images of cells have been obtained using computational Tomographic Diffrac-tion Microscopy (TDM). It consists in reconstructing digitally the sample contrast from a stack of holograms obtained by in-terferometry under different illuminations (usually provided
by a monochromatic collimated beam with varying angles) [2].
With such a data set, it is possible to form a 3D image with a resolution typically twice better than the standard microscopy techniques.
However, most of the studies in TDM have been performed with set-ups in transmission [2–8], which eases the volume re-construction of the sample, but ends up with an axial resolution remaining at least three times worse than the transverse one. As a result, 3D conformation changes at cell membranes or inter-faces in the wavelength range cannot be resolved.
To image the cell contour in 3D, the reflection geometry, which is highly sensitive to reflections from interfaces but not to slowly varying volume inhomogeneities, may be more appropri-ate [9]. In biomedical imaging, this geometry is mainly
encoun-tered in Optical Coherence Tomography (OCT) [10], where the
axial resolution, of at best one micron, remains insufficient to detect sub-micrometer axial deformation such as those encoun-tered in lymphocyte activation [1]. In this context, reflection TDM, with its theoretical twice better resolution [11], seems an interesting solution.
So far, this computational approach has been applied to image thin structures deposited or etched on a reflective substrate [12–
16], and to obtain 2D reflectance images of cells [? ]. Combined with broad band illumination, it was also used to image reflec-tive targets under a thick diffusive layer [17,18] and biological tissues at different depths [19,20], the digital reconstruction allowing an efficient removal of the multiple scattering and aber-rations deteriorating the images of standard OCT.
In this paper, we apply reflection TDM to the 3D imaging of cells. We show how a TDM set-up can be used as a synthetic confocal microscope (SyCM) and we take advantage of this computational approach to correct the focus aberrations induced by the use of a high numerical aperture oil-immersion objective (NA=1.49). We compare reflection and transmission TDM on simulated data and provide experimental images of calibrated and biological samples.
2. LINKS BETWEEN TOMOGRAPHIC DIFFRACTIVE MI-CROSCOPY AND CONFOCAL MIMI-CROSCOPY
TDM permits to retrieve the 3D map of refractive index of a sam-ple from the measurement of its scattered field under various illumination angles, using a numerical reconstruction procedure. A sensitivity to refractive index contrasts below 0.01 is typically attained [5–8]. Usually the field is measured in a plane conju-gated to the sample, and then transferred to the far-field (Fourier space) with a 2D discrete Fourier transform to ease the data treatment steps.
The simplest link between the sample refractive index map and the scattered field is obtained under the Born
approxima-trast [2]. In this case, in the scalar approximation, the field
scattered in far-field along wave vector ksfor an illumination
plane wave along wave vector kiis given by
Es(ks, ki)∝ ˜∆ε(ks−ki), (1)
where ˜∆ε is the 3D Fourier transform of the permitivitty contrast ∆ε of the sample (the permittivity being the refractive index squared). The reconstructed permittivity contrast∆εrecat
posi-tion r is thus directly obtained by a 3D discrete inverse Fourier transform : ∆εrec(r)∝
∑
ki∑
ks Es(ks, ki)ei(ks−ki)·r. (2)Such a procedure is also known as synthetic aperture genera-tion: each illumination angle permits to access different Fourier components of the object, and combining them enlarges the accessible domain and improves the resolution.
Synthetic aperture generation is in fact equivalent to phase confocal imaging in which a beam is focused inside the sample and the scattered field is detected (with an interferometric set-up, as in OCT) at the conjugated position, in the image plane, of the focus position [18].
This equivalence can be understood by recalling that scatter-ing is a linear process, the field scattered by a sample illuminated by a beam made of a sum of plane waves is equal to the sum of the scattered fields for each plane wave. Hence, assuming that the phase of all the incident plane waves is 0 at the focal point of the objective, corresponding to the origin of the coordinate system r=0,
˜e(ks, r) =
∑
ki
Es(ks, ki)e−iki·r (3)
represents the far field scattered in the ksdirection obtained
when the sample is illuminated by a beam made of a sum of plane waves interfering constructively at r. Then,
E(r) =
∑
ks
˜e(ks, r)eiks·r, (4)
represents the field at r in the image domain of the microscope (with magnification 1) obtained from the far-field ˜e [21]. It corre-sponds to the complex field that would be measured at the center of the pinhole of a confocal microscope. Introducing Eq. (3) in Eq. (4), one observes that the complex field E is proportional to
∆εrecunder Born approximation,
E(r) =
∑
ki
∑
ks
Es(ks, ki)ei(ks−ki)·r∝ ∆εrec(r). (5)
Works in optical imaging based on synthetic aperture usu-ally calculate the real and imaginary parts of Eq. (5) to obtain the refractive index and absorption maps of their samples. In fact calculating its intensity and phase is also meaningful, as they represent the squared modulus and the argument of the re-flectance (or transmittance) of a focused beam scanned through the sample. We call this approach synthetic confocal microscopy (SyCM), which we consider more general than synthetic aper-ture generation, since optimized phase or amplitude terms can be inserted in Eqs. (3) and (4) to reshape numerically the illumi-nation and detection of the microscope, as is done with Spatial Light Modulators in adaptive optics, and proposed in
smart-OCT [18]. In particular, this computational approach allows
dex mismatch at the glass-water interface of our experimental configuration, where an oil-immersion microscope objective of NA=1.49 is used for maximizing the axial and transverse resolu-tion. This procedure will be detailed in part 4.
3. NUMERICAL RESULTS
To show the interest of reflection SyCM, we first apply it to syn-thetic 3D objects: two portions of spheres of refractive index 1.38 in water. The axial cuts of the samples are depicted in Figs. 1(a)
and (b). In Fig.1(a) the top sphere touches the bottom one,
whereas in Fig.1(b) it enters the bottom one. These two configu-rations illustrate, with simple geometries, a T cell (top sphere) interacting with an antigen presenting cell (bottom sphere): in (a) the T cell is not activated, whereas in (b) it is activated [1].
0.2 0.4 0.6 0.8 1 (d) 2μm 1.33 1.34 1.35 1.36 1.37 1.38 (b) 1.33 1.34 1.35 1.36 1.37 1.38 2μm (a) 2μm (b) 2μm 0.2 0.4 0.6 0.8 1 (f) 2μm 0.2 0.4 0.6 0.8 1 (e) 2μm 0.2 0.4 0.6 0.8 1 (c) 2μm
Fig. 1.(a) and (b): Axial cuts of two configurations mimicking two interacting cells (refractive index in colorbar). (c) and (d): respective SyCM intensity reconstructions in transmission geometry; (e) and (f) in reflection geometry. Reconstructions are normalized to 1 at their maximal value.
A home made program based on the Coupled Dipole Method (CDM) [22] estimated the scattered fields Es(ks, ki)of these two
configurations by solving rigorously Maxwell equations. 121 linearly polarized plane waves were used for the illumination, with maximal polar angle of 55◦, and a numerical aperture of 1.2 in water was assumed for detection. We chose an imaging con-figuration in which the incident and scattered transverse wave vectors laid on a regular two-dimensional grid. Calculations were performed in transmission and reflection.
The 3D intensity|E(r)|2, Eq. (5), was estimated plane by
plane using 2D inverse Fourier transforms, as in [23]. In
Figs.1(c) and (d) the reconstructions obtained in transmission
show no difference between the two cell-cell configurations. In contrast, the contour of the objects can be retrieved with high fidelity with data in reflection (Figs. 1(e) and (f)). This highlights the great potential of reflection SyCM to probe the surfaces and interfaces of biological cells.
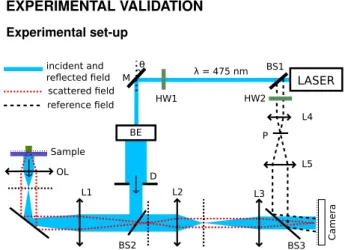
4. EXPERIMENTAL VALIDATION A. Experimental set-up LASER Camer a Sample incident and reflected field scattered field reference field M D HW1 HW2 BS1 BS3 BS2 L1 L2 L3 L4 L5 P OL θ λ = 475 nm BE
Fig. 2.Reflection TDM set-up: M, rotating mirror; BE, beam
expander; D, diaphragm; OL, objective lens; L1, tube-lens;
L2−5, lenses; BS1−3, beamsplitters; HW1−2, half-waveplates; P,
pinhole
We built a TDM set-up in reflection geometry sketched on
Fig.2. Detailed description can be found elsewhere [15]. The
light source is a supercontinuum laser (NKT Photonics SuperK Extreme EXW-12) filtered at 475 nm with a spectral width of 6 nm thanks to a variable bandpass filter (NKT Photonics SuperK Varia). The laser beam is linearly polarized, its illumination angle controlled by a fast steering mirror (M, Newport FSM–300). The scattered field is collected by an oil-immersion objective (Nikon-TIRF 100X, NA = 1.49) and imaged on a sCMOS camera (Andor Zyla) with a global magnification of about 200.
For samples like biological cells in water, the back-scattered signal is very weak. Depending on the illumination angle, par-asitic reflections from the tube lens and the objective can be of the same order as the useful signal. The use of a low coherence source for the off-axis holography permits to wash away these parasitic reflections: here, the coherence length is about 40 µm, much shorter than the distance between the sample and the parasitic reflective surfaces.
B. Phase normalization procedure of the data set
All the reconstruction procedures in TDM consider that the dif-ferent incident plane waves used to illuminate the sample have the same null phase at the chosen origin of the coordinate system. This origin is usually taken at the focal point of the objective. But the mechanical and thermal drifts between successive illumina-tions introduce random phase shifts to each incident plane wave. A phase normalization procedure is therefore crucial to correct the data so that the phases of each illumination plane wave can be considered null at the origin. Then, forming a synthetic beam that focuses at any position is simple algebra.
This normalization is based on the complex amplitude of the far field in the specular reflected direction for each hologram. It
corresponds to the reflection of the incident beam at the glass-water interface and appears as a Dirac-like peak in the Fourier plane of the microscope. We assume that this reflection is not affected by the sample. The whole signal is corrected so that the experimental specular reflection corresponds to its theoretical value. Contrarily to the transmission coefficient which is gener-ally always close to one, the theoretical reflection coefficient can be easily calculated only if the glass-water interface is placed at the object focal plane (conjugated to the camera plane): it will then be equal to the Fresnel formula. However it is seldom the case, especially if the sample is thick. In this case, the optical path of the specular reflection towards the camera, and therefore the phase of the theoretical reflection coefficient, will strongly depend on the unknown distance d between these two planes and on the illumination angle. To avoid this issue, we numeri-cally propagate the fields to reach the glass-water interface. d is estimated from a three dimensional image that is insensitive to illumination phase errors and corresponds to a 3D incoherent brightfield image: I(r) =
∑
ki∑
ks Es(ks, ki)eiks·r 2 . (6)Even though less resolved than the synthetic confocal reconstruc-tion, the 3D brightfield image I permits to detect the interface with enough accuracy for the phase normalization to be satisfac-tory.
C. Experimental reconstructions
SyCM was tested experimentally on a calibrated sample made of a glass bead of diameter 5 µm and refractive index 1.46 (Bangs laboratories), deposited on a glass lamella and immersed in
wa-ter. Figure3shows reconstructions obtained from simulated
(a) and experimental (c) data. We observe that they are very similar, the slight differences can be attributed to discrepancies between the optical transfer function of the objective and the
ideal one assumed for the simulations. Figure3(b) shows the
distorted reconstruction obtained when the phase normalization is done without propagating the fields to the glass-water inter-face. It points out the importance of this procedure, even for small values of d (which, in this case, was estimated to 1.1 µm).
Fig. 3.Axial cuts of SyCM intensity reconstructions for a glass bead immersed in water: synthetic data (a), experimental data without (b) and with (c) the correct phase normalization. Col-orscale has been readjusted on (c) for visualization purpose.
Note that the reconstructions are performed in darkfield mode, by filtering out the specular reflection in the Fourier space for each hologram. As a result, the glass-water interface cannot be seen. This is an important advantage over classical confocal microscopy, as this interface produces a strong signal that masks that scattered by the sample and corrupts the 3D reconstruction. Another advantage is that the 2D angular scans in SyCM (121 il-lumination angles here) can be performed in a quicker way than
more than 105positions required).
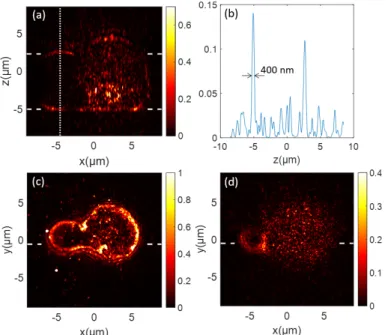
Next, we tested the ability of SyCM to image a biological cell. We considered human effector T lymphocytes, deposited on a glass lamella coated with adhesion molecules ICAM-1, then fixed by a treatment with paraformaldehyde at 4%. Effector T cells migrate on ICAM-1 substrates with a strongly polarized shape. Their central and front parts are strongly adherent and spread, while their rear part forms a partially detached tail, called uropod [24].
Fig. 4.Reflection SyCM intensity reconstruction of a human effector T lymphocyte: (a) axial cut along dashed green seg-ments of (c); (b) intensity profile along vertical dotted green line of (a); (c) and (d) transverse cuts along green dashed
seg-ments of (a) at z = −5 µm (glass interface position), and at
z=2.3 µm, respectively. Colorscale has been readjusted on (a)
and (d) for visualization purpose.
Figure4shows the 3D reconstruction obtained on one of such
T cells: the central body on the right and the uropod on the left can be clearly identified. The central body appears filled with numerous inhomogeneities in comparison with the uropod. This can be explained by the fact that the central body contains the nucleus where highly compacted DNA is bound to produce refractive index changes stronger than anywhere else in the cell. The bottom and top membranes of the cell are also clearly retrieved on the axial cut Fig.4(a), showing the high sectioning capability of reflection SyCM. An axial resolution about 400 nm can be evaluated from the full width at half maximum of the signal profile Fig.4(b) when crossing these membranes, close to the effective wavelength of illumination of 357 nm in water.
5. CONCLUSION
In conclusion, we have shown that tomographic diffractive microscopy in reflection can be used to provide 3D images of cells that are complementary to that obtained in the more classical transmission configuration. Our TDM set-up was used as a synthetic confocal microscope in which the incident plane waves are combined numerically to form a synthetic
approach permitted to correct easily the focus aberrations induced by the index mismatch between the oil objective (NA=1.49) and the mounting medium (water). It was able to image the top and bottom membrane of cells with an axial resolution about 400 nm. This result is promising for biomedical applications where contours of biological cells have to be monitored, like for T cells activation detection. As a next step, the quantitative iterative reconstruction scheme used in [15] will be adapted to cells to retrieve their permittivity maps. This project has received funding from the European Union’s Marie Skłodowska-Curie grant agreement No713750, the Regional Council of Provence-Alpes-Côte d’Azur and Aix-Marseille University A*MIDEX (n° ANR-11-IDEX-0001-02).
Disclosures.The authors declare no conflicts of interest.
REFERENCES
1. A. Grakoui, S. K. Bromley, C. Sumen, M. M. Davis, A. S. Shaw, P. M. Allen, and M. L. Dustin, Science285, 7 (1999).
2. V. Lauer, J. Microsc. p. 12 (2002).
3. M. Debailleul, B. Simon, V. Georges, O. Haeberlé, and V. Lauer, Meas. Sci. Technol.19, 074009 (2008).
4. M. Debailleul, V. Georges, B. Simon, R. Morin, and O. Haeberlé, Opt. Lett.34, 79 (2009).
5. K. Kim, K. S. Kim, H. Park, J. C. Ye, and Y. Park, Opt. Express21,
32269 (2013).
6. U. S. Kamilov, I. N. Papadopoulos, M. H. Shoreh, A. Goy, C. Vonesch, M. Unser, and D. Psaltis, Optica2, 517 (2015).
7. K. Lee, K. Kim, G. Kim, S. Shin, and Y. Park, Opt. Lett.42, 999 (2017).
8. J. Lim, A. B. Ayoub, E. E. Antoine, and D. Psaltis, Light. Sci. Appl.8
(2019).
9. A. Sentenac and J. Mertz, J. Opt. Soc. Am. A35, 748 (2018).
10. A. Dubois, K. Grieve, G. Moneron, R. Lecaque, L. Vabre, and C. Boc-cara, Appl. Opt.43, 2874 (2004).
11. O. Haeberlé, K. Belkebir, H. Giovaninni, and A. Sentenac, J. Mod. Opt.
57, 686–699 (2010).
12. S. A. Alexandrov, T. R. Hillman, T. Gutzler, and D. D. Sampson, Phys. Rev. Lett.97 (2006).
13. V. Mico, Z. Zalevsky, P. García-Martínez, and J. García, J. Opt. Soc. Am. A23, 3162 (2006).
14. G. Maire, Y. Ruan, T. Zhang, P. C. Chaumet, H. Giovannini, D. Sentenac, A. Talneau, K. Belkebir, and A. Sentenac, J. Opt. Soc. Am. A30, 2133
(2013).
15. C. Godavarthi, T. Zhang, G. Maire, P. C. Chaumet, H. Giovannini, A. Talneau, K. Belkebir, and A. Sentenac, J. Opt. Soc. Am. A32, 287
(2015).
16. H. Liu, J. Bailleul, B. Simon, M. Debailleul, B. Colicchio, and O. Hae-berlé, Appl. Opt.53, 748 (2014).
17. T. Gutzler, T. R. Hillman, S. A. Alexandrov, and D. D. Sampson, Opt. Lett.35, 1136 (2010).
18. S. Kang, S. Jeong, W. Choi, H. Ko, T. D. Yang, J. H. Joo, J.-S. Lee, Y.-S. Lim, Q.-H. Park, and W. Choi, Nat. Photonics9, 253–258 (2015).
19. A. Badon, D. Li, G. Lerosey, A. C. Boccara, M. Fink, and A. Aubry, SCIENCE ADVANCES p. 9 (2016).
20. Y.-Z. Liu, F. A. South, Y. Xu, P. S. Carney, and S. A. Boppart, Biomed. Opt. Express8, 1549 (2017).
21. M. Kim, Y. Jo, J. H. Hong, S. Kim, S. Yoon, K.-D. Song, S. Kang, B. Lee, G. H. Kim, H.-C. Park, and et al., Nat. Commun.10 (2019).
22. S. Khadir, P. C. Chaumet, G. Baffou, and A. Sentenac, J. Opt. Soc. Am. A36, 478 (2019).
23. P. C. Chaumet, A. Sentenac, and A. Rahmani, Phys. Rev. E70 (2004).
24. P. C. Chaumet, A. Sentenac, and T. Zhang, J. Quant. Spectrosc. Radiat. Transf.243, 106816 (2020).
25. M.-P. Valignat, P. Nègre, S. Cadra, A. C. Lellouch, F. Gallet, S. Hénon, and O. Theodoly, Nat. Commun.5 (2014).
REFERENCES
1. A. Grakoui, S. K. Bromley, C. Sumen, M. M. Davis, A. S. Shaw, P. M. Allen, and M. L. Dustin, “The immunological synapse: A molecular machine controlling t cell activation,” Science.285, 7 (1999).
2. V. Lauer, “New approach to optical diffraction tomography yielding a vector equation of diffraction tomography and a novel tomographic microscope,” J. Microsc. p. 12 (2002).
3. M. Debailleul, B. Simon, V. Georges, O. Haeberlé, and V. Lauer, “Holo-graphic microscopy and diffractive microtomography of transparent samples,” Meas. Sci. Technol.19, 074009 (2008).
4. M. Debailleul, V. Georges, B. Simon, R. Morin, and O. Haeberlé, “High-resolution three-dimensional tomographic diffractive microscopy of transparent inorganic and biological samples,” Opt. Lett.34, 79 (2009).
5. K. Kim, K. S. Kim, H. Park, J. C. Ye, and Y. Park, “Real-time visu-alization of 3-d dynamic microscopic objects using optical diffraction tomography,” Opt. Express21, 32269 (2013).
6. U. S. Kamilov, I. N. Papadopoulos, M. H. Shoreh, A. Goy, C. Vonesch, M. Unser, and D. Psaltis, “Learning approach to optical tomography,” Optica2, 517 (2015).
7. K. Lee, K. Kim, G. Kim, S. Shin, and Y. Park, “Time-multiplexed struc-tured illumination using a dmd for optical diffraction tomography,” Opt. Lett.42, 999 (2017).
8. J. Lim, A. B. Ayoub, E. E. Antoine, and D. Psaltis, “High-fidelity optical diffraction tomography of multiple scattering samples,” Light. Sci. Appl.
8 (2019).
9. A. Sentenac and J. Mertz, “Unified description of three-dimensional optical diffraction microscopy: from transmission microscopy to optical coherence tomography: tutorial,” J. Opt. Soc. Am. A35, 748 (2018).
10. A. Dubois, K. Grieve, G. Moneron, R. Lecaque, L. Vabre, and C. Boc-cara, “Ultrahigh-resolution full-field optical coherence tomography,” Appl. Opt.43, 2874 (2004).
11. O. Haeberlé, K. Belkebir, H. Giovaninni, and A. Sentenac, “Tomo-graphic diffractive microscopy: basics, techniques and perspectives,” J. Mod. Opt.57, 686–699 (2010).
12. S. A. Alexandrov, T. R. Hillman, T. Gutzler, and D. D. Sampson, “Syn-thetic aperture fourier holographic optical microscopy,” Phys. Rev. Lett.
97 (2006).
13. V. Mico, Z. Zalevsky, P. García-Martínez, and J. García, “Synthetic aperture superresolution with multiple off-axis holograms,” J. Opt. Soc. Am. A23, 3162 (2006).
14. G. Maire, Y. Ruan, T. Zhang, P. C. Chaumet, H. Giovannini, D. Sentenac, A. Talneau, K. Belkebir, and A. Sentenac, “High-resolution tomographic diffractive microscopy in reflection configuration,” J. Opt. Soc. Am. A
30, 2133 (2013).
15. C. Godavarthi, T. Zhang, G. Maire, P. C. Chaumet, H. Giovannini, A. Talneau, K. Belkebir, and A. Sentenac, “Superresolution with full-polarized tomographic diffractive microscopy,” J. Opt. Soc. Am. A32,
287 (2015).
16. H. Liu, J. Bailleul, B. Simon, M. Debailleul, B. Colicchio, and O. Hae-berlé, “Tomographic diffractive microscopy and multiview profilometry with flexible aberration correction,” Appl. Opt.53, 748 (2014).
17. T. Gutzler, T. R. Hillman, S. A. Alexandrov, and D. D. Sampson, “Co-herent aperture-synthesis, wide-field, high-resolution holographic mi-croscopy of biological tissue,” Opt. Lett.35, 1136 (2010).
18. S. Kang, S. Jeong, W. Choi, H. Ko, T. D. Yang, J. H. Joo, J.-S. Lee, Y.-S. Lim, Q.-H. Park, and W. Choi, “Imaging deep within a scattering medium using collective accumulation of single-scattered waves,” Nat. Photonics9, 253–258 (2015).
19. A. Badon, D. Li, G. Lerosey, A. C. Boccara, M. Fink, and A. Aubry, “Smart optical coherence tomography for ultra-deep imaging through highly scattering media,” SCIENCE ADVANCES p. 9 (2016). 20. Y.-Z. Liu, F. A. South, Y. Xu, P. S. Carney, and S. A. Boppart,
“Compu-tational optical coherence tomography [invited],” Biomed. Opt. Express
8, 1549 (2017).
21. M. Kim, Y. Jo, J. H. Hong, S. Kim, S. Yoon, K.-D. Song, S. Kang, B. Lee, G. H. Kim, H.-C. Park, and et al., “Label-free neuroimaging in vivo using synchronous angular scanning microscopy with single-scattering accumulation algorithm,” Nat. Commun.10 (2019).
22. S. Khadir, P. C. Chaumet, G. Baffou, and A. Sentenac, “Quantitative model of the image of a radiating dipole through a microscope,” J. Opt. Soc. Am. A36, 478 (2019).
23. P. C. Chaumet, A. Sentenac, and A. Rahmani, “Coupled dipole method for scatterers with large permittivity,” Phys. Rev. E70 (2004).
24. P. C. Chaumet, A. Sentenac, and T. Zhang, “Reflection and trans-mission by large inhomogeneous media. validity of born, rytov and beam propagation methods,” J. Quant. Spectrosc. Radiat. Transf.243,
106816 (2020).
25. M.-P. Valignat, P. Nègre, S. Cadra, A. C. Lellouch, F. Gallet, S. Hénon, and O. Theodoly, “Lymphocytes can self-steer passively with wind vane uropods,” Nat. Commun.5 (2014).