HAL Id: hal-00317360
https://hal.archives-ouvertes.fr/hal-00317360
Submitted on 8 Apr 2004
HAL is a multi-disciplinary open access
archive for the deposit and dissemination of
sci-entific research documents, whether they are
pub-lished or not. The documents may come from
teaching and research institutions in France or
abroad, or from public or private research centers.
L’archive ouverte pluridisciplinaire HAL, est
destinée au dépôt et à la diffusion de documents
scientifiques de niveau recherche, publiés ou non,
émanant des établissements d’enseignement et de
recherche français ou étrangers, des laboratoires
publics ou privés.
The influence of IMF By on the nature of the nightside
high-latitude ionospheric flow during intervals of
positive IMF Bz
A. Grocott, S. V. Badman, S. W. H. Cowley, T. K. Yeoman, P. J. Cripps
To cite this version:
A. Grocott, S. V. Badman, S. W. H. Cowley, T. K. Yeoman, P. J. Cripps. The influence of IMF By on
the nature of the nightside high-latitude ionospheric flow during intervals of positive IMF Bz. Annales
Geophysicae, European Geosciences Union, 2004, 22 (5), pp.1755-1764. �hal-00317360�
Annales Geophysicae (2004) 22: 1755–1764 SRef-ID: 1432-0576/ag/2004-22-1755 © European Geosciences Union 2004
Annales
Geophysicae
The influence of IMF By on the nature of the nightside high-latitude
ionospheric flow during intervals of positive IMF Bz
A. Grocott, S. V. Badman, S. W. H. Cowley, T. K. Yeoman, and P. J. Cripps
Department of Physics & Astronomy, University of Leicester, Leicester LE1 7RH, UK
Received: 10 October 2003 – Revised: 15 January 2004 – Accepted: 23 January 2004 – Published: 8 April 2004
Abstract. This paper further addresses the issue of
night-side flow bursts which occur during intervals of northward but strongly BY-influenced IMF. Recent discussions of such
bursts concerned intervals during which the IMF BY
compo-nent was negative. The present study concerns an interval of BY-positive IMF which occurred on 20 March 2002 (01:00–
12:00 UT). During the interval BY increased steadily from ∼2 to 12 nT, whilst the BZ component decreased steadily
from ∼10 to 0 nT. There was thus a ∼6-h sub-interval dur-ing which the IMF clock angle remained between 30◦ and 60◦, such that moderate dayside reconnection and open flux
production was maintained. It is found that flow bursts of a similar size and speed to those observed under BY negative
(∼1000 m s−1, spanning 2–3 h of MLT in the midnight sec-tor) also occur when BY is positive. However, the direction
of east-west flow is reversed, indicating that they are driven by processes in the magnetosphere which are directly related to the orientation of the IMF. It is suggested that they are caused by a reconfiguration of an asymmetric tail resulting from prolonged dayside reconnection with a BY-dominated
IMF. This is consistent with previous suggestions that they are associated with convective transport following reconnec-tion in the more distant tail. Analysis of ground magnetic data, auroral images and geosynchronous particle data also show associated features, but indicate that the flow bursts are not directly associated with substorms.
Key words. Ionosphere (plasma convection;
ionosphere-magnetosphere interactions) – Magnetospheric Physics (magnetotail)
1 Introduction
The relationship between the nature of the upstream inter-planetary magnetic field (IMF) and the concurrent pattern of high-latitude ionospheric plasma convection is reasonably well understood (e.g. Reiff and Burch, 1985; Cowley and
Correspondence to: A. Grocott
(ag27@ion.le.ac.uk)
Lockwood, 1992). In the dayside ionosphere, this relation-ship is relatively simple, with an immediate response of the ionospheric plasma flow to changes in the IMF readily ob-servable (e.g. Clauer et al., 1984; Etemadi et al., 1988; Todd et al., 1988; Lockwood et al., 1989, 1993; Elphic et al., 1990; Pinnock et al., 1993, 1995; Moen et al., 1995; Provan et al., 1998; Milan et al., 2000). Flows in the nightside iono-sphere, however, are more directly controlled by magneto-spheric dynamics than by the instantaneous nature of the IMF (e.g. de la Beaujardi`ere et al., 1994; Yeoman and L¨uhr, 1997; Opgenoorth and Pellinen, 1998; Grocott et al., 2002, 2003, 2004). Although the dynamics of the magnetosphere itself are largely influenced by the IMF (e.g. Dungey, 1961; Far-rugia et al., 1993), the magnetotail actively modulates this influence, adding an extra dimension to the complexity of nightside plasma flows. Substorms, for example, are known to influence the nature of nightside convection in a number of ways (Yeoman and L¨uhr, 1997; Opgenoorth and Pellinen, 1998; Grocott et al., 2002). Recent observations of flows during geomagnetically “quiet” intervals (e.g. Huang et al., 2001; Walker et al., 1998, 2002; Senior et al., 2002; Grocott et al., 2003) have further demonstrated the diversity in night-side convection by revealing a multitude of different flow phenomena associated with various conditions of the IMF.
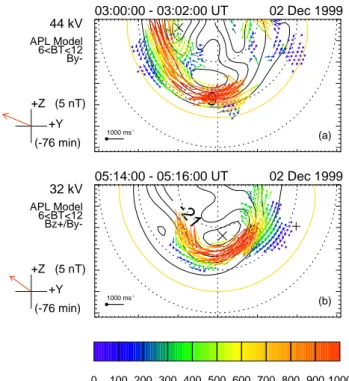
The particular phenomenon discussed in detail by Senior et al. (2002) and Grocott et al. (2003) were bursts of fast (∼1000 m s−1)westward auroral zone flow in the nightside ionosphere (see, e.g. Fig. 1). These were observed during extended intervals of modest dayside driving associated with a northward IMF which was dominated by a large negative Bycomponent. No substorm activity was observed in
associ-ation with the bursts, which were interpreted as being related to episodic reconnection in the distant magnetotail associated with the closing of open magnetic flux. The present paper continues this investigation by discussing intervals of Super-DARN radar observations of nightside flows during which the IMF was again northward, but now with a significant pos-itive By component. The principal aims of this study were
to identify firstly, whether similar bursts occur under such conditions and secondly, whether the direction and location
1756 A. Grocott et al.: The influence of IMF By on nightside ionospheric flow 0 100 200 300 400 500 600 700 800 900 1000 Velocity (ms-1 )
-9
03:00:00 - 03:02:00 UT 02 Dec 1999 44 kV APL Model 6<BT<12 By-1000 ms-1 +Z (5 nT) +Y (-76 min) (a)-21
-9
05:14:00 - 05:16:00 UT 02 Dec 1999 32 kV APL Model 6<BT<12 Bz+/By-1000 ms-1 +Z (5 nT) +Y (-76 min) (b) Figure 1Fig. 1. Streamlines and vectors of the nightside ionospheric flow
derived from the SuperDARN velocity measurements shown on geomagnetic grids, obtained from the “Map-Potential” algorithm, showing two flow bursts during an interval of northward but BY -negative dominated IMF. The exact time interval of each map is indicated in the top left-hand corner, and to the left of each map the total transpolar voltage VP C, and the direction and magnitude (in the Y -Z plane) of the lagged IMF are also indicated (adapted from Grocott et al., 2003).
of a burst are determined by the IMF By component. Both
are found to be the case, with eastward bursts having similar speeds (and similar associated values of transpolar voltage) being observed in the midnight sector auroral zone. Obser-vations from a six hour interval on 20 March 2002 are dis-cussed here in detail (some examples from other intervals are also shown), along with a theory on the origin of the bursts.
2 Instrumentation
The main instrumentation employed in this study is that of the Super Dual Auroral Radar Network (SuperDARN) (Greenwald et al., 1995). Data from the nine HF radars which comprise the Northern Hemisphere component of the network have been used to derive large-scale maps of the high-latitude convection using the “Map Potential” model (Ruohoniemi and Baker, 1998). The line-of-sight veloci-ties are mapped onto a polar grid, and used to determine a solution for the electrostatic potential which is expressed in spherical harmonics up to sixth order. The equipoten-tials of the solution represent the plasma streamlines of the
A B C T K G 12MLT 06MLT 00MLT 18MLT CON DAW FCH MCM FSI FSM GIL RAB RAN UPN GDH SKT GHB FHB Figure 2
Fig. 2. Fields-of-view of the Northern Hemisphere SuperDARN
radars at 07:00 UT, the centre time of the main interval considered in this paper. These are plotted on a geomagnetic grid with the pole at the top and dusk to the left, down to 60◦. Also shown are ground-based magnetometer locations, with red dots indicating sta-tions whose data has been explicitly shown in this paper.
modelled convection pattern. Information from the statisti-cal model of Ruohoniemi and Greenwald (1996), parame-terised by concurrent IMF conditions, is used to stabilise the solution where no data are available. A Heppner-Maynard boundary (Heppner and Maynard, 1987), determined from the line-of-sight velocity data, is also used to constrain the convection pattern at lower latitudes. The flow vectors which will be shown superposed on the electric equipotentials are derived using the SuperDARN line-of-sight velocity mea-surements with the transverse velocity component provided by the spherical harmonic fits.
The fields-of-view of those SuperDARN radars which spanned the nightside ionosphere at 07:00 UT (the central time of the main interval studied) are shown in Fig. 2. These are presented in Altitude Adjusted Corrected Geomagnetic (AACGM) coordinates, a development of the PACE system discussed by Baker and Wing (1989). Midnight magnetic local time (MLT) is at the bottom and dusk is to the left. The locations and identifier codes of a set of magnetome-ters used are also displayed on Fig. 2. Data have been in-spected from magnetograms of these two arrays which move through the midnight sector during the study interval. These are the Canadian CANOPUS array (Grant et al., 1992) and the Greenland magnetometer chain (Friis-Christensen et al., 1985). Data from selected stations (denoted by the red-filled circles) will be presented in H , D, and Z coordinates, where
H is local magnetic north, D is local magnetic east, and Z is vertically down. The locations and codes of this subset of stations will also be indicated on the flow maps.
IMF conditions for each study interval were measured by the MAG instrument (Smith et al., 1999) on board the ACE spacecraft (Stone et al., 1998). During the 20 March inter-val ACE was located upstream at GSM coordinates (X, Y, Z)=(222,−14,−15) RE (with negligible movement over the
interval). Solar wind data obtained by the SWEPAM instru-ment (McComas et al., 1998) were also used to estimate the propagation delay of field changes from ACE to the dayside ionosphere using the algorithm of Khan and Cowley (1999).
A. Grocott et al.: The influence of IMF By on nightside ionospheric flow 1757 This was found to be 71±7 min for the 20 March interval and
has been used to lag the ACE IMF data displayed here. Simi-lar delay times were found for the other intervals studied and have been used to lag the relevant IMF data as appropriate.
3 Observations
3.1 Upstream interplanetary conditions
Figure 3 shows the lagged ACE interplanetary magnetic field data in GSM coordinates for the interval 01:00–12:00 UT on 20 March 2002, during which the IMF had both positive BZand BY components. The clock angle increased steadily
from less than 10◦(almost purely northward) at 01:00 UT, to
∼90◦(purely duskward) at 12:00 UT. This corresponds to a decrease in BZ over the interval from ∼10 nT at 01:00 UT,
to ∼zero by 12:00 UT, and an increase in BY which became
dominant as it climbed from ∼2 nT at 01:00 UT to ∼12 nT by 12:00 UT. BXremained steady at around 6 nT and the
mag-nitude of the IMF remained strong between 13 and 16 nT throughout the interval. The vertical dashed lines delimit the interval of SuperDARN data which has been studied (04:00– 10:00 UT), during which the clock angle was at intermediate angles of 30◦to 60◦(such that, according to, for example, Sandholt et al. (1998a, b) a modest level of dayside reconnec-tion should prevail). This is some 3 h after the IMF initially acquired its BY and BZ positive orientation, however, such
that the nightside flows should not have been influenced by any prior magnetospheric activity which might be associated with more typically “active” IMF conditions.
3.2 SuperDARN observations of ionospheric flow
As mentioned above, SuperDARN data for this interval have been studied between 04:00 and 10:00 UT, corresponding to the interval during which the IMF clock angle was between 30◦ and 60◦. This also corresponds to the interval during which the coverage of SuperDARN data was sufficient to reasonably dominate the fitting of the ionospheric electric potential in the Map Potential model and produce reliable convection maps. Figure 4 shows two such maps from early on in the interval when the data spanned the dusk, dawn and nightside sectors sufficiently to produce reasonably complete pictures of the ionospheric flow. The bold numbers on the maps indicate the ionospheric electric potentials (discussed in Sect. 2) which, for the Northern Hemisphere, are negative at dusk (clockwise flow) and positive at dawn (anti-clockwise flow). The difference between the peaks of these positive and negative potentials thus gives a useful indication of the mag-nitude of the convection over the polar cap, referred to as the transpolar voltage.
The two maps shown are at (a) 05:30 and (b) 06:30 UT, respectively, and show the calculated transpolar voltage, the APL statistical convection model used, and an icon repre-senting the IMF strength and orientation in the Y-Z plane. These two maps are representative of the overall nature of the flow during the interval, which is dominated by a large
2 4 6 8 10 BX 5 10 15 BY 5 10 15 BZ 13 14 15 16 |B T | 0200 0400 0600 0800 1000 1200 UT 20 40 60 80 100 Clock Angle Figure 3
Fig. 3. Upstream interplanetary observations from the ACE
space-craft for 01:00–12:00 UT on 20 March 2002, lagged by 71 min to account for the propagation delay to the ionosphere. The top three panels show IMF data in GSM co-ordinates, and the bottom two panels show the field magnitude and clock angle. The clock an-gle is defined with respect to north, such that 0◦corresponds to a transverse field purely in the +z direction (northward), ±90◦to ±y (respectively) and ±180◦to −z (southward).
crescent-shaped dawn cell extending from pre-midnight to post-dawn. Owing to the intermediate nature of the IMF clock angle during this interval, one might expect to observe both Dungey-cycle and lobe convection cells (Crooker et al., 1998; Sandholt et al., 1998a, b, 2001). However, this is not well addressed by the data employed (due to lack of complete coverage) and since the presence of lobe cells is not germane to the subject of this study, they are not considered any fur-ther. What is clearly evidenced by the data is the continued excitation of Dungey-cycle twin-cell flow. The antisunward flow has a westward component over the polar cap, opposite to that reported by Grocott et al. (2003) for negative BY, and
is exactly that expected for Dungey-cycle flow in the pres-ence of positive IMF BY (Jørgensen et al., 1972; Reiff and
Burch, 1985). The flow reversal boundary was observed at a magnetic latitude of between 70◦and 75◦throughout the in-terval, although there was no trend apparent in any variation. This implies a relatively constant size of polar cap and there-fore an approximate balance between dayside and nightside reconnection over the interval. Modest velocities of a few
∼100 m s−1persisted throughout the interval, with an aver-age transpolar voltaver-age of ∼30 kV.
1758 A. Grocott et al.: The influence of IMF By on nightside ionospheric flow 0 100 200 300 400 500 600 700 800 900 1000 Velocity (ms-1 )
-9
3
3
15
05:30:00 - 05:32:00 UT 20 Mar 2002 42 kV APL Model 6<BT<12 Bz+/By+ 1000 ms-1 +Z (5 nT) +Y (-71 min) (a)3
3
06:30:00 - 06:32:00 UT 20 Mar 2002 30 kV APL Model 6<BT<12 Bz+/By+ 1000 ms-1 +Z (5 nT) +Y (-71 min) (b)Figure 4
Fig. 4. Flow maps illustrating the overall nature of ionospheric convection during the main interval discussed in this paper. Two maps are
shown, the exact time of each being indicated in the top left-hand corner. The total transpolar voltage VP C, and the direction and magnitude (in the Y -Z plane) of the lagged IMF are also indicated, as in Fig. 1.
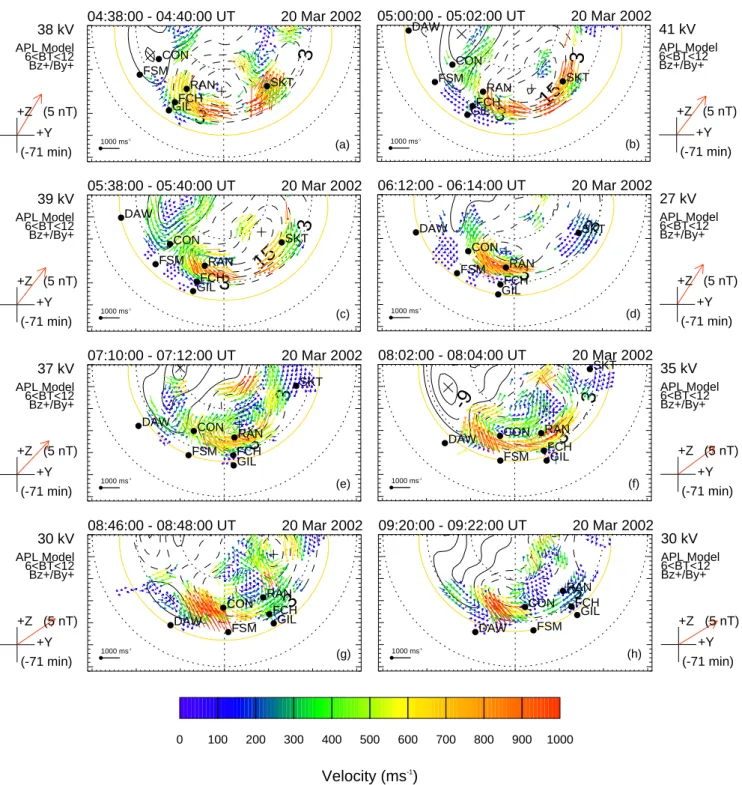
Inspection of the flow maps for the entire interval reveals that convection did not persist at these average levels but, as was found by Grocott et al. (2003), was instead interspersed with bursts of much faster flow (>1000 m s−1)in the mid-night sector, each lasting of the order of 10 min. These bursts (eight of which are illustrated in Fig. 5, panels (a– h)) recurred on a time scale of 30–60 min and (usually) in-volved an enhancement of the transpolar voltage by about 5–10 kV above the background level. The peak flows during each burst are shown on maps of the nightside ionosphere which are otherwise presented in the same style as those in Fig. 4, except for the filled black circles which indicate the locations of key magnetometers, data from which are dis-cussed below. The geometry of each burst shown in Fig. 5 is essentially the same, involving flows which emanate from the polar cap in the pre-midnight sector and then reverse in sense, travelling eastwards back towards the dayside via midnight. Whilst therefore similar to the bursts reported by Grocott et al. (2003), their direction is clearly opposite, apparently de-termined by the sense of IMF BY. This is further evidenced
by Fig. 6, which shows four bursts from two additional in-tervals of BZ-positive, BY-positive on 30 May 2001 (panels
(a–b)) and 23 September 2002 (panels (c–d)). These four bursts (and indeed, bursts from a number of other intervals studied) are similar in nature to those from the main interval
discussed here, which would therefore appear to be common to the prevailing interplanetary conditions.
3.3 Ground magnetometer data
A representative subset of the magnetometer data inspected for the 20 March interval is shown in Fig. 7, corresponding to the magnetometers indicated in Fig. 5 and to the red-filled circles in Fig. 2. The vertical dashed lines indicate the times of the peaks in flow burst activity shown in Fig. 5. The top two traces, from the DAW and FSM magnetometers, show negligible perturbations throughout the interval. As is ev-ident from Fig. 5, these stations were located consistently equatorward of the main flow enhancements which occurred. The first, and most significant signature, was at ∼04:15 UT, corresponding to the onset of the first flow burst (the peak of which is shown in Fig. 5 at 04:38 UT). This signature is largest in the RAN magnetometer data, which shows a substorm-like negative bay of ∼120 nT. This was also the disturbance with the largest spatial extent during the interval, having been observed by CON and FCH. Many of the subse-quent bursts were also accompanied by more localised mag-netic bay-type disturbances of amplitude up to 80 nT. SKT of the Greenland chain, being the most eastern station shown, only saw a perturbation for the first couple of hours of the interval before moving out of the enhanced flow region after
A. Grocott et al.: The influence of IMF By on nightside ionospheric flow 1759 0 100 200 300 400 500 600 700 800 900 1000 Velocity (ms-1 )
3
3
04:38:00 - 04:40:00 UT 20 Mar 2002 38 kV APL Model 6<BT<12 Bz+/By+ 1000 ms-1 +Z (5 nT) +Y (-71 min) (a) CON FCH FSM GIL RAN SKT3
3
15
05:00:00 - 05:02:00 UT 20 Mar 2002 41 kV APL Model 6<BT<12 Bz+/By+ 1000 ms-1 +Z (5 nT) +Y (-71 min) (b) CON DAW FCH FSM GIL RAN SKT3
3
15
05:38:00 - 05:40:00 UT 20 Mar 2002 39 kV APL Model 6<BT<12 Bz+/By+ 1000 ms-1 +Z (5 nT) +Y (-71 min) (c) CON DAW FCH FSM GIL RAN SKT3
3
06:12:00 - 06:14:00 UT 20 Mar 2002 27 kV APL Model 6<BT<12 Bz+/By+ 1000 ms-1 +Z (5 nT) +Y (-71 min) (d) CON DAW FCH FSM GIL RAN SKT3
3
07:10:00 - 07:12:00 UT 20 Mar 2002 37 kV APL Model 6<BT<12 Bz+/By+ 1000 ms-1 +Z (5 nT) +Y (-71 min) (e) CON DAW FCH FSM GIL RAN SKT-9
3
3
08:02:00 - 08:04:00 UT 20 Mar 2002 35 kV APL Model 6<BT<12 Bz+/By+ 1000 ms-1 +Z (5 nT) +Y (-71 min) (f) CON DAW FCH FSM GIL RAN SKT3
08:46:00 - 08:48:00 UT 20 Mar 2002 30 kV APL Model 6<BT<12 Bz+/By+ 1000 ms-1 +Z (5 nT) +Y (-71 min) (g) CON DAW FCH FSM GIL RAN3
09:20:00 - 09:22:00 UT 20 Mar 2002 30 kV APL Model 6<BT<12 Bz+/By+ 1000 ms-1 +Z (5 nT) +Y (-71 min) (h) CON DAW FCH FSM GIL RANFigure 5
Fig. 5. Flow maps illustrating the flow “bursts” from the main interval are shown in the same format as Fig. 1. Eight maps are shown with
the exact time of each 2-min map again indicated in the top left-hand corner. Also indicated on the maps by the black circles are the locations of the magnetometer stations colour-coded red in Fig. 1.
1760 A. Grocott et al.: The influence of IMF By on nightside ionospheric flow 0 100 200 300 400 500 600 700 800 900 1000 Velocity (ms-1 )
3
15
02:38:00 - 02:40:00 UT 30 May 2001 38 kV APL Model 4<BT<6 Bz+/By+ 1000 ms-1 +Z (5 nT) +Y (-73 min) (a)3
3
03:52:00 - 03:54:00 UT 30 May 2001 37 kV APL Model 4<BT<6 Bz+/By+ 1000 ms-1 +Z (5 nT) +Y (-73 min) (b)3
15
10:26:00 - 10:28:00 UT 23 Sep 2002 44 kV APL Model 6<BT<12 Bz+/By+ 1000 ms-1 +Z (5 nT) +Y (-67 min) (c)3
11:44:00 - 11:46:00 UT 23 Sep 2002 44 kV APL Model 6<BT<12 Bz+/By+ 1000 ms-1 +Z (5 nT) +Y (-67 min) (d)Figure 6
Fig. 6. Flow maps illustrating the flow “bursts” from two additional intervals are shown in the same format as Fig. 1.
about 06:00 UT. The most eastern of the CANOPUS stations (such as GIL, illustrated) also show a noticeable impulsive increase in Pi2 amplitude at around 04:15 UT. This enhanced Pi2-band activity then remained for the duration of the in-terval. Other magnetometers in the chain also recorded the Pi2 activity but without observing a significant perturbation in the unfiltered H-component.
It is worth noting that images from the SIE instrument on board the IMAGE spacecraft (Mende et al., 2000a, b) (not shown) indicate a modest brightening of the Northern Hemi-sphere auroral oval during the main interval but offer no ev-idence of substorm activity. LANL geosynchronous parti-cle data (Belian et al., 1992) (also not shown) provide evi-dence of a slight enhancement in energetic electron flux over the whole interval, but not of impulsive injection signatures which would also be indicative of substorm activity.
4 Discussion
It is clear, both from the observations discussed above and from the results of the previous studies mentioned in the In-troduction, that the nightside ionosphere and geomagnetic tail during intervals of northward IMF are often anything but quiescent. However, with such a wealth of phenomena re-ported and the relationships between many of them as yet unclarified, no overall picture has emerged of the behaviour
of the tail and conjugate ionosphere under these conditions. The data presented above clearly demonstrate that the night-side high-latitude ionospheric flows reported by Grocott et al. (2003) for northward IMF with BY-negative also occur
during corresponding intervals with BY-positive. The data
also show that the direction of the flows is governed by the orientation of BY, implying that the tail dynamics
responsi-ble for driving them are also directly related to the nature of the IMF.
4.1 Origin of the flow bursts
A possible mechanism by which the flow bursts are produced is illustrated schematically in Fig. 8, which shows a view looking down on the northern polar ionosphere, with noon to the top and dusk to the left. The open-closed field line bound-ary is shown as a dashed line, with the BY-positive
Dungey-cycle twin convection vortices shown as the solid arrowed curves, black for the Northern Hemisphere and grey for the expected simultaneous flow in the Southern Hemisphere. As the diagram is schematic, it may not reflect the details on the less-well observed dayside. Nonetheless, dayside reconnec-tion between terrestrial field lines and the BY-positive IMF
creates open flux tubes which are pulled towards dawn in the Northern Hemisphere and dusk in the Southern Hemisphere. As these flux tubes are dragged over the polar caps they pro-duce an asymmetry in the tail in which the lobes are twisted
A. Grocott et al.: The influence of IMF By on nightside ionospheric flow 1761 DAW Mag Lat: 66.06 N Mag Lon: -88.68 E FSM Mag Lat: 67.84 N Mag Lon: -55.76 E CON Mag Lat: 73.39 N Mag Lon: -58.83 E RAN Mag Lat: 73.23 N Mag Lon: -26.41 E FCH Mag Lat: 69.27 N Mag Lon: -28.61 E SKT Mag Lat: 72.18 N Mag Lon: 38.01 E 0400 0500 0600 0700 0800 0900 1000 UT Mag Lat: 66.95 N Mag Lon: -29.00 E GIL (20 - 200 s) H-COMPONENT (nT) 80 nT 2 nT Figure 7
Fig. 7. H -component magnetic field measurements from the red
colour-coded array of stations in Fig. 1, for 04:00–10:00 UT on 20 March 2002. The upper 6 curves show unfiltered H -component magnetic field measurements and the bottom curve shows filtered (20–200 s) data. The vertical dashed lines correspond to the times of the bursts shown in Fig. 5. The station codes and locations in magnetic longitude and latitude are also shown.
in association with the appearance of a perturbation field in the tail which has the same sense as the IMF BY (Fairfield,
1979; Cowley, 1981; Nishida et al., 1998). A schematic rep-resentation of tail field lines is given by the numbered ar-rowed lines in Fig. 8. 1 (1’) is a newly reconnected field line from the Northern (Southern) Hemisphere. Owing to the BY-asymmetry, the northern footprint of the field line is
dis-placed considerably westward of the southern footprint, and has a much longer path in the ionosphere back to the day-side. As the field line untwists itself (through positions 2 and 3) its Northern Hemisphere footprint moves faster to catch up with its southern counterpart, which results in a burst of flow across the midnight sector of the nightside ionosphere (thick black arrowed curve). An opposite tail lobe asymmetry and hence opposite direction of flow burst would therefore be ex-pected for the opposite sense of IMF BY.
4.2 Comparison with BY-negative
The schematic representation of flow bursts presented above explains the fundamental difference between the bursts dis-cussed in this paper and those reported by Grocott et al. (2003), in that the direction of the flow is determined by the prevailing sense of IMF BY. However, there are other
dif-ferences between the two phenomena which are not so
eas-12 00 18 06 Figure 8 1 18 1' 3 2
Fig. 8. Schematic of a possible mechanism by which the flow bursts
are produced showing a view looking down on the northern polar ionosphere with noon to the top and dusk to the left. The open-closed field line boundary is shown as a dashed line, with the BY -positive Dungey-cycle twin convection vortices shown as the solid arrowed curves, black for the Northern Hemisphere and grey for the simultaneous flow in the Southern Hemisphere. Tail field lines are represented by the numbered arrowed lines where 1 (1’) is a newly-reconnected field line from the Northern (Southern) Hemisphere, and 2 and 3 are the same field line at later times.
ily explained, the most obvious being the existence of neg-ative substorm-like bays in the ground magnetometer data. This, along with the pronounced Pi2 signatures observed in association with the bursts, as well as the slight enhance-ment in energetic electron flux observed at geosynchronous orbit, might lead one to suspect that these phenomena are in fact small-amplitude substorms. Only by comparing these bursts to those in the BY-negative scenario does it become
clear that this is not the case. The BY-negative bursts were
accompanied by northward deflections in the ground mag-netic field and Grocott et al. (2003) showed these to be in re-gions of low conductivity where the flow velocity was high.
1762 A. Grocott et al.: The influence of IMF By on nightside ionospheric flow Indeed, it was also found in the present study (as discussed
in Sect. 3.3, above) that only those magnetometers located inside the high speed flow region measured significant mag-netic perturbations. This, along with the lack of any signif-icant substorm-like enhancement in auroral emissions, sug-gests that the magnetic signatures associated with the flow bursts are driven primarily by changes in the electric field, rather than by enhanced conductivities. During substorm ex-pansions it is always an enhanced westward electrojet which is observed, irrespective of the sense of IMF BY, and this is
usually in a region of conductivity-induced flow suppression (e.g. Kirkwood et al., 1988; Morelli et al., 1995; Yeoman et al., 2000). It is likely, therefore, that the flow bursts ob-served for the BY-positive case are in effect the same
phe-nomenon as the BY-negative bursts and resemble substorms
more simply because they are associated with a current sys-tem which has the same orientation. They are, however, an important part of the “substorm” story in the larger sense of presumably relating to impulsive tail reconnection. A more comprehensive study of a larger number of both BY-positive
and negative intervals should more fully elucidate their rela-tionship both to substorms and to the nature of the upstream IMF.
5 Summary
This paper has further addressed the issue of nightside flow bursts which occur during intervals of northward but strongly BY-influenced IMF, discussed previously by Senior
et al. (2002) and Grocott et al. (2003). The main interval studied here (01:00–12:00 UT on 20 March 2002) is one in which the IMF had a significant positive BY component, in
contrast to the BY-negative intervals mentioned above. It is
found that flow bursts of a similar size and speed to those ob-served when BY is negative (∼1000 m s−1, spanning 2–3 h of
MLT) also occur when BY is positive. However, their
direc-tion is reversed, indicating that they are driven by processes in the magnetosphere which are directly related to the orien-tation of the IMF. It is suggested that they could be caused by a reconfiguration of an asymmetric tail, resulting from pro-longed dayside reconnection with a BY-dominated IMF. This
is consistent with previous suggestions that they are associ-ated with convective transport following reconnection in the tail. Analysis of ground magnetic data, auroral images and geosynchronous particle data also show associated features, but indicate that the flow bursts are not directly associated with substorms. Ongoing work will address the range of IMF clock angles over which they occur, and further elucidate the relationship between the nature of the IMF and consequent magnetospheric dynamics.
Acknowledgements. We would like to thank the PIs of the
Super-DARN radars for provision of the radar data employed in this study. The data employed were from radars funded by the research fund-ing agencies of Canada, France, Japan, the UK, and USA. We would also like to thank Dr Mike Ruohoniemi of the Johns Hopkins University Applied Physics Laboratory for provision of the
“Map-Potential” algorithm software. For the ground magnetometer data, we thank the Canadian Space Agency who constructed and maintain the CANOPUS instrument array, and J¨urgen Watermann and the Danish Meteorological Institute for the Greenland data. For provi-sion of ACE magnetometer data we thank Norman Ness and Charles Smith of the Bartol Research Institute. AG was supported dur-ing this study by PPARC grant PPA/G/O/2001/00014, and SWHC by PPARC Senior Fellowship PPA/N/S/2000/00197. SuperDARN operations at the University of Leicester are supported by PPARC grant PPA/R/R/1997/00256.
Topical editor T. Pulkkinen thanks T. S. Jorgensen and D. Fair-field for their help in evaluating this paper.
References
Baker, K. B. and Wing, S.: A new magnetic coordinate system for conjugate studies at high latitudes, J. Geophys. Res., 94, 9139– 9143, 1989.
Belian, R. D., Gisler, G. R., Cayton, T., and Christensen, R.: High-Z energetic particles at geostationary orbit during the great so-lar proton event series of October 1989, J. Geophys. Res., 97, 16 897–16 906, 1992.
Clauer, C. R., Banks, P. M., Smith, A. Q., Jorgensen, T. S., Friis-Christensen, E., Vennerstrom, S., Wickwar, V. B., Kelly, J. D., and Doupnik, J.: Observation of interplanetary magnetic-field and of ionospheric plasma convection in the vicinity of the day-side polar cleft, Geophys. Res. Lett., 11, 891–894, 1984. Cowley, S. W. H.: Magnetospheric asymmetries associated with the
Y-component of the IMF, Planet. Space Sci., 29, 79–96, 1981. Cowley, S. W. H. and Lockwood, M.: Excitation and decay of
so-lar wind-driven flows in the magnetosphere-ionosphere system, Ann. Geophysicae, 10, 103–115, 1992.
Crooker, N. U., Lyon, J. G., and Fedder, J. A.: MHD model merg-ing with IMF By: Lobe cells, sunward polar cap convection and overdraped lobes, J. Geophys. Res., 103, 9143–9151, 1998. De la Beaujardi`ere, O., Lyons, L. R., Ruohoniemi, J. M.,
Friis-Christensen, E., Danielsen, C., Rich, F. J., and Newell, P. T.: Quiet-time intensifications along the poleward boundary near midnight, J. Geophys. Res., 99, 287–298, 1994.
Dungey, J. W.: Interplanetary magnetic field and the auroroal zones, Phys. Rev. Lett., 6, 47–48, 1961.
Elphic, R. C., Lockwood, M., Cowley, S. W. H., and Sandholt, P. E.: Flux transfer events at the magnetopause and in the ionosphere, Geophys. Res. Lett., 17, 2241–2244, 1990.
Etemadi, A., Cowley, S. W. H., Lockwood, M., Bromage, B. J. I., Willis, D. M., and L¨uhr, H.: The dependence of high-latitude dayside ionospheric flows on the north-south component of the IMF: a high-time resolution correlation analysis using EISCAT “Polar” and AMPTE UKS and IRM data, Planet. Space Sci., 36, 471, 1988.
Fairfield, D. H.: On the average configuration of the geomagnetic tail, J. Geophys. Res., 84, 1950–1958, 1979.
Farrugia, C. J., Freeman, M. P., Burlaga, L. F., Lepping, R. P., and Takahashi, K.: The Earth’s magnetosphere under continued forc-ing: Substorm activity during the passage of an interplanetary magnetic cloud, J. Geophys. Res., 98, 7657–7671, 1993. Friis-Christensen, E., Kamide, Y., Richmond, A. D., and
Mat-sushita, S.: Interplanetary magnetic field control of high-latitude electric fields and currents determined from Greenland magne-tometer data, J. Geophys. Res., 90, 1325–1338, 1985.
A. Grocott et al.: The influence of IMF By on nightside ionospheric flow 1763
Grant, I. F., McDiarmid, D. R., and McNamara, A. G.: A class of high-m pulsations and its auroral radar signature, J. Geophys. Res., 97, 8439–8451, 1992.
Greenwald, R. A., Baker, K. B., Dudeney, J. R., Pinnock, M., Jones, T. B., Thomas, E. C., Villain, J.-P., Cerisier, J.-C., Senior, C., Hanuise, C., Hunsucker, R. D., Sofko, G., Koehler, J., Nielsen, E., Pellinen, R., Walker, A. D. M., Sato, N., and Yamagishi, H.: DARN/SuperDARN: A global view of the dynamics of high-latitude convection, Space Sci. Rev., 71, 761–796, 1995. Grocott, A., Cowley, S. W. H., Sigwarth, J. B., Watermann, J. F.,
and Yeoman, T. K.: Excitation of twin-vortex flow in the night-side high-latitude ionosphere during an isolated substorm, Ann. Geophysicae, 20, 1577–1601, 2002.
Grocott, A., Cowley, S. W. H., and Sigwarth, J. B.: Ionospheric flows and magnetic disturbance during extended intervals of northward but By-dominated IMF, Ann. Geophysicae, 21, 509– 538, 2003.
Grocott, A., Yeoman, T. K., Nakamura, R., Cowley, S. W. H., Frey, H. U., Reme, H., and Klecker, B.: Multi-instrument observations of the ionospheric counterpart of a bursty bulk flow in the near-Earth plasma sheet, Ann. Geophysicae, in press, 2004.
Heppner, J. P. and Maynard, N. C.: Empirical high-latitude electric field models, J. Geophys. Res., 92, 4467–4489, 1987.
Huang, C.-S., Sofko, G. J., Koustov, A. V., MacDougall, J. W., Greenwald, R. A., Ruohoniemi, J. M., Villain, J. P., Lester, M., Watermann, J., Papitashvili, V. O., and Hughes, W. J.: Long-period magnetospheric-ionospheric perturbations during northward interplanetary magnetic field, J. Geophys. Res., 106, 13 091–13 103, 2001.
Jørgensen, T. S., Friis-Christensen, E., and Wilhjelm, J.: Interplan-etary magnetic fields and high-latitude ionospheric currents, J. Geophys. Res., 77, 1976–1977, 1972.
Khan, H. and Cowley, S. W. H.: Observations of the response time of high latitude ionospheric convection to variations in the in-terplanetary magnetic field using EISCAT and IMP-8 data, Ann. Geophysicae, 17, 1306–1335, 1999.
Kirkwood, S., Opgenoorth, H. J., and Murphree, J. S.: Ionospheric conductivities, electric fields and currents associated with auroral substorms measured by the EISCAT radar, Planet. Space Sci., 36, 1359, 1988.
Lockwood, M., Sandholt, P. E., Cowley, S. W. H., and Oguti, T.: Interplanetary field control of dayside auroral activity and the transfer of momentum across the dayside magnetopause, Planet. Space Sci., 37, 1347–1365, 1989.
Lockwood, M., Moen, J., Cowley, S. W. H., Farmer, A. D., Løvhaug, U. P., L¨uhr, H., and Davda, V. N.: Variability of day-side convection and motions of the cusp/cleft aurora, Geophys. Res. Lett., 20, 1011–1014, 1993.
McComas, D. J., Bame, S. J., Barker, P., Feldman, W. C., Phillips, J. L., Riley, P., and Griffee, J. W.: Solar Wind Electron Proton Alpha Monitor (SWEPAM) for the Advanced Composition Ex-plorer, Space Sci. Rev., 86, 563–612, 1998.
Mende, S. B., Heetderks, H., Frey, H. U., Lampton, M., Geller, S. P., Habraken, S., Renotte, E., Jamar, C., Rochus, P., Spann, J., Fuselier, S. A., Gerard, J.-C., Gladstone, R., Murphree, S., and Cogger, L.: Far ultraviolet imaging from the IMAGE spacecraft. 1. System design, Space Sci. Rev., 91, 243–270, 2000a. Mende, S. B., Heetderks, H., Frey, H. U., Lampton, M., Geller,
S. P., Abiad, R., Segmund, O. H. W., Tremsin, A. S., Span, J., Dougani, H., Fuselier, S. A., Magoncelli, A. L., Bumala, M. B., Murphree, S., and Trondsen, T.: Far ultraviolet imaging from the IMAGE spacecraft. 2. Wideband FUV imaging , Space Sci. Rev.,
91, 271–285, 2000b.
Milan, S. E., Lester, M., Cowley, S. W. H., and Brittnacher, M.: Convection and auroral response to a southward turning of the IMF: Polar UVI, CUTLASS, and IMAGE signatures of transient magnetic flux transfer at the magnetopause, J. Geophys. Res., 105, 15 741–15 755, 2000.
Moen, J., Sandholt, P. E., Lockwood, M., Denig, W. F., Løvhaug, U. P., Lybekk, B., Egeland, A., Opsvik, D., and Friis-Christensen, E.: Events of enhanced convection and related dayside auroral activity, J. Geophys. Res., 100, 23 917–23 934, 1995.
Morelli, J. P., Bunting, R. J., Cowley, S. W. H., Farrugia, C. J., Freeman, M. P., Friis-Christensen, E., Jones, G. O. L., Lester, M., Lewis, R. V., L¨uhr, H., Orr, D., Pinnock, M., Reeves, G. D., Williams, P. J. S., and Yeoman, T. K.: Radar observations of auroral zone flows during a multiple-onset substorm, Ann. Geo-physicae, 13, 1144, 1995.
Nishida, A., Mukai, T., Yamamoto, T., Kokubun, S., and Maezawa, K.: A unifield model of the magnetotail convection in geomag-netically quiet and active times, J. Geophys. Res., 103, 4409– 4418, 1998.
Opgenoorth, H. J. and Pellinen, R. J.: The reaction of the global convection electrojets to the onset and expansion of the substorm current wedge, in “Substorms-4”, edited by Kokobun, S. and Kamide, Y., Terra Sci. Publ. Co., Tokyo, 663–668, 1998. Pinnock, M., Rodger, A. S., Dudeney, J. R., Baker, K. B.,
Green-wald, R. A., and Greenspan, M.: Observations of an enhanced convection channel in the cusp ionosphere, J. Geophys. Res., 98, 3767–3776, 1993.
Pinnock, M., Rodger, A. S., Dudeney, J. R., Rich, F., and Baker, K. B.: High temporal and spatial observations of the ionospheric cusp, Ann. Geophysicae, 13, 919–925, 1995.
Provan, G., Yeoman, T. K., and Milan, S. E.: CUTLASS Finland radar observations of the ionospheric signatures of flux transfer events and the resulting plasma flows, Ann. Geophysicae, 16, 1411–1422, 1998.
Reiff, P. H. and Burch, J. L.: IMF By-dependent plasma flow and Birkland currents in the dayside magnetosphere 2. A global model for northward and southward IMF, J. Geophys. Res., 90, 1595–1609, 1985.
Ruohoniemi, J. M. and Greenwald, R. A.: Statistical patterns of high-latitude convection obtained from Goose Bay HF radar ob-servations, J. Geophys. Res., 101, 21 743–21 763, 1996. Ruohoniemi, J. M. and Baker, K. B.: Large-scale imaging of
high-latitude convection with Super Dual Auroral Radar Network HF radar observations, J. Geophys. Res., 103, 20 797–20 811, 1998. Sandholt, P. E., Farrugia, C. J., Moen, J., and Cowley, S. W. H.: Dayside auroral configurations: responses to southward and northward rotations of the interplanetary magnetic field, J. Geo-phys. Res., 103, 20 279-20 295, 1998a.
Sandholt, P. E., Farrugia, C. J., Moen, J., Noraberg, Ø., Lybekk, B., Sten, T., and Hansen, T.: A classification of dayside auroral forms and activities as a function of IMF orientation, J. Geophys. Res., 103, 23 325–23 345, 1998b.
Sandholt, P. E., Farrugia, C. J., Cowley, S. W. H., and Lester, M.: Dayside auroral bifurcation sequence during By-dominated in-terplanetary magnetic field: Relationship with the merging and lobe convection cells, J. Geophys. Res., 106, 15 429–15 444, 2001.
Senior, C., Cerisier, J.-C., Rich, F., Lester, M., and Parks, G. K.: Strong sunward propagating flow bursts in the night sector dur-ing quiet solar wind conditions: SuperDARN and satellite obser-vations, Ann. Geophysicae, 20, 771–786, 2002.
1764 A. Grocott et al.: The influence of IMF By on nightside ionospheric flow
Smith, C. W., Acu˜na, M. H., Burlaga, L. F., L’Heureux, J., Ness, N. F., and Scheifele, J.: The ACE Magnetic Field Experiment, Space Sci. Rev., 86, 613–622, 1999.
Stone, E. C., Frandsen, A. M., Mewaldt, R. A., Christian, E. R., Margolies, D., Ormes, J. F., and Snow, F.: The Advanced Com-position Explorer, Space Sci. Rev., 86, 1–22, 1998.
Todd, H., Cowley, S. W. H., Lockwood, M., Willis, D. M., and L¨uhr, H.: Response time of the high-latitude dayside ionosphere to sudden changes in the north-south component of the IMF, Planet. Space Sci., 36, 1415, 1988.
Walker, A. D. M., Pinnock, M., Baker, K. B., Dudeney, J. R., and Rash, J. P. S.: Strong flow bursts in the nightside ionosphere dur-ing extremely quiet solar wind conditions, Geophys. Res. Lett., 25, 881–884, 1998.
Walker, A. D. M., Baker, K. B., Pinnock, M., Dudeney, J. R., and Rash, J. P. S.: Radar observations of magnetospheric activity during extremely quiet solar wind conditions, J. Geophys. Res., doi:10.129/2001JA000063, 2002.
Yeoman, T. K. and L¨uhr, H.: CUTLASS/IMAGE observations of high-latitude convection features during substorms, Ann. Geo-physicae, 15, 692–702, 1997.
Yeoman, T. K., Davies, J. A., Wade, N. M., Provan, G., and Milan, S. E.: Combined CUTLASS, EISCAT and ESR observations of ionospheric plasma flows at the onset of an isolated substorm, Ann. Geophysicae, 18, 1073, 2000.