DYNAMIC ANALOG SPEECH SYNTHE S by GEORGE ROSEN B.S., University of Pennsylvania
(1952)
S.M., Massachusetts Institute(1955)
of TechnologySUBMITTED IN PARTIAL FULFILLMENT OF THE REQUIREMENTS FOR THE DEGREE OF
DOCTOR OF SCIENCE at the MASSACHUSETTS INSTITUTE OF
January, 1960
TECHNOLOGYSignature redacted
Signature of Author.-.
Signature..edacte
Department of Electrical igi4ineering, January 25, 9
Signature
redacted
Certified b . . . .
Thesis Supervisor
Signature redacted
Accepted y... ... .... ... , . . . .-. , .
Chairman, Departmental Committee o r duate udents A
aI. OF TECHNOI
APR
1
1960
L.IBRAR"'
F~2
,~ lo08ert1 9r
C)IMi 4rc
"xiaa8oH
amoso~
S~ SVr1BvLEVtCI9 l 'to XlfaqevtaIu
(SNIf)
yaofosdosT 'lo etJ t ~iowrftsas rY
)
allT 90 TNEMJJIIUIIJAITHA Iq I GTTIMEM
~im
aaffoaci 31T JRO'q
TK1(~UPaauR
aomaioe
'10 ROTOQ(off ct I
YDOJOI4HOaT
ui o
TUTIT8XI 8TTH" J1WZA?i -. 4 0ael tx.-sun8T,~2a JS a 0 6,. 0 04 0 v 0 0
9fa'1o tuA 10 *qqu Bat
1.. * $ C C CO C a C C C a C C S 0 C C C I C S C * e.g... * * a a 'rov~ieqr~r~
aP~eii'~r
;e; ri b vde J su b it eslfimri 0 .. 6 *0C* * . y~d bo~qoooA%
Ai
MMI8VrrKY8 HD.HHqr, W A I 107ffDYNAMIC ANALOG SPEECH SYNTHESIZER
by
GEORGE ROSEN
Submitted to the Department of Electrical Engineering on January 25, 1960 in partial fulfillment of the require-ments for the degree of Doctor of Science.
ABSTRACT
A dynamically controllable electrical analog of the
vocal tract capable of synthesizing sequences of speech
sounds is described. The acoustic transmission line between glottis and lips in the human vocal tract is realized elec-trically by electronically controlled variable inductance-capacitance sections. Excitation is provided for simulating
the glottal tone and the noise of turbulence. The synthe-sizer was conceived as an instrument for research on speech production and perception. Its control system is designed
to permit the synthesis of any sequence of two phonetic ele-ments, and provides precise, flexible control over many geo-metric and temporal variables. Exploratory formal listening tests were conducted using idealized geometries for the vocal tract and piecewise-linear functions to descbibe the timing relations. An articulation score of 93 per cent was obtained for vowels made with a parabolic approximation to the tongue hump. Listeners were within 5 per cent of unanimity in their
identification of some fricatives in consonant-vowel sylla-bles. At the phoneme boundary in these syllables, the
tol-erance for relative timing error between control signals is
about 10 to 30 milliseconds. Experimental evidence is given strongly supporting the viewpoint that the articulatory level provides a natural and economical description of speech.
Thus, the dynamic analog ispotentially capable of synthe-sizing highly natural connected speech from signals having a
low information rate.
Thesis Supervisor: Kenneth N. Stevens
ACKNOWLEDGEMENT
The author wishes to express his gratitude to Professor Kenneth Stevens for the inspiration and continued encouragement given throughout this re-. search program. Also, the helpful comments and sug-gestions of Professors Morris Halle and Walter
Rosenblith are very much appreciated. For their stimulation and cooperation, the author wishes to thank the members at the Speech Group, past and
present, particularly Dr. Arthur House and Dr. James Flanagan, John Heinz and Charles Malme.
This research would not have been possible withr out the facilitied and support of the MIT Acoustics Laboratory, the MIT Research Laboratory of Electron-ics and the Cambridge Research Center of the United
4 TABLE OF CONTENTS ABSTRACT Page 2 ACKNOWLEDGMENT 3 TABLE OF CONTENTS 4 LIST OF FIGURES 6 LIST OF TABLES 11 CHAPTER 1 - Introduction 12
History and survey of synthetic speech 12
Applications of synthetic speech 15
Plan of present reseatch 17
CHAPTER 2 - The human vocal tract 19
CHAPTER 3 - Variable circuit elements for the vocal
tract analog 29
Over-all arrangement 29
Requirements for transmission line elements 32
Control paths within the transmission line 39
The variable capacitance 44
The variable inductance 53
A complete section 60
CHAPTER 4 - Apparatus for exciting the vocal tract
analog and for controlling its
configuration 66
Rationale and over-all arrangement 66
Control of configuration 71
Excitation 81
Timing pulse source 99
Trapezoidal function generator 103
The control system and its operation 109
CHAPTER 5 - Study of vowels 118
CHAPTER 6 - Study of fricatives 130
Introduction 130
Study of configuration variables 130
CHAPTER 7 - Conclusions and suggestions for further
research
176
Knowledge gained
by development and operation
of the synthesizer
176
Suggestions for further research
180
Integration of the synthesizer with other
devices
183
The dynamic analog and the testing of a
philosophy
186
APPENDIX
188
Circuit diagrams
188
Instructions to subjects
194
BIOGRAPHICAL NOTE
198
BIBLIOGRAPHY
199
U
LIST OF FIGURES
FIGURE PAGE
2.1 Diagram of the human vocal mechanism based on
a mid-sagittal section. 20
2.2 Boundaries of the vocal tract during the
pro-duction of the vowel
[e]
. 232.3 Showing a uniform acoustic tube and three
eleo-tric network analogs of the tube. 26 3.1 Circuit of the dynamic analog of the vocal
tract showing the variable elements of the
transmission line.
30
3.2 Configuration for the production of the vowel
[U].
37
3.3
Transfer function of the analog set to thecon---figuration of Fig. 3.2. 38
3.4 Simplified block diagram of a typical section. 40 3.5 Two alternative methods of approximating a
distributed system with a lumped system. 42 3.6 Scheme of a Miller effect amplifier. 45 3.7 Detailed bloak diagram of a typical section. 49 3.8 A ladder attenuator network using tubes as the
shunt elements and fixed resistors as the series
elements. 51
3.9 Signal amplifier and level stabilizer of the
variable capacitance circuit. 54
3.10 Control characteristic of the variable capacitor. 55
3.11 Contours of quality factor (Q) of the variable
capAcitor. 56
3.12 Control characteristic of a typical saturable
7
FIGURE PAGE
3.13 Driver circuit for inductor control winding. 59
3.14 Control characteristic of inductor with driver
circuit.
61
3.15 Contours of quality factor (Q) of inductor. 62
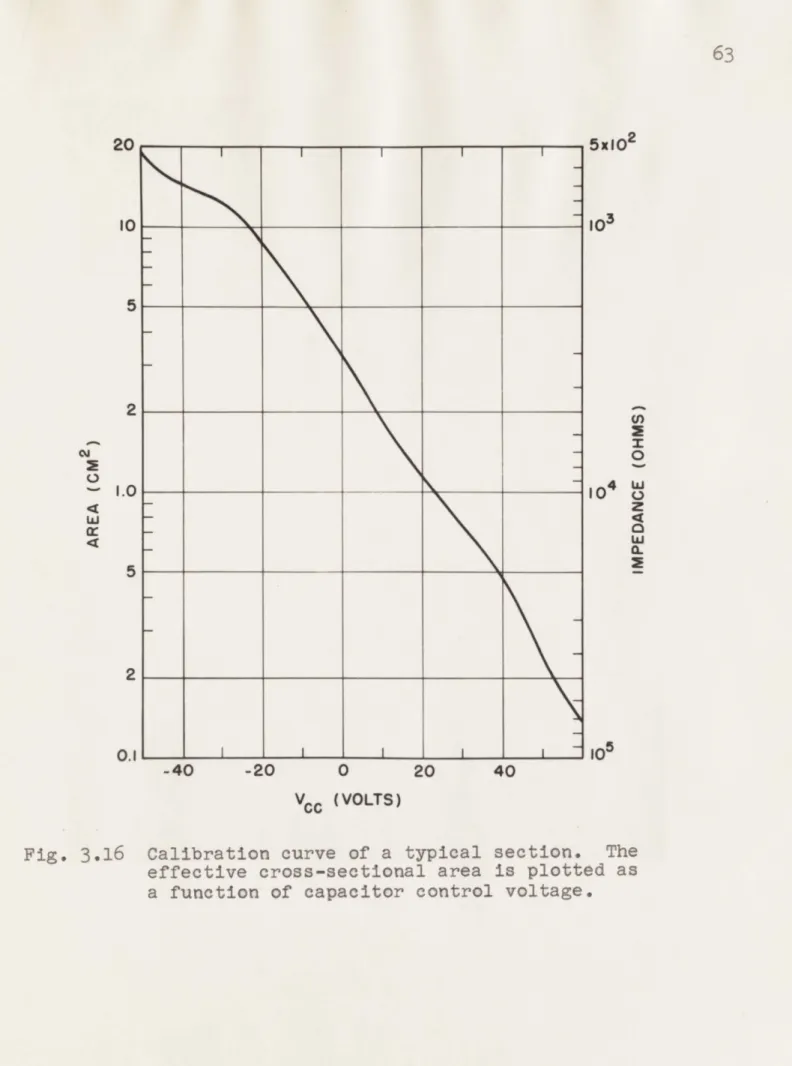
3.16 Calibration curve of a typical section. 63
3.17 Contours of quality factor (Q) of a single
section. 65
4.1 Sequence of events occuring during the produce
tion of a fricative-vowel syllable. 67
4.2 Block diagram of the control system. 70
4.3 Apparatus for generating area control voltages
for transmission line sections. 77
4.4 Matrix for the storage of articulatery
config-urations* 79
4.5 A typical glottal pulse obtained from the buzz
generator. 83
4.6 Waveforms within the buzz modulator illustrating
its operation. 86
4.7 Block diagram of the buzz generator. 87
4.8 Oscillogram of amplitude control input to buzz
generator and of buzz generator output. 89
4.9 Block diagram of symmetrical-clipping noise
modulator. 91
4.10 Oscillogram of amplitude control input to noise
generator and of noise generator output. 93
4.11 Block diagram of circuit for simulating glottal
modulation of noise. 95
4.12 Waveforms within the glottal modulation circuit
0
FIGURE PAGE
4.13 Oscillogram of buzz amplitude trapezoid at input
to glottal modulation circuit, output of glottal modulation circuit, and output of noise
genera-tor.
97
4.14 Block diagram of timing pulse generator. 101
4.15 Simplified circuit of the trapezoidal function
generator. 104
4.16 Functional diagram showing relationship between
timing pulse source, function generators, and
other units concerned with timing triggers. 110
4.17 Circuit components encountered in typical
triggering paths. 111
4.18 Photograph of the synthesizer. 117
5.1 Configurations set on the analog for a study of
nine synthetic vowels. 123
6.1 Configurations derived from an idealized model of fricative production for the case of an open
constriction. 134
6.2 Configurations used for studying fricatives
produced with close constrictions. 135 6.3 Timing patterns describing all stimuli
gener-ated for the study of configuration variables. 139
6.4 Response maps for fricatives. 147
6.5 Vocal tract transmission for a fricative judged 149
to be /f/.9
6.6 Transmission for fricative made with open
con-striction at position 3 and judged to be
/s/.
150 6.7 Transmission for fricative made with opencon-striction at position 4 and judged to be /.5/. 151
6.8
Transmission for fricative made with close6.9 Transmission for fricative made with close
con-striction at position 5 and judged to be
///.
153 6.10 Transmission for fricative made with closecon-striction at position 6 and judged to be
/g
/. 1546.11 Transmission for fricative made with open
con-striction at position 9 and Judged to be
/.X/.
1556.12 Spectrogram of /96/ showing downward
second-formant transition and spectrogram of
/fa./
showing upward second-formant transition. 157
6.13 Timing patterns describing stimuli used for studying the effects of changing noise
ces-sation time. 162
6.14 Timing patterns describing stimulus set with differing starting times for configuration
change. 163
6.15 Subject responses obtained for study of noise
cessation time. 165
6.16 Subject responses to stimuli with differing
times of configuration change. 166
6.17 Patterns describing stimuli used in three tests
for investigating buzz onset time. 168
6.18 Test scores for two fricatives as a function of
buzz onset time. 170
6.19 Subject responses in absolute identification
test as a function of buzz onset time. 172 6.20 Individual responses for 7 subjects in absolute
identification test. 173
A.1 The nasal analog designed for use with a static
analog of the vocal tract. 189
A.2 Resistance network in grid circuit of electronic
attenuator. 190
J..U
FIGURE PAGE
A.3 Circuit diagram of control amplifier for a
variable section. 191
A.k4 Circuit diagram of de amplifier for driving the
configuration storage matrix. 192
LIST OF TABLES
TABLE PAGE
5.1 Frequencies of first three formants measured on
analog set to configurations shown in Fig. 5.1. 124
5.2
Confusion matrix for vowels. 1266.1 Combinations of variables used for making
listening tests. 137 6.2 Nuhber of /f/ responses. 141 6.3 Number of /S / responses. 142 6.4 Number of
/G/
responses. 143 6.5 Number ofIf
responses. 144 6.6 Number of //
responses. 1456.7
Number of/X/
responses. 146CHAPTER 1 INTRODUCTION
1.1 HISTORY AND SURVEY OF SYNTHETIC SPEECH
Known attempts to synthesize speech date as far back as nine centuries, 48 The first analog of the speech mechanism, constructed as early as 1791 by Von Kempelen,5 9 consisted of various pheumatic devices imitating specific parts of the vocal tract. In 1829, Willis60 reported on vowel-like sounds produced by reed organ pipes. More realistic vowels were produced in 1872, when Helmholtz30 excited several of his famous acoustic resonators by tdning forks. However, the first electrical synthesizer was not reported until 1922 when Stewart56 described a circuit that produced vowels but not continuous speech. The first devices to accomplish the
synthesis of continuous speech were the voder and vocoder of Dudley.15,16 Two methods of synthesis were introduced in 1950: Dunn's static analog of the vocal tract 1 and the pattern
playback of the Haskins group.1 2 ,1 3 The resonance or formant coded synthesizer, whose earliest version is due to Lawrence, came soon afterwards, in 1953.38 Two electrical analogs were also reported that year, one by Fant20 and one by Stevens, et al.54
We shall now compare several of these synthesizers and pay particular attention to the degree that constraints in the human vocal tract are incorporated into the structure of each device.
Let us first consider the synthesizer in the vocoder system, which produces speech whose short time spectral envelope is
specified by signals at the synthesizer input. The area under this envelope is a line spectrum during voiced sounds and at other times, except silence, it is a continuous spectrum characteristic of random noise. Thus this device explicitly pbserves distinctions in excitation which are physiologically and linguistically important. However, it can produce spectrum envelopes of arbitrary shape and must rely on information in the input signals to select only those that are characteristic of speech. The need for such information implies a cost in required channel ecpacity at the input; the lack of such
information in the signals results in a lack of intelligibility or naturalness at the output.
The pattern playback, like the vocoder, also deals with short time spectra. Operating on spectral patterns painted on a moving belt, it is an important research tool but is not suited for information transmission in real time.
The resonance synthesizer22,24,38,51 is a filter network that simulates the behavior of the vocal tract as seen from
its output terminals. The control input for this class de-scribes the pole positions as functions of time and also describes the excitation. This device reflects in its
14
transmission from glottis to lips has several poles but no zeros. However, transfer functions having zeros are needed for the synthesis of most consonants. In all circuits reported to date, transitions between these two situations have been
treated in an ad hoc manner. Synthesizers of this kind have demonstrated facility with vowels and vowel-like sounds but
handle consonants poorly.
The electrical analog is concerned explicitly with parameters that describe the configuration and excitation of the vocal tract. The speech at the output of this device is a mapping into the acoustic domain of these articulatory parameters much as human speech is the acoustic correlate of physiological events. Static analogs have synthesized some
highly natural isolated speech sounds, such as vowels, but they
are incapable of producing connected speech. The limitations of static analogs are particularly evident in the case of
consonants, since certain classes of consonants such as stops, semi-vowels and affricates exist only by virtue of articulatory changes. Analog production of these consonants and of
con-nected speech in general requires a dynamically variable speech synthesizer. Such a synthesizer imitates the human vocal tract with respect to both geometrical and temporal variables, and it is expected that the device will be capable of producing most of the sounds that a human can produce.
Because it offers a natural and direct way of building in constraints present in the human speech organism the dynamic analog offers the greatest opportunity for storing information at the synthesizer about how speech is produced and how tran-sitions from one sound to another are made.
1.2 APPLICATIONS OF SYNTHETIC SPEECH
Historically, the first speech synthesizers were mere
objects of curiosity but nevertheless they provided some clues about speech production and perception. In this century, the development of synthesizers has been motivated by several
applications: to help reduce the channel capacity required for speech communication, to enable computers to speak, and to serve as instruments for speech research.
Using the concepts of information theoryi one can make quantitative estimates of the information transmission at various levels of the speech communication process*, These estimates show that most speech channels are used at a small fraction of their capacity and that it is theoretically
possible to recodO or compress speech to reduce channel capacity requirementslby some three orders of magnitude. A system for compression consists of three parts: an analyzer, a channel, and a synthesizer. As a potential component of a
-I-compression system, the dynamic analog synthesizer offers advantages over other devices, both in obtainable degree of compression and in naturalness of its output.
Synthesizers are needed as output members of automata to make possible speech communication between man and machine. Such facility is necessary, for example, in language trans-lation systems accepting and delivering the spoken word.
Almost all computing systems presently rely on sight or touch for communication with humans. Speech input and output devices would be advantageous in many existing systems and could
extend the range of new applications of computers.
A speech synthesizer can serve as a research instrument in
fields such as psychology, biophysics, speech pathology and linguistics. One function of the synthesizer is as a standard signal source; its settings provide a comprehensive, detailed description of each speech sound and its repetitive utterances at the same settings are free from unknown and uncontrolled changes in important variables. Correlation techniques5'1 1 have been developed to extract neural signals from background activity. When investigators are ready to study neural responses
to stimuli as complex as speech, synthesizers will be needed to provide the repetitive, phase coherent stimuli often
demanded by the dorrelation techniques. Many studies in pathology and linguistics are hindered because certain
manipulations and observations on the living human vocal tract are not possible. Often such studies can be pursued if a
model of human speech production is available and the dynamic analog synthesizer can function in this role.
1.3 PLAN OF PRESENT RESEARCH
To investigate the feasibility of the dynamic analog method of speech synthesis and to explore the capabilities of this method, the following program of research was initiated:
1) Development of a dynamic analog of the vocal tract, 2) Development of a control system capable of
maneuvering the analog through any sequence of
two phonetic elements, and
3) Evaluation of the machine through formal
listening tests.
The formal listening tests were experiments which tested the usefulness of this device as a research instrument and
demonstrated its capabilities as a synthesizer. The experi-mental work had as its objectives the production of certain classes of speech sounds and determination of the precision with which several of the most important control variables must be specified. An additional goal was to contribute to the understanding of speech production and perception by quantifying variables whose values, at present, can only be rank ordered.
18
The synthesizer, as conceived, is a flexible instrument
capable of generating a very large class of speech waveforms. Many studies reported in the literature can be duplicated
with this apparatus, but the instrument also extends consider-ably the area within which quantitative investigations are possible. The experiments reported here cannot be exhaustive; they should be regarded as an initial probing of that area.
19
CHAPTER 2 THE HUMAN VOCAL TRACT
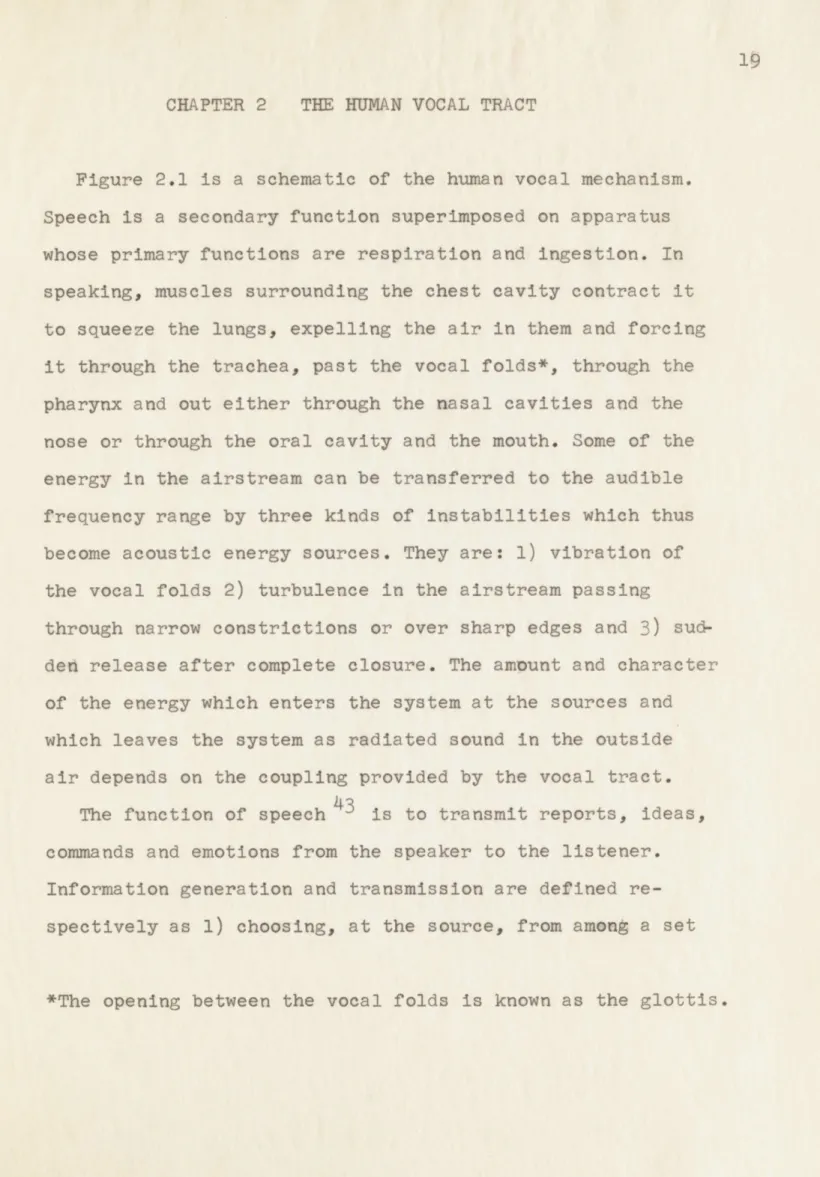
Figure 2.1 is a schematic of the human vocal mechanism.
Speech is a secondary function superimposed on apparatus whose primary functions are respiration and ingestion. In
speaking, muscles surrounding the chest cavity contract it to squeeze the lungs, expelling the air in them and forcing it through the trachea, past the vocal folds*, through the pharynx and out either through the nasal cavities and the nose or through the oral cavity and the mouth. Some of the energy in the airstream can be transferred to the audible frequency range by three kinds of instabilities which thus become acoustic energy sources. They are: 1) vibration of
the vocal folds 2) turbulence in the airstream passing
through narrow constrictions or over sharp edges and 3) sud-ded release after complete closure. The amount and character
of the energy which enters the system at the sources and which leaves the system as radiated sound in the outside air depends on the coupling provided by the vocal tract.
The function of speech 43 is to transmit reports, ideas, commands and emotions from the speaker to the listener. Information generation and transmission are defined re-spectively as 1) choosing, at the source, from among a set
NASAL CAVITY
HARD PALATE VELUM
NOSE TONGUE
TEETH,,--PH ARYNX
EPIGLOT TIS
LIPS -VOCAL FOLDS
ESOPHAGUS LOWER JAW--SPINAL COLUMN ORAL CAVITY-TRACHEA-' CHEST LUNGS CAVITY DIAPHRAGM
Fig. 2.1 Diagram of the human vocal mechanism based on a mid-sagittal section. The velum (soft palate)
can be raised to decouple the nasal cavity from
of possible messages, and 2) using a transmitter to send something through a channel to make the receiver aware of the choice made by the source. The messages can be expressed as sequences of elements chosen from a set of linguistic entities. To serve as an information channel, the acoustic output of the vocal tract must be amenable to modulation or change by the speaker. There are two thihgs under the speaker's control, the source excitations and the configu-ration of t#e coupling to the outside air. The coupling is controlled by moving the tongue and lips either directly or by displacement of the lower jaw, and by moving the velum to couple thexasal cavity to the oral cavity. The sources are controlled either directly through the musculature of the vocal folds, ot indirectly by producing constrictions and
closures in the vocal tract and through pressures on the lungs. The speaker's role can be examined by a study of his modu-lation process, i.e., his manner of speech production, or by a study of the signal he has transmitted to the channel, i.e., his acoustical output. In studying the manner of production, one can deal with the physics of speech production, making explicit reference to the size and shape of the vocal
cavi-ties, or one can treat the vocal tract as a variable multi-terminal filter and operate with its transfer functions and
The vocal cavity is shown in Fig. 2.2. It is a physical system too complicated to analyze exactly. Its walls, con-sisting of the plarynx, hard and soft palates, tongue, cheeks, and lips are made of tissue having both absorptive and re-flective properties. It is a region whose shape changes with time. Within this region some waves propagate longitudinally, from glottis to mouth, others, in cross modes, reverberate from wall to wall. The opening and closing of the vocal folds which excites the system introduces time-varying coupling to the lungs in synchronism with that excitation. During
sounds using turbulent excitation there exist regions of non-laminar compressible fluid flow resulting in a spacially
distributed source in the region of turbulence. Sounds pro-duced by closure release exhibit all of the complications of turbulent sounds and furthermore exist under conditions
which are non-stationary.
Simplifying assumptions are needed to make the system amenable to analysis or simulation. The system exhibits pressure variations small compared to atmospheric pressure so that linear umall-signal theory applies to the air medium. The dimensions of the human vocal mechanism are such that dross modes are negligible below about 5000 cps. The air and
walls appear to have but slight dissipation for longitudinal
23
141* TONGUE
LIPS PHARYNX
GLOTTIS
Fig. 2.2 Boundaries of the vocal tract during the produc-tion of the vowel [e]. A mid-sagittal section
and two transverse sections are shown (from Chiba and Kajiyama, see reference 9)
24
assumed21 . When only longitudinal waves exist in a tube, each wavefront is a cross-section thereof. Thus, pressure and likewise particle velocity are identical over a cross-section. Its shape need not be specified and one parameter, area, is sufficient to describe it. The vocal tract may be regarded as a straight tube whose area at a given time is
a function of distance along its axis. The tube has a variable port leading to a side branch, the nasal cavity, whose di-mensions do not vary with time. For voiced sounds the vocal tract is driven by the glottis, whose maximum opening is
quite small. It may be replaced by a moving piston which
gives the same volume velocity as the puffs of air passing through the opening. Turbulent regions may be characterized
by a few lumped sources* and dissipative effects summarized by a single dissipative element per source added to the
acoustical circuit. Some sounds made with a closure use glottal excitation, and previous remarks apply to them. Little is known about the physics of closure release
exci-tation. The vocal tract radiates into the outside air through the mouth opening which presents a lumped impedance load to
*Good fricatives have been synthesized using one source. (See
references 29, 54, and Chapter 6) Stop consonants, particular-ly those with distinct intervals of frication and aspiration may require,:two sources.
5
the tube. The pressure field at a distance from the speaker resembles the field of a point source whose strength equals the volume velocity through the mouth opening.
Fantl9 DunnlB, and Van den Berg58 have calculated the first few resonant frequencies of the vocal tract by ap-proximating its shape with two cylinders connected by a constriction. Dunn verified his calculations on an analog based on the same geometry. Steven, et al.54 have
con-structed an analog based on 35 cylinders to approximate more closely the shape of the vocal tract and Fant23 has built a 45-section analog.
Each analog built to date approximates the shape of the tube representing the vocal tract by a cascade of cylinders, each cylinder having uniform cross-sectional area. Each
lossless cylinder is represented in the analog by a Pi, T or L section as in Fig. 2.3. Pressure is identified with voltage and volume velocity is identified with current so that the relations between aaoustical and electrical
parameters are:
L = (2.1)
C = kA
(2.2)
1~1'~ fMjaj 'I'' 'I',
He-H
U2 P 2 P, C/2 C/2 P 2 U1 L/2 L/2 U 2 C tP2T
U, L U 2 P t CL
Fig. 2.3 Showing a uniform acoustic tube and three electric network analogs of the tube. U' pi
h)
ON Ul 227
where:
A = area of cylinder I = length of cylinder p = density of air
c = velocity of sound in air
k = constant depending on impedance level and
choice of units
The analog is seen to be a non-uniform electrical trans-mission line. The glottal source at the input is a high impedance (current) generator and the terminating
im-pedance at the mouth is predominantly inductive for frequenA
cies below 4000a ps.
The circuit of the transmission line may be hidden from view and the behavior of the line as a filter may be studied. Its properties help to define the class of waveforms and
the class of spectra to which the acoustic output signal must belong. Fant21 has shown that the transfer function relating volume velocity at the lips, U2, to volume velocity at the
glottis, Us, is a rational fraction having no zeros but
only poh4ugate complex poles in the finite complex-frequency plane. The function equals unity at zero frequency as
28
notation:
U2
(S) _____L'=dHP)
=
T
"W
H2.
where:
s = a+jw (complex frequency)
U(s) = volume velocity transform sk, s; are conjugate complex poles.
It is seen that the numerator is a constant.
A modified transfer function must be used when the vocal
tract is modified by nasal coupling. The modified function has zeros at frequencies determined by nasal resonances. The spectrum of the radiation at a distance from the speaker has zeros caused by cancellation effects between nose and mouth radiation. Excitation within the vocal tract by transient or fricative sources implies excitation of the filter at terminals other than the glottal terminals. The pertinent transfer functions possesses zeros at frequencies determined by resonances of the cavity behind the source. The poles exhibited by any circuit are the same for all terminals2 provided the generator impedances are not
changed from case to case. Thus, given a configuration, the poles for glottal excitation are the same as those for other
29
CHAPTER 3 VARIABLE CIRCUIT ELEMENTS FOR THE VOCAL TRACT ANALOG
3.1 OVER-ALL ARRANGEMENT
The dynamic analog synthesizer consists of three parts:
1) The lumped electrical transmission line which is the analog of an acoustical system, the vocal tract;
2) Sources of excitation for the line;
3) A control system for both the line and its
excitation.
The transmission line in shown in Fig. 3.1. It is a cascade of one or more of the section configurations shown
in Fig. 2.3. For voiced sounds, the transmission line is
excited at the left by glottal current pulses of variable frequency and amplitude. For fricatives and other turbulent sounds, a noise voltage generator of controllable amplitude is inserted in series with the transmission line inductor corresponding to the place where the turbulence is produced. For nasals, a nasal analog*, not yet constructed, must be
coupled to the vocal tract analog. The line is terminated by
an inductor which approximates the radiation impedance seen
*See appendix for the nasal analog circuit of House and
TO NASAL CIRCUIT f.f NCISE EXCITATION GLOTTAL PULSE EXCITATION I
2
Lo MOVABLE POINT OF2
NOISE INSERTION b-I 5 -(I I --9 ONE ONE ONE SECTION | SECTION I I I I I I I I IA
ONE SECTIONIb
ONE ONE SECTIONI
RADIATION INDUCTOR SMALL INDUCTIVE VOCAL SHUNT OUTPUT RADIATION LOADSECTION AREA CONTROL VOLTAGES
Fig. 3.1 Circuit of the dynamic analog of the vocal tract showing the variable elements of the transmission line. Voltages for control and excitation are derived from devices shown in Fig. 4.2 Noise is inserted in the line through a transformer which connects the low impedance noise
generator in series with the inductor of the appropriate section. The nasal circuit has not yet been built but is expected to be another transmission line less elaborate than the one shown in the figure. Voltages representing radiation from the nose and mouth are summed externally. 0 -- A -A I |
from the mouth. The output is the voltage across a small inductor in series with the radiation impedance. The current through the radiation impedance is treated as the strength
(volume velocity) of a simple source, and hence the voltage
across the small inductor behaves as the sound pressure at
some distance from that source.
The relations between electrical and acoustic quantities,
Eq. 2.1 and Eq. 2.2 are restated in Eq. 3.1 and 3.2.
A c ( 3.1 )
c,
f
c( 3.2 )
To vary the area of a section, its control circuit must vary
C/L. If the section is to represent a cylinder of constant
length, the control must also constrain LC to remain constant.
All of the section areas of the synamic analog can be
varied together by means of externally generated electrical control voltages to simulate the changing articulatory
configurations of the human vocAl tract. When buzz and noise excitation are synchronized with the articulatory changes,
3.2 REQUIREMENTS FOR THE TRANSMISSION LINE ELEMENTS
Both the physical phenomena for realizing the transmission line elements and their numerical values were chosen through the interplay of three factors: 1) known minimum requirements, 2) previous experience with the static analog at M.I.T.,36,54 and the state of the electronic art. The variable inductor utilizes changes in the incremental permeability of a
ferromagnetic material and the variable capacitor utilizes changes in the magnitude of the Miller effect. Both variable elements and their realization47 will be described in
later sections.
The first requirement to be considered is that the lumped approximation to a continuous line be valid for frequencies somewhat above the third formant region. This requirement implies a maximum section length of 1 1/2 cm, or about 1/8 wave length at 3000 cps. The switches of the static analog
(0.5 cm sections) were set in groups of 3 to test, by
informal listening, the adequacy of the coarse approximation to the shape of the vocal tract provided by the 1 1/2 cm sections. A combination of experience with the static analog and considerations of cost and complexity led to the choice
of the number of sections used in the dynamic analog. It is a compromise between the simplicity of Dunn's 1 analog and
The static analog had an area range of 100:1 for each
2
2
section (0.17 cm to 17 cm2). Satisfactory vowels had been produced using only settings between 0.59 cm2 and 17 cm2, a
ratio of 29:1, but it was considered desirable to have a full continuous range of 100:1 in the dynamic analog. The low end of the area range of a given section could be extended by switching a large fixed inductor in series with the variable inductor of that sect~ion. Informal listening with the static analog showed that switching transients were imperceptible when this was done. Thus, narrow constrictions and closures
for consonant production could be realized without putting impossible requirements on the va biable inductor.
For each section, the length requirement fixes (LC)1/2 and the area range requirement fixes the range of Ak(C/L)l/2 If a section is to have a constant length and an area range of 100:1.then both L and C must have a range of 100:1. The impedance level k, which is the same for all sections, is an arbitrary parameter of the transmission line. For reasons pertaining to the design of the variable elements, the
impedance level was chosen to be 0.77 x 10⁻⁴ (electrical
ohm) /cm2 of area.
The quality factor (Q) required of the inductors and capacitors can be estimated from formant bandwidth
data.34,39,57 The Q values for the first three formants of the vocal mechanism lie in the range between 3 and 15.
The losses responsible for these values are due predominantly to glottal resistance and to radiation from the mouth, while losses in the vocal tract itself are relatively small. In an electrical analog of the vocal mechanism, however, most of the losses must be in the transmission line itself since most of the physical elements, with their irreducible losses
are located within the line. The resonances of the static
analog, which has produced highly recognizable stimuli, are characterized by Q values similar to those mentioned above. The quality factor of its inductors varies from at least 9 at 200 cps to at most 250 at 5000 cps depending on area setting. Best results were obtained when dissipation was
inserted within the line to provide lower effective Q values. Preliminary designs of variable inductors indicated that
Q values above 50 at 1000 cps were attainable at the upper
end of the inductance range, However, Q values much greater than one at 200 cps at minimum inductance were not attainable in the present state of the art. This is not a serious
limitation as an analysis using energy functions shows. The definition of quality factor27 at any frequency, not only
at resonance, is
Q = 2r peak energy stored
(
3.3)
energy dissipated per cycle35
This definition is applied to a single isolated section
treating it as a simple resonant circuit. For frequencies far below the resonance which occurs above 3 kcps, the expression is
Q
=
(a/QL+1/QC)
1(
3.4
)
whereQL = inductor quality factor QC = capacitor quality factor
a = 2rf (LC)1/2 = normalized frequency.
Physically this means that most of the energy at low frequen-cies is stored in the capacitor and that the Q of the
inductor is, in effect, multiplied by 1/a.
Electronically variable capacitors having as low dissi-pation as the paper dielectric capacitors used in the static analog are clearly unattainable. In view of the limitations of the variable inductors, it was decided to reduce the dissipation of the capacitors just to the point where it
would not be the factor which limits the over-all performance of the transmission line. Accordingly, a quality factor of
The performande of the completed transmission line is the test of the previous arguments. A vowel such as[4.2 which has a low first formant is well suited as a test item. A configuration for this vowel appears in Fig. 3.2 and the corresponding transfer function of the analog in Fig. 3.3. The first number above each peak at frequency f in Fig. 3.3
gives the bandwidth Af between half power points and the
second gives q=*Alf . The bandwidths, especially that of
the first formant, are similar to those characteristic of natural speech*. Thus, the validity of the reasoning based on Eq. 3.3 is substantiated and the sufficiency of the element dissipation requirements verified.
*The values of Q are a bit high. An error in this direction is easily remedied by inserting dissipative elements.
DISTANCE FROM GLOTTIS (CM) 0 0 U Ix 3 6 9 12 15 I I I I I
21E-Fig. 3.2 Configuration for the production of vowel u . The vocal tract is treated as a cascade of circular cylinders and the radius of each cylinder is given. The short vertical markers show boundaries
be-tween sections set to the same radius. Dot symbol indicates
set-ting of radiation impedance.
14,
24,34
14,73,32
I I I I I I I I IK
FREQUENCY (CPS)
Fig.
3.3
Transfer function of the analog set to the configuration of Fig. 3.2. The square of the ratio of output voltage to input current is given in decibels relative to an arbitrary level. The first number above each of the first three formants gives the bandwidth in cps; the second gives the correspond-ing Q. 40 30 0 CL) Ul) w20
10
0
1005K
LA)00
20
I24,34
I I I 4139
3.3 CONTROL PATHS WITHIN THE TRANSMISSION LINE
A typical section in the transmission line consists of three parts, a variable inductance circuit, a variable
capacitance circuit, and a control amplifier. The design of these circuits, each having a 100:1 range, is discussed in a later section. Figure 3.4 is a block diagram of a typical section. The variable capacitance appears between ground and the input of the capacitor amplifier. Its value is
determined by VCC, the capacitor control voltage. The variable inductance, whose value is determined by VCL, the inductor control voltage, appears across the signal winding of the saturable inductor. The control characteristics of both the variable capacitance circuit and the variable inductance
circuit are exponential:
C
=
eaC-bCVCC
(
3.5
)
L
=
eaL-bLVCL
(
3.6
VCL = d-(bCA/L)VCC
(
37where aCbCaLbL, and d are constants. The control amplifier maintains a linear relation (Eq. 3.7) between VCL and Vcc so
that the LC product remains constant. Both Vcc and VCL are determined by VCS, the control input voltage that determines
L 0----;-SIGNAL WINDING CONTROL WINDING SA INI CON CUR VARIABLE NONL INDUCTANCE DRIVE CIRCUIT CONTROL AMPLIFIER
SECTION AREA CONTROL
Fig. 3*4 Simplified block diagram of a typical section. The section control input
voltage determines the magnitudes of both the variable capacitance and the variable inductance. The electrical length of the section is
constrained to remain constant as its area is varied. See Fig.
3.7
for details. 0 'Ik Ll 'El TURABLE UCTOR TROL RENT INEA R VC Le. OU IN S T I MILLER EFFECT CAPACITOR CONTROL VOLTAGE vccsection area. Thus, the length of the section remains constant as its area changes exponentially over a 100:1 range.
Each section is constructed as an L-section. A non-uniform line, however, can be approximated more closely by a given number of T-sections than by the same number of L-sections. Figure 3.5 shows L- and T-section-approximations to the
acoustical system consisting of two short adjacent cylinders of equal length and of areas A1 and A2 . The inductances are
given by
L= k/A1
(3.8
)L2 = k/A2 ( 3.9 )
where k is a constant. An L-section-approximation leads to
a total inductance L1 connected between C1 and C2. A
T-section-approximation leads to a total inductance
Lseries = L1/2 + L2/2 = k(l/A1+l/A2 )/2
(
3.10)
connected between C1 and C2. In the general case of a
ron-uniform line A1 / A2 and hence Eq. 3.10 leads to a better approximation for the series inductance than do Eqs. 3.8
SERIES INDUCTANCE L L L 2 2L 2~ 2Ti 2T ________ 1 SECT I T T SECTIONS L
2
SECT 2 SERIES 1 INDUCTANCE I 1CL
1 SECT. II
h 1 I L SECTIONS-I
SECT 2Fig.
3.5
Two alternative methods of approximating adistributed system with a lumped system.
The T-sections yield element values which
-approximate the distributed system better than do those of L-sections.
42
A-.r
u
43
A cross coupling of the control voltages of adjacent
sections allows us to approximate the desired Lseries of
Eq. 3.10. The input information to each of two adjacent
sections constructed as in Fig. 3.4 is Vcs, which corresponds to A1 (or A2). The input voltage, VCS, determines VCC, the
capacitor control voltage.The coupling connection* sums inductance control outputs of adjacent control amplifiers to derive a new control voltage VCL for the variable
inductance circuit. The new VCL lies between the values
intended by either control amplifier. If the sections are of equal length, their summing coefficients are set equal.
The inductance of the series inductor is an exponential function of VCL; therefore, its inductance is the geometric mean of the values given by Eqs. 3.8 and 3.9. For quantities differing by small ratios, the geometric mean and the
arithmetic mean are almost equal so that the series inductance approaches that given by Eq. 3.10. Thelline 66naisting of
cross coupled L-sections may be operated as though it were constructed of T-sections. The summation of control voltages for the inductor leads to an improved approximation to the
nonuniform line at negligible increase in 66mplexity, halving the number of inductors otherwise required.
44
The transmission line, whose nominal length is 17.5 cm, consists of 14 sections. The two sections adjacent to the glottis are T-sections each 1.0 cm in length and have fixed
areas approximately equal to 1.0 cm . They are followed by eight variable T-sections, each 1.5 cm in length, and the
control inputs of the first two variable sections are tied
together*. The T-sections are followed by a half-section
0.5 cm in length. The line is completed by two Pi-sections nominally 1.0 cm in length and the radiation inductor. The
final capacitor and the radiation inductor are controlled
by a single control amplifier. The inductors and capacitors of the Pi-sections are controlled separately so that those
sections may be shortened to simulate the shortening of
the human vocal tract which occurs at wide mouth openings.
In all, 13 voltages are required to specify an articulatory
configuration. Another will be needed when the nas&l analog
is added to specify degree of nasal coupling.
3.4 THE VARIABLE CAPACITANCE
The variable capacitance is realized by means of the Miller
effect, shown schematically in Fig.
3.6.
In general, Z is given by*The first of these sections covers a smaller area range to
C" 'l I 0-Zi R +E AMPLIFIER E
0o
-E K/ o"
OPEN CIRCUITFig. 3.6 Scheme of a Miller effect amplifier. The magnitude of Ci at the input is varied by varying the amplifier gain. C1 is a small
fixed capacitor.
'41
EO
lak
I 1 + K
(
3.11
)
In the useful band of the amplifier R and G are made small so that 1 zi= Ju(-+ K )C 1
(
3.12
)
and thereforeci
=(
1
K
)
C
1(
3.13
)
In practice 9#0 and R# O0 and the electronic capacitance
exhibits dissipation. A quality factor (Q) defined to
measure dissipation is given by
1
(
3.14
)
When Ro = 0 and K5>1, it is necessary that 0 ,}-1.2 in order that Q>50. When 9 = 0,
Q -=
ol1
(
3.15
)
47
thus when f=3000 cps and C1=500 micromicrofarad it is
necessary that Rc 2000 ohms in order that Q:>50.
Phase shift and finite output resistance exist simul-taneously, thus making it desirable to keep phase lag less than 1 and to keep the output resistance less than 1000
ohms. The amplifier input must be effectively an open circuit as assumed in the derivation. This requirement is met by
omitting a grid resistor for the amplifier input tube and
providing bias and dc return via the transmission line
inductors. Parasitic capacitance Cp increases the effective capacitance of the section beyond Ci , therefore,
Ceff = C+Ci = Cp+C+KC . ( 3.16
)
When K is small, changing K by a given factor changes C eff
by a much smaller factor. The gain, K, must vary from 1 to
350 in order to realize a capacitance range of 10011. The voltage across the apparent capacitance is 1/K times the
voltage at the output of the amplifier. Large values of K and moderate signal voltage across Ci imply a large signal
voltage at the output of the amplifier. The maximum peak-to-peak signal at that point is comparable to the plate
40
The Miller effect capacitor is shown in Fig. 3.7 which is a detailed block diagram of a section. The Miller ampli-fier consists of three parts: a high gain input stage, an electronic attenuator, and a low-impedance input stage, Of these, the electronic attenuator departs the most from
conventional circuitry and thus merits some discussion. The requirements for the attenuator are:
1) Gain over a 350 to I range controlled by a voltage with frequency components from zero to 25 cps;
2) Minimum disturbance of amplifier operating points and dc levels by the control voltage (both to maintain suitable conditions within the amplifier and to prevent the control voltage from appearing as an unwanted component of the voltage across
the completed capacitor)
3) Ability to handle large signal voltages (compared to variations in dc levels) without excessive distortion;
4) Less than one degree of phase shift in the useful (100 cps to 3 kcpsY band;
5) Frequency range wide enough to permit inclusion in a loop having 55 db of gain;
FROM PRECEDING SECTION OF TRANSMISSION LINE
-~MEANS FOR NOISE
-- AND CLICK INSERTION CAPACITOR
SATURABLE
COUTPUT I INDUCTOR CURRENT
AMPLIFIER ATTENUATOR AMPLIFIER SIGNAL CONTROL DRIVER
LT
WINDING WINDINGVARIABLE
CAMCITANCEVARIABE LEVEL VARIABLEE RVARIABLE
CAPACITANCE I INDUCTANCE FEEDBACK
CIRCUIT I CIRCUIT
RESISTANCE NETWORK
TO FOLLOWING SECTION OF TRANSMISSION LINE FROM VCC OF
VC9 PRECEDING SECTION IVRE
CONTROL AMPLIFIeR CATODOER VC C
TO OF
CON TROL A MPLIFIER FOLLOWING SECTION
L -- -- --- J
Fig. 3.7 Detailed block diagram of a typical section. The variable capacitance uses a level stabilizer in lieu of filtering to remove control voltage components from the signal path. The control voltage V at the
section input controls both variable elements by first ebntrolling V . Either voltage may be used when describing section performance.
50
7) A high input impedance and a low output impedance; 8) Stability of calibration and absence of critical
adjustments.
The strategy in the development of this attenuator was:
1) Utilizing the known effect of control voltage changes on dc levels to generate a cancellation
voltage or current;*
2) Maintaining the ratio of signal voltage to level
change as high as possible;
3) Using several attenuation stages to reduce requirements on individual tubes;
4) Connecting successive stages in a manner compatible
with large changes in dc level;
5) Keeping the asymptotic phase shift at low and
high frequencies low enough to be suitable for use in a high-gain feedback loop.7
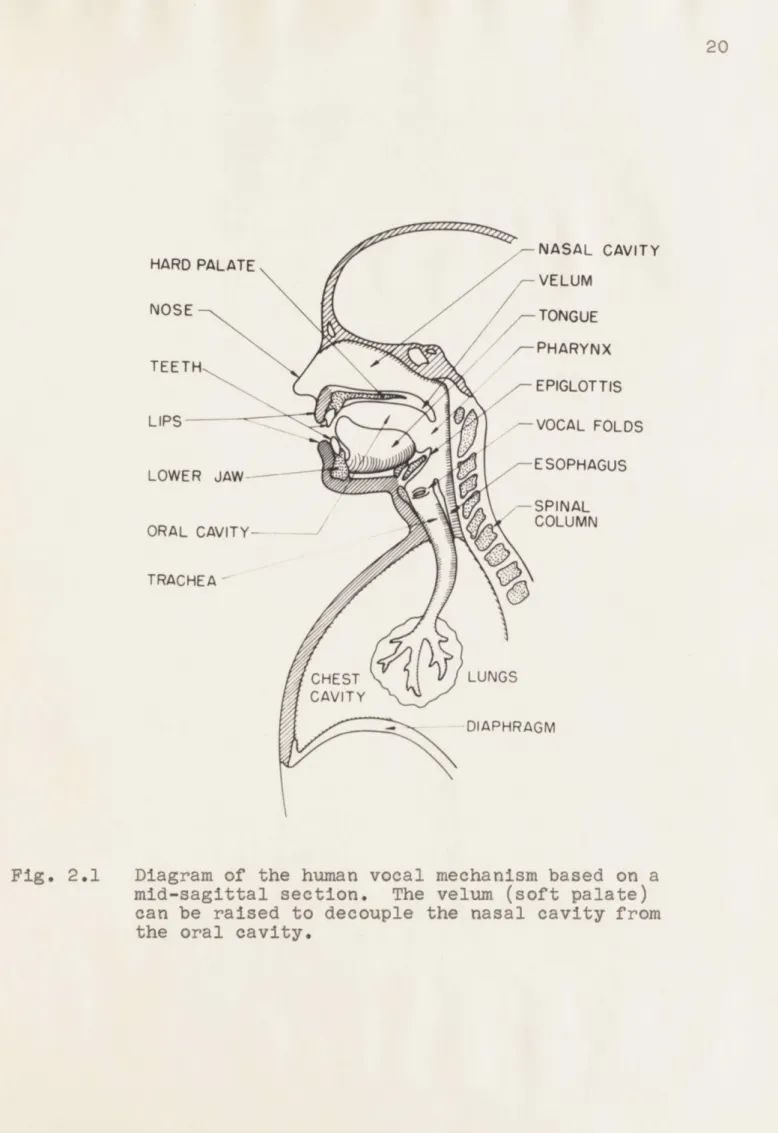
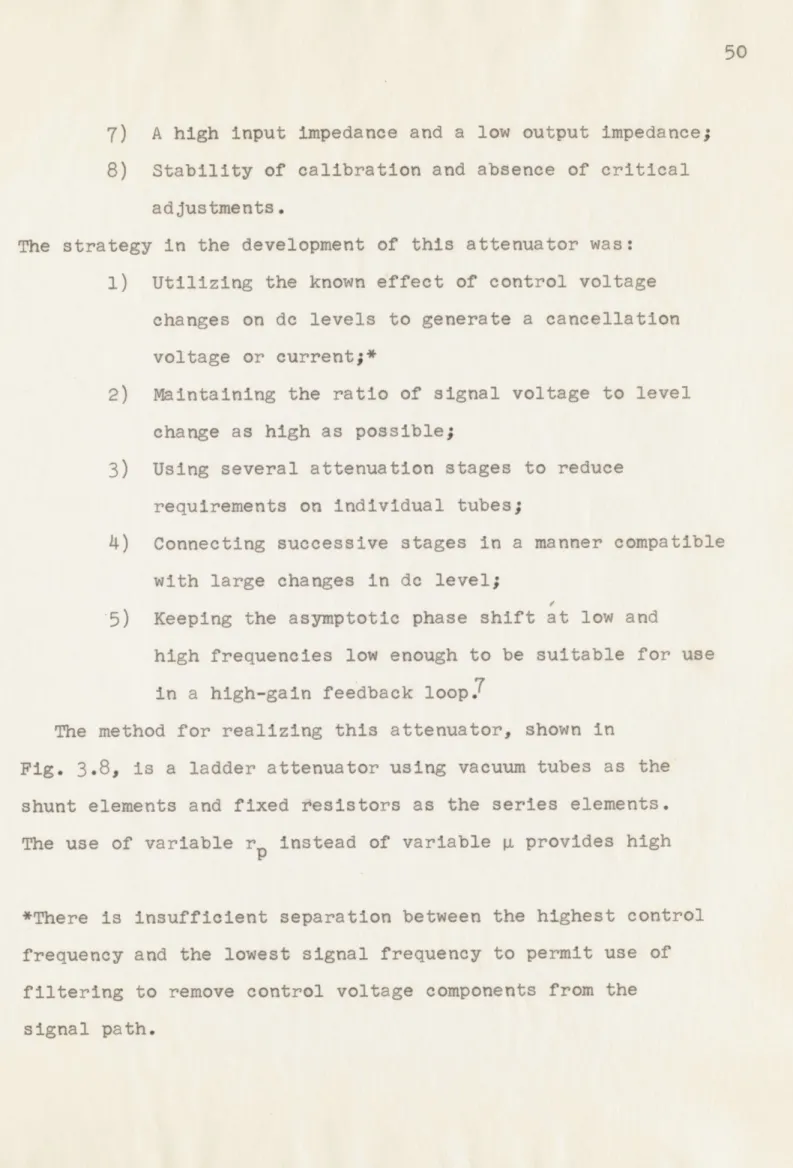
The method for realizing this attenuator, shown in
Fig. 3.8, is a ladder attenuator using vacuum tubes as the shunt elements and fixed tesistors as the series elements. The use of variable rp instead of variable 4.provides high
*There is insufficient separation between the highest control frequency and the lowest signal frequency to permit use of
filtering to remove control voltage components from the signal path.
EIN
----... .. E OUT
EB
I
so
Fig. 3.8 A ladder attenuator network using tubes as the shunt elements and fixed
resistors as the series elements.
vi H
signal-handling ability. Confining the connection between attenuator stages to the plate circuit permits drastic uncompensated operating point changes to occur in an early stage of the attenuator without disabling a later stage. Many stability problems are circumvented by grounded cathode operation, both in regard to drift and in regard to high-frequency phase response. The latter is important because the unity loop gain point is above two megacycles per second
in the completed capacitor. The attenuator is useful to zero frequency because reactive elements or transformers are not needed for coupling between attenuator tubes. By putting small capacitors across each series resistor, the
high-frequency asymptotic behavior can be made that of a capacitive voltage divider for which the slope of the attenuation curve is zero in the neighborhood of infinite frequency. It is
clearly impossible to put a capacitor across the (hypothetical) plate resistance (rp) of a tube used as an amplifier to
achieve the same effect. A nonlinear circuit, designated in Fig. 3.7 as "level stabilizer", is connected between the attenuator control source VCC and the output amplifier
to stabilize the de level of the signal applied to the output amplifier against variation due to changes of operating points in the attenuator.
53
The desired calibration curve (Eq. 3.5) was achieved by
choosing the proper functional relations between the attenuator control voltage VCC and the grid voltages applied to the shunt tubes. These relations are realized by use of a resistance network in conjunction with grid conduction in the attenuator tubes. This network appears in Fig. 3.7 and is described in detail in the appendix. The circuit of the attenuator together with the input and output amplifiers is given in Fig. 3.9.
The control characteristic of the capacitor is shown in Fig. 3.10. The capacitance is an exponential function of
control voltage within 15 per cent of the mean over a 40 to 1 range in the presence of the expected stray capacitance to ground. Dissipation in the capacitor, described by the contour map in Fig. 3.11, is within the limits specified above.
3.5 THE VARIABLE INDUCTANCE
The variable inductance is realized as a saturable
inductor. A saturable inductor has a magnetic circuit
consisting of three portions or legs arranged in a "figure eight". A control winding is wound on the inner leg producing
a control flux whose return paths are the outer legs. The
signal winding is split into two halves each placed on an
outer leg and connected in series aiding. As a result the mutual inductances between each half of the signal winding
+300 +500 470ppf 10 pf 1ppf Opf 0pf 7.5 K.I8K NODOE0 K NODE K PROVIDE NODE 3
D.C. RETURN V I 56KV2A V36 V2B V4U
TO -3 VOLTS 6CL6 IK +300 12AU7 12AT7 12AU7 12AU7
NENODIE 2 M N0 +30 270K _._M Noe C+t2 0-0025 ISO _1pg33K 2.2K ---- Noc NODE 0 t f + vu 15K INODE 8 220K-AAA
Fig. 3.9 Signal amplifier and level stabilizer of the variable capacitance circuit. The resistance network, shown in the appendix, is connected to nodes 9 through 12 and applies control voltages which, in turn, are derived from VCC , the
capa-citor control voltage.
U,
vV-vNODE
V3A V5A V58
12AT7- 12AT7 12ATT
KE 9 DE 10 DE 11 A 9 33K V6A .- 6BQ7A S25K LEVEL -- 0-ADJUST' V6B NODE 12 6BO7A 7 33K 15K IK * 200
I
__H
I I ~ I 4&
xN x4-I
-- ________ p +-15-- t+-15-- t-INDUCTOR SIGNAL WINDING CAPACITANCE TO GROUND INCLUDED -20 0 20 40 60 vGG(VOLTS)Fig. 3.10 Control characteristic of the variable capacitor.
55
47%10
6 5 4 3 f8
6 5 4 -t. () 4 -40 3 2 8 6 5 4u10 i i At pt At I I I I-50 1504
5000o
050 20 0p- 3100 50 J 30 ,201 000200
3 4 5 6 691000FREQUENCY
(ape)
2 3000Fig. 3.11 Contours of quality factor (Q) of the variable capacitor. The minimum required Q is achieved
at 3 kc. The Q is well above minimum at other
frequencies.
S
7
Ae^ -I -r Ar57
and the control winding have opposite polarities and hence the net coupling between the signal and control winding is very small. Control flux through the magnetic material of the outer legs varies the incremental permeability of that
material through values which lie between those of the de-magnetized and fully saturated states. The signal winding inductance is proportional to the permeability of the core. This inductance as a function of control current is given in Fig. 3.12.
The inductance of the signal winding is not an exponential function of the current through the control winding. Control current must, therefore, be obtained from a nonlinear driver circuit such that the inductance of the inductor signal
winding is an exponential function of VCL, the control input voltage to the driver. Figure 3.12 shows that signal winding inductance is very sensitive to changes in control current in the region of low current and high inductance. Thus the gain of the driver must be small at low currents but its stability of calibration must be very high, and vice versa. In addition the driver output impedance must be high if rapid response is to be obtained. A triode with a nonlinear cathode resistor meets all the stated requirements. The backward gain in the driver circuit, Fig. 3.1.3, is a monotonic function of output current; it is greatest at
I
~
I
~ I I_-
-4---______ --- 1- - -t -.-
I
-- -.I I I
CONTROL WINDING CURRENT (MA)
Fig. 3.12 Control characteristic of a typical saturable inductor.