HAL Id: hal-00301676
https://hal.archives-ouvertes.fr/hal-00301676
Submitted on 15 Jan 2007
HAL is a multi-disciplinary open access
archive for the deposit and dissemination of
sci-entific research documents, whether they are
pub-lished or not. The documents may come from
teaching and research institutions in France or
abroad, or from public or private research centers.
L’archive ouverte pluridisciplinaire HAL, est
destinée au dépôt et à la diffusion de documents
scientifiques de niveau recherche, publiés ou non,
émanant des établissements d’enseignement et de
recherche français ou étrangers, des laboratoires
publics ou privés.
tropical-like storms using an axisymmetric,
nonhydrostatic, cloud resolving model
L. Fita, R. Romero, A. Luque, K. Emanuel, C. Ramis
To cite this version:
L. Fita, R. Romero, A. Luque, K. Emanuel, C. Ramis. Analysis of the environments of seven
Mediter-ranean tropical-like storms using an axisymmetric, nonhydrostatic, cloud resolving model. Natural
Hazards and Earth System Science, Copernicus Publications on behalf of the European Geosciences
Union, 2007, 7 (1), pp.41-56. �hal-00301676�
© Author(s) 2007. This work is licensed under a Creative Commons License.
and Earth
System Sciences
Analysis of the environments of seven Mediterranean tropical-like
storms using an axisymmetric, nonhydrostatic, cloud resolving
model
L. Fita1, R. Romero1, A. Luque1, K. Emanuel2, and C. Ramis1
1Grup de Meteorologia, Departament de F´ısica, Universitat de les Illes Balears, Palma de Mallorca, Spain
2Program in Atmospheres, Oceans, and Climate, Massachusetts Institute of Technology, Cambridge, Massachusetts, USA
Received: 28 September 2006 – Revised: 20 December 2006 – Accepted: 29 December 2006 – Published: 15 January 2007
Abstract. Tropical-like storms on the Mediterranean Sea are
occasionally observed on satellite images, often with a clear eye surrounded by an axysimmetric cloud structure. These storms sometimes attain hurricane intensity and can severely affect coastal lands. A deep, cut-off, cold-core low is usually observed at mid-upper tropospheric levels in association with the development of these tropical-like systems. In this study we attempt to apply some tools previously used in studies of tropical hurricanes to characterise the environments in which seven known Mediterranean events developed. In particular, an axisymmetric, nonhydrostatic, cloud resolving model is applied to simulate the tropical-like storm genesis and evo-lution. Results are compared to surface observations when landfall occurred and with satellite microwave derived wind speed measurements over the sea. Finally, sensitivities of the numerical simulations to different factors (e.g. sea surface temperature, vertical humidity profile and size of the initial precursor of the storm) are examined.
1 Introduction
Different studies have shown the existence of Mediterranean systems presenting some similarities with tropical storms (Rasmussen and Zick, 1987; Lagouvardos et al., 1999; Pytharoulis et al., 2000; Homar et al., 2003). These particular systems exhibit a rounded cloud area with a free cloud cen-tre (like an eye), strong cyclonic winds and deep convection. These same studies have revealed that these Mediterranean systems can have the strength of a tropical storm (more than 33 m/s). Sensitivity simulations carried out using mesoscale models (Lagouvardos et al., 1999; Homar et al., 2003), re-vealed characteristics of Mediterranean cases that are sim-ilar to those of tropical cyclones (Emanuel, 2003), such as
Correspondence to: L. Fita (lluis.fita@uib.es)
the presence of deep convection and the strong influence of surface latent and possibly sensible heat fluxes. However, Mediterranean systems are smaller and weaker than tropi-cal ones. Mediterranean tropitropi-cal-like storms (the “medicane” term has been proposed for these storms) evolve under sig-nificantly different environmental conditions compared with the tropical ones. Maritime Tropical environments exhibit homogeneous atmospheric characteristics over most of the low latitudes region. They are characterised by warm tem-peratures and high humidities (e.g. mean annual values of temperature and humidity at 1000 hPa for the West Indies are respectively 24.3◦C and 79%; Jordan (1958)). Tropical
environments show also a low seasonal trend (annual spread of the temperature at all levels is lower than 10◦C (Jordan,
1958, cited)).
The development of medicanes on the Mediterranean basin is quite unusual (about 15 cases in the last 20 years have been reported in the literature and in satellite images by the authors). They evolved above the Mediterranean Sea and presented strong winds and heavy precipitation. An appro-priate understanding of the medicanes can help to mitigate the potentially high destructive effects of the systems on the densely inhabitated Mediterranean coast.
Medicanes have a structure similar to that of tropical sys-tems. Thus a numerical model for tropical systems (Ro-tunno and Emanuel, 1987) is used to study a collection of Mediterranean atmospheric environments related to tropical-like cases. Cloud model simulations will be used as a tool to study the Mediterranean environments in which seven med-icanes were formed and to examine the limitations arising from the model assumptions. It is not attempt to simulate the real cyclones, but rather to assess the potentialities of the en-vironments to support this kind of extreme windstorms. The model is an axisymmetric cloud resolving model employed to simulate under idealised, homogeneous conditions, trop-ical systems such as hurricanes and troptrop-ical storms. The results of the numerical simulations allow one to determine
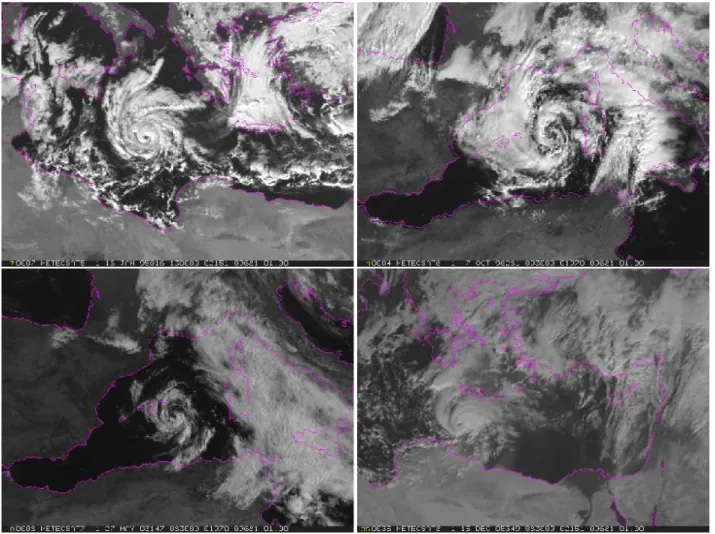
Fig. 1. Four tropical-like Mediterranean storms observed from the Meteosat visible channel. Visible image corresponding to “950116” case
on 16/01/95 at 13:00 UTC (METEOSAT-5,top left), for “961007” case on 07/10/96 at 09:30 UTC (METEOSAT-5, top right), for “030527” case on 27/05/03 at 08:30 UTC (METEOSAT-7, bottom left) and for “051215” case on 15/12/05 at 08:30 UTC (METEOSAT-8, bottom right). Images obtained from SSMI sources (www.ssmi.com).
similarities and differences between the storms in the Trop-ical and Mediterranean environments. The air-sea interac-tion theory of tropical cyclones shows that the steady-state of these storms can be idealised by a Carnot engine, with good agreement between the theoretical maximum wind speed (or potential intensity) and observed values in the Tropics. How-ever, the Mediterranean basin (Reiter, 1975) presents charac-teristics significantly different from those of tropical regions (Jordan, 1958; Emanuel, 2003). Some of these Mediter-ranean characteristics are: high orography surrounding a small sea, higher latitudes and hot and dry air intrusions from North Africa.
The effect in the simulated medicane of the sea surface temperature, dimension and strength of the initial perturba-tion from which the medicane will grow, and the stability of the air (Emanuel, 2003, 1986) will be analysed.
Moreover, a recent study (Romero and Emanuel, 2006), applied an empirical index of tropical cyclone genesis to the medicane cases. The results showed systematically high val-ues of the index for all the events and therefore its value as a forecasting parameter. The index is based, among other en-vironmental factors, on the potential intensity (or maximum attainable wind speed) of tropical cyclones derived from the air-sea interaction theory (Emanuel, 2003). The theoretical potential intensity (Bister and Emanuel, 1998) can be com-pared in this work with the – simulated and observed – inten-sity of the selected medicane events.
In order to obtain general results, seven medicane envi-ronments are analysed. Selected cases attained different in-tensities and behaviours. Their evolved in different Mediter-ranean areas and different periods of the year. All the sim-ulations and a short discussion of the results are available on the web site http://www.uib.es/depart/dfs/meteorologia/ METEOROLOGIA/LLUIS/medicanes.
950116 960912 961007 030527 031018 051027 051215
Fig. 2. Storm trajectories derived from satellite imagery. See legend for case-description.
In the next section, general characteristics of the medi-canes, which have been obtained from recorded observations, are presented. In Sect. 3, the results obtained with the ax-isymmeteric cloud model are illustrated. In the fourth sec-tion, sensitivity simulation tests to examine changes of dif-ferent features of the model are described. Section 5 exam-ines the ability of a nonhydrostatic three-dimensional model to simulate two of the cases. Finally, conclusions and ideas on further work are included.
2 Mediterranean tropical-like storms
The seven environments for this study have been selected from satellite imagery and previously published papers on tropical-like storms. That is, these events have been se-lected because they exhibited in the satellite visible channel a rounded and clear-eye cloud structure (see Fig. 1). The lit-erature describes more than seven cases (Lagouvardos et al., 1999). However, only the cases for which satellite images were accessible could be studied. Once a storm was selected (see Table 1), the storm was tracked using visible, infrared and water vapour satellite channels. The storm trajectory was chosen from the centre of the storm, or from the position of the eye (when it was visible). The formation, maintenance and dissipation of tropical-like storms are all of interest to this study. For this reason, the chosen trajectory comprises the entire lifetime of the storm and not only when a clear eye and rounded cloud structure are clearly observed.
Almost all cases presented similar patterns. Initially, the environments exhibited high convective activity. Then, a sig-nificant storm formed (sometimes preceded by a small
vor-Table 1. Selected environments related to a tropical-like
Mediter-ranean storm. First col. indicates label storm. 2nd col.: Storm ini-tial date (on [DD]/[MM] [HH]:[MI] format), 3rd col.: Storm ending date, 4th col.: Eye beggining, 5th col.: Eye ending.
case Storm Beg. Storm End Eye Beg. Eye End 950116 14/01 12:00 18/01 20:00 15/01 07:00 18/01 06:30 960912 11/09 21:00 13/09 02:30 12/09 07:30 12/09 12:00 961007 06/10 03:30 11/10 03:00 07/10 05:30 07/10 06:30 08/10 06:00 10/10 12:00 030527 25/03 12:00 28/05 04:30 27/05 08:30 27/05 15:30 031018 17/10 00:00 19/10 04:00 18/10 12:30 18/10 13:30 051027 26/10 20:30 29/10 14:30 28/10 10:00 28/10 12:00 051215 13/12 05:00 16/12 12:15 14/12 08:00 14/12 15:15 15/12 06:00 5/12 14:15
tex, as reflected by a weak rotation of surrounding cloud structures-not shown). The storm then grew significantly in-creasing its cyclonic rotation and size. About 24 h later, the storm exhibited a rounded structure with high rotation. In the centre of the cloud structure, a free cloud area (an eye-like structure) was visible. The hurricane-eye-like aspect of the storm was visible at different periods of the storm evolution, and lasted for different amounts of times (see Table 1, for more details). Then, the storm diminished in intensity and finally disappeared (generally 1 day later), mainly when the storm reached the coast.
Environments related to tropical-like storms are detected in all seasons; however, a great preponderance occurs dur-ing Autumn. Studied storms of these environments reached
S-N W-E 5600 5600 5600 5600 5500 325 320 320 315 5600 Hm (25, gpm) PTKm (2.5, K) 2 4 6 8 10 12 14 16 18 20 W-E S-N -20 -18 -16 -14 -12 -10 -8 -6 -4 -2 W-E S-N Tp (C) W-E S-N Tp (C)
Fig. 3. Synoptic map for “950116” case from ECMWF analysis. Top left panel: averaged geopotential height at 500 hPa (dashed line, every
25 gmp) and averaged potential temperature at 300 hPa (solid line, every 2.5◦K). Top right panel: average temperature at 850 hPa (solid
line, every 2.5 C) and average absolute vorticity at 900 hPa (dashed grays, only positive values 10−5s−1). Bottom left panel: Temperature anomaly at 850 hPa at storm formation time on 14/01/95 at 12:00 UTC (black-to-white positive values, white-to-black negative values). Bottom right panel: relative humidity anomaly at 925 hPa (shaded % units) and Ertel Potential Vorticity on a Isoentropic surface (330 K, dashed lines every 0.5 PVU) at storm formation time on 14/01/95 at 12:00 UTC. Average fields are calculated from fields during all storm life cycle. Anomaly fields are calculated from time averaged fields at storm formation. Thick line with circles indicated storm trajectory.
different durations (larger than two days). Some storms trav-elled large distances (across almost all Mediterranean basin, see Fig. 2). All of them showed a high cyclonic rotation and less than 500 km in radius. Generally, medicanes evolved in environments with deep and intense convection (as re-vealed by cold-top cloud brightness temperatures and quick
cloud development on infrared satellite images, not shown). In cases “961007” and “051215”, storms developed an eye twice. In the “961007” case, the storm evolved from the Balearic islands to Greece. Between the Balearic islands and Sardinia, the storm exhibited a rounded-eye structure. This structure disappeared while the storm crossed over the island
Table 2. Storm observed characteristics (BUFR files-pilot, synop sources- from ECMWF). The selected values corresponded to the maximum
values of observations closer than 1000 km to the storm trajectory (when exhibited eye-rounded cloud structure) and date and position of the observation ([DD] [HH]; latitude, longitude). Col 1: Case label, col 2: minimal pressure (hPa), col 3: maximum surface wind speed (m/s) and col 4: maximum surface temperature (K). Maximum wind (53.0 m/s) of 961007 storm is perhaps not correct.
case Pmin (hPa) max sfc. wind (m/s) max. temperature (K) 950116 1009.0 (16 06; 35.60, 18.40) 26.0 (16 12; 35.30, 18.70) 13.3(16 06; 35.60, 18.40) 960912 998.4 (12 12; 39.55, 2.73) 24.0 (12 09; 40.80, 2.20) 24.9(12 15; 38.28, −0.55) 961007 1004.8 (07 06; 39,87, 4.23) 19.0 (07 12; 37.30, 5.6) 17.4 (07 12; 37.30, 5.6) 997.0 (09 00; 40.30, 12.40) 53.0 (09 06; 38.20, 15.55) 24.1 (09 09; 39.10, 9.52) 030527 1012.5 (27 09; 39.87, 4.23) 13.0 (27 1837.2, 3.50) 21.7 (27 12; 39.55, 2.73) 031018 1024.0 (18 12; 39.87, 4.23) 13.0 (18 12; 37.10, 4.3) 22.1 (10 18; 37.10, 4.30) 051027 1021.2 (28 18; 35.0, 16.0) 5.0 (28 18; 35.0, 16.0) 23.1 (28 18; 35.0, 16.0) 051215 991.0 (14 06; 35.5, 12.6) 25.0 (14 12; 33.5, 13.3) 19.7 (14 13; 35.5, 12.6) 993.5 (15 12; 33.6, 24.9) 18.0 (15 12; 33.6, 24.9) 17.6 (15 12; 34.1, 25.7)
Table 3. Sounding main characteristics for each case [DD]/[MM] [HH]:[MI], at ([latitude], [longitude] position), and SST: Sea surface
temperate (K), C: Cape (J/kg), Sh: Showalter index (C), PW: Precipitable water (mm), CI15: Convective Instability between 1000 and 500 hPa layers (deg.), SRH: Storm relative helicity (m2/s2), TH15: Thickness between 1000 and 500 hPa layers (m). §, soundings not corresponding to time storm position, because at this time storm was over land.
case S. date (lat., long.) SST C Sh PW CI15 SRH TH15 950116 14/01 12:00 (37.9, 18.9) 15.7 27.8 4.28 15.8 1.8 −16.3 5348 960912 12/09 00:00§(38.3, 1.2) 24.3 1840 0.38 41.0 −13.5 79.3 5647 961007 06/10 06:00 (38.4, 1.2) 22.0 1284 0.92 20.6 −10.8 −141.3 5439 07/10 12:00 (40.4,6.3) 20.9 932 0.57 24.9 −9.4 −46.2 5503 030527 26/05 06:00 (42.4, 4.3) 17.1 0.0 2.36 25.4 2.3 1077 5493 031018 17/10 12:00§(37.2, −0.7) 22.3 946.9 −1.56 33.9 −8.4 −63.6 5544 051027 27/10 12:00 (30.8, 12.6) 25.6 1043 −2.08 30.5 −12.6 8.9 5621 051215 13/12 12:00 (33.8, 12.6) 20.1 376.5 −0.71 22.0 −5.5 43.2 5439 14/12 06:00 (35.6, 13.8) 18.2 0.1 3.27 18.4 −0.4 43.7 5462
of Sardinia. Past the island, the storm again formed a clear-eye rounded cloud structure later. In the “051215” case, the storm started on the SW coast of Tunisia and evolved east-ward, exhibiting two eye periods, one while south of Italy, and the other while south of the island of Crete, until the storm died in Syria.
Synoptic environments, obtained from ECMWF analyses, were similar for all selected cases (e.g.: Fig. 3 for “950116” case). Generally, in the zone of storm evolution, a mid-upper level cold low, and strong thermal gradients were present. However, no particularly high relative humidities or deep column positive vorticity values, presumed in the tropical systems, were detected. Synoptic atmospheric environments obtained from ECMWF analyses did not show any partic-ular difference from previous climatological Mediterranean studies of cyclonegensis and cyclone evolution (Reiter, 1975; Campins et al., 2000).
Soundings derived from ECMWF analyses have been used to initialise the cloud model. These soundings do not show special environmental aspects (see Table 3). Sea surface tem-perature (SST) was not warmer than climatological values (Reiter, 1975). Generally, the synthetic soundings exhibit significant instability (values of index CAPE higher than 700 J/kg) and high amount of precipitable water in the air column (higher than 22 mm). However, these values are not rare in comparison with characteristic Mediterranean storm situations (Tudur´ı and Ramis, 1997). Thus, the atmosphere did not show any specific characteristic from which any par-ticular precursor signature of medicane formation could be obtained.
Two types of observation have been also used to com-plete the general description of medicanes. Synoptic ob-servations and obob-servations derived from satellite measure-ments have been used. Synoptic observations have been taken from BUFR files from ECMWF (pilot and surface ob-servations). Records within a 1000 km radius from the
cloud-S-N W-E
X
S-N W-EX
S-N W-EX
S-N W-EX
Fig. 4. QuikSCAT satellite wind derived field (every 2 grid points) on 13/12/05 at 17:30 UTC (top left), 15/12/05 at 14:18 UTC (top right),
15/12/05 at 17:06 UTC (bottom left) and 16/12/05 at 03:54 UTC. Big cross shows centre position of the 961007 medicane on corresponding time observed from Meteosat satellite images. Missed wind derived values correspond with heavy precipitation zones or areas out of the satellite range.
eye position have been selected from this database. Due to the maritime characteristics of the medicanes, the infor-mation obtained has been very sparse. However, maximum and minimum values showed characteristics of tropical sys-tems (see Table 2). Wind speeds measurements confirmed the tropical storm strength of the medicanes. The lack of synoptic observations over the sea has been alleviated by the use of SSMI or QSCAT satellite-sensors information (SSMI source). Wind derived from satellite images above the sea is obtained. These sensors on board polar-orbiting
satel-lites can measure wind speed remotely from the analysis of the sea roughness in the microwave radiative spectrum area. These data and more information about the sensors and tech-niques are freely available via the web page (www.ssmi.com) from the Remote Sensing System enterprise. Remote wind speed measures have 25 km spatial resolution over open sea and covers a range of wind speeds from 0 to 33 m/s for ssmi (50 m/s on QuikSCAT). See satellite-derived wind for 051215 event on Fig. 4.
3 Cloud model simulations
A modified version of the axisymmetric, nonhydrostatic, cloud-resolving model of Rotunno and Emanuel (1987) is used. The model has been modified to insure global energy conservation, including dissipative heating. Any develop-ment in such a model must occur owing to Wind-Induced Surface Heat Exchange (WISHE), since baroclinic instabil-ity is absent in axisymmetric geometry. The model is run with a radial grid size of 3.75 km and vertical level separa-tion of 300 m. The model is initialised with a weak vortex (described by an overall radial size and a radius of maximum azimuthal wind) and a vertical sounding. A vertical sounding is used to determine the initial condition of the atmosphere. It is applied to all the radial grid points of the model. Conse-quently, an initial horizontally homogeneous environment is established. From gradient balance, the pressure distribution is established. The reader is referenced to bibliography for more details (Emanuel, 1986; Rotunno and Emanuel, 1987). The control simulation for all the cases covers a 10-day period and the outer radius of the model is set at 1000 km. The initial vortex had an overall radial dimension of 100 km width, and a maximum wind speed of 5 m/s at 25 km radial distance from the centre. This vortex specification is as-sumed to be close to the initially weak vortexes observed in the satellite images. Initial atmospheric conditions are taken from ECMWF analyses. A synthetic atmospheric sounding is interpolated from ECMWF analysis 24 h before the eye formation at the central storm position (see Fig. 5). General atmospheric conditions are presented in Table 3. Sea sur-face temperature is also obtained from the ECMWF analyses. ECMWF SST is based on daily NCEP SST analyses gen-erated from ship, buoy and satellite observations (see more information on ECMWF web page http://www.ecmwf.int).
General results from the cloud resolving model emphize the potentiality of the environments to support medicanes, but the simulation features are in low agreement with ob-servations. Generally, the model simulations overestimate storms characteristics (see Figs. 6 and 7, as example for all the cases). Simulated storms become much stronger than the observed ones, having deeper cores, stronger winds and wider eye structures. Moreover, simulated storms form and evolve more slowly than the observed ones and do not show any signs of dissipation over the ten-day period.
A numerical evaluation is carried out comparing the winds derived from satellite measurements (SSMI or QUICKSCAT) to the simulated ones. The radial distribu-tion of the winds is divided in radial secdistribu-tions about 12.5 km. For each section an average wind speed is calculated. Nu-merical simulations overestimate storm strength. In order to obtain a more adequate intercomparison, wind values are not taken when the simulated storm is steady state. Simu-lated wind values are taken at different time-steps accord-ing to the time when maximum wind speeds are reached and are maintained above different thresholds. It has been taken
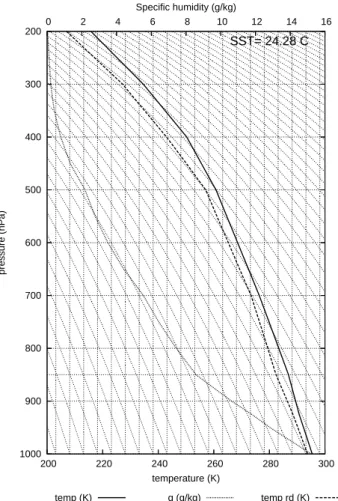
200 300 400 500 600 700 800 900 1000 200 220 240 260 280 300 0 2 4 6 8 10 12 14 16 pressure (hPa) temperature (K) Specific humidity (g/kg) SST= 24.28 C temp (K) q (g/kg) temp rd (K)
Fig. 5. synthetic sounding from ECMWF analysis used to simulate
the environment labelled “960912”. bottom x-axis temperature (K), y-axis pressure (hPa), top x-axis water content (g/kg). Dry tem-perature continuous line, dew point temtem-perature dashed line, water content dotted line. SST (Sea Surface Temperature,◦C).
the simulated values at the 4th day of simulation (reached maximum winds about 20 m/s), the 5th day (reached max-imum winds about 25 m/s) and the 6th day (reached maxi-mum winds about 30 m/s). Winds derived from satellite mea-surements are taken when the eye of the storm is observed. A radial distribution of the derived winds is assumed and the distribution is positioned at the centre of the eye. The com-bined results do not show a good agreement between satellite measurements and model results (see Fig. 8). Intensity and decay of the wind profile are underestimated by the model. This disagreement may come from the low satellite grid reso-lution, sparse satellite data, irregular temporal resolution due to the polar orbit tracks, the failure of the model to simulate the systems adequately and/or subjectivity of the arbitrary choice of the time at which the intercomparison is made.
12 10 8 6 4 2 0 120 100 80 60 40 20 0 Altitude (km) Radius (km) Azimuthal velocity V vmax (5, ms-1) 25 25 12 10 8 6 4 2 0 120 100 80 60 40 20 0 Altitude (km) Radius (km) Perturbation pressure P per. (-2.5, mb) -10 12 10 8 6 4 2 0 120 100 80 60 40 20 0 Altitude (km) Radius (km) 1.8512 m/s 0.062 m/s 12 10 8 6 4 2 0 120 100 80 60 40 20 0 Altitude (km) Radius (km)
Log of Liquid water content
1
1
Log Liq. water (0.2, g Kg-1)
Fig. 6. Simulation results of “960912” storm. x-axis radial distance (km) from storm centre at the left, y-axis height (km). Top left panel:
Azimuthal velocity (every 5 m/s). Top right panel: Pressure anomaly (every, −2.5 hPa). Bottom left panel: Vertical velocity showed by nor-malised vectors, upward vectors (nornor-malised at 0.062 m/s), downward vectors (nornor-malised at 1.8512 m/s). Bottom right panel: Logarithmic liquid water content (every 0.2 g/kg).
4 Sensitivity tests
In order to understand modelled medicane behaviour, sen-sitivity tests are performed. A value of 26◦C is often
indi-cated as the coldest SST at which a hurricane can develop in tropical regions (Emanuel, 1986). As has been shown in the Mediterranean cases (see Table 3), the SST does not show a critical value (e.g.: on 950115 case, the SST obtained
from ECMWF was 15◦C). Obviously, at the “high” latitudes
of the Mediterranean region under preceding cold intrusions at mid-upper levels, the thermodynamic disequilibrium be-tween sea and air can be established with significantly cooler SST values, compared to tropical cases.
To study the sensitivity to the SST, a pair of simulations in which SST has been increased and decreased 5◦C is carried
out. It is assumed that the cloud model is able to produce adequate surface fluxes (in concordance to the new SST) af-ter a “spin-up” time. The study of the sensitivity to the de-gree of convective instability and moisture content is done by increasing and decreasing 30% of the humidity value at each point of the sounding used to initialise the axisymmet-ric model. Previous simulations of tropical cyclones (Ro-tunno and Emanuel, 1987, e.g.) do not show an important dependence on the nature of the initial vortex. However, the Mediterranean cases have smaller dimensions (diameter less than 500 km), for which the size of the initial vortex might play an important role. For this reason, a sensitivity test is also carried out by changing the dimension of the initial vor-tex. In one simulation the initial vortex has been reduced (rmax=15 km, vmax=5 m/s, r0=50 km). In the other
simula-tion, the vortex has been enlarged (rmax=25 km, vmax=5 m/s,
r0=500 km). Another simulation test has been run by chang-ing the surface temperature distribution of the initial vor-tex. From potential vorticity theory, it is known that posi-tive thermal anomalies are associated with a cyclonic move-ment of the air around its area (Hoskins et al., 1985; Thorpe, 1986). Thus, in order to obtain a warmer initial vortex, the initial maximum azimuthal velocity is increased without changing the vortex dimensions (rmax=25 km, vmax=15 m/s,
r0=100 km). Sensitivity tests results will be shown with plots of the evolution of the maximum wind speed at all levels, maximum surface wind speed and potential intensity. Poten-tial intensity is the theoretical maximum wind speed that can attain the steady-state storm according to the air-sea interac-tion theory (Bister and Emanuel, 1998).
For the sake of brevity, only the sensitivity results of the 960912 environment will only be shown. The sensitivi-ties obtained for the 960912 case are quite representative of the sensitivities obtained from the other cases.Sensitivity test simulations results (see Fig. 9) show a high impact of changes in the sea surface temperature. In some cases, the system is not formed when the SST has been cooled 5◦C
(e.g.: 960912 case). When the SST has been increased 5◦C
a much more intense and larger system is obtained, reach-ing hurricane strength (wind speeds faster than 33 m/s). On 960912 when SST has been increase 5◦C, potential intensity
derived from the cloud model simulation is extremely high (maximum wind speeds over 100 m/s). This value would ex-plain a high potentiality of the environment resulting from a combination of the prescribed vertical sounding and the SST. This result should not been taken as a high simulation of the specific storm, but as a mere potential test of the environ-ment. 0 20 40 60 80 100 10 9 8 7 6 5 4 3 2 1 0 Speed (m/S)
Distance from center (km) max. wind
max. sfc. wind Pot. Int.
Fig. 7. Theoretical potential intensity of the storm (solid line).
max-imum wind speed (long dashed line), and maxmax-imum surface wind speed (short dashed line) evolution of the 960912 storm obtained from the model. Day of simulation (x-axis), speed (m/s, y-axis). Simulation obtained from the “control” configuration of the initial vortex; rmax=25 km, vmax=5 m/s, r0=100 km using sounding
plot-ted on Fig. 5.
Changes in the dimension of the initial vortex size had a minor effect on the storm simulations (see Fig. 10). However, a weaker storm is obtained when the initial vortex is smaller. Besides, the storm takes more time to develop (it is assumed that development is reached when the model simulates max-imum wind speeds higher than 20 m/s). With a larger ini-tial vortex, the storm is formed a bit faster and is quite a bit stronger. On changes on the initial weak vortex, significant changes on the self organisation of the system are introduced (Rotunno and Emanuel, 1987). A weaker initial vortex is less able to organise properly convection than a stronger one.
The initial relative humidity has a strong effect on the sim-ulations (see results on Fig. 11). In a dryer environment, the results are not much different from the control simulation. However, a much more intense system is simulated when the humidity is increased. Moreover, the system is formed
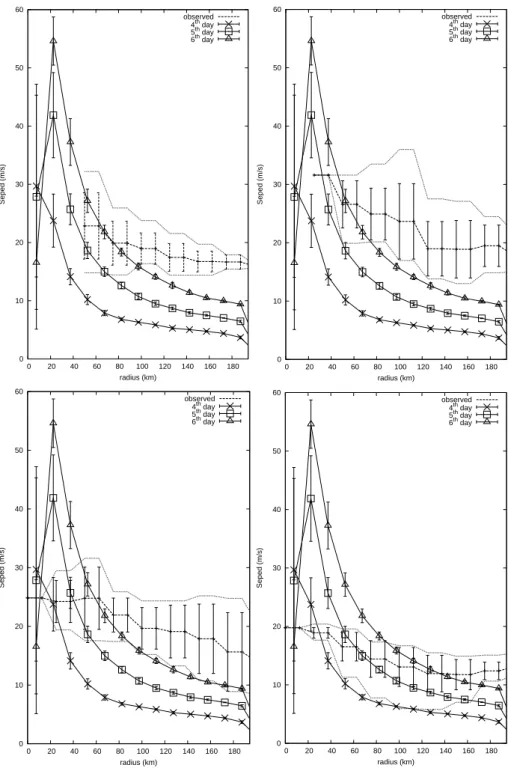
0 10 20 30 40 50 60 0 20 40 60 80 100 120 140 160 180 Seped (m/s) radius (km) observed 4th day 5th day 6th day 0 10 20 30 40 50 60 0 20 40 60 80 100 120 140 160 180 Seped (m/s) radius (km) observed 4th day 5th day 6th day 0 10 20 30 40 50 60 0 20 40 60 80 100 120 140 160 180 Seped (m/s) radius (km) observed 4th day 5th day 6th day 0 10 20 30 40 50 60 0 20 40 60 80 100 120 140 160 180 Seped (m/s) radius (km) observed 4th day 5th day 6th day
Fig. 8. Comparison between radial cloud model simulated wind profile (solid line) at different time steps (4th day, crosses; 5th day, squares;
6th day, triangles) and wind speed satellite derived measurements for 961007 case at different time steps. Each wind speed value is a radial average every 12.5 km from the centre of medicane (on 0 at x-axis, km). Mean speed values (y-axis, m/s). Solid error lines values correspond to simulated results at the time of initial formation of the system. Dashed error lines are satellite derived measurements. Dashed lines above (below) corresponded with the maximum (minimal) wind speed value at the corresponding radii. Satellite measurements on 8/10/96 at 21:00 UTC (top left), 8/10/96 at 18:06 UTC (top right), 9/10/96 at 06:24 UTC (bottom left) and 10/10/96 at 12:00 UTC. In both cases, error bars are calculated as standard deviation from the values used to compute the average.
0 20 40 60 80 100 10 9 8 7 6 5 4 3 2 1 0 Speed (m/S)
Distance from center (km) max. wind max. sfc. wind Pot. Int. 0 20 40 60 80 100 10 9 8 7 6 5 4 3 2 1 0 Speed (m/S)
Distance from center (km) max. wind max. sfc. wind Pot. Int.
Fig. 9. As in Fig. 7, but cooling 5◦C SST (left) and increasing 5◦C Sea surface Temperature (right).
0 20 40 60 80 100 10 9 8 7 6 5 4 3 2 1 0 Speed (m/S)
Distance from center (km) max. wind max. sfc. wind Pot. Int. 0 20 40 60 80 100 10 9 8 7 6 5 4 3 2 1 0 Speed (m/S)
Distance from center (km) max. wind
max. sfc. wind Pot. Int.
Fig. 10. As in Fig. 7, but using a smaller initial vortex (rmax=15 km, vmax=5 m/s, r0=50 km, left) and with a wider initial one (rmax=25 km,
0 20 40 60 80 100 10 9 8 7 6 5 4 3 2 1 0 Speed (m/S)
Distance from center (km) max. wind max. sfc. wind Pot. Int. 0 20 40 60 80 100 10 9 8 7 6 5 4 3 2 1 0 Speed (m/S)
Distance from center (km) max. wind
max. sfc. wind Pot. Int.
Fig. 11. As in Fig. 7, but drying 30% initial vertical relative humidity profile (left) and increasing 30% initial vertical relative humidity
profile (right).
much faster than in the control simulation (2 days instead of 4 days). It is shown that high initial moisture in the atmo-sphere is not a necessary ingredient to generate a medicane in the environment. However, high humidity emphasises and increases the medicane genesis. Finally, sensitivity tests on the core temperature of the initial vortex show a clear influ-ence on the speed of formation of the storm (see Fig. 12). The simulated storm is formed much faster than in the con-trol case. At the same time, a significantly stronger system is simulated. The environments have not been changed. How-ever, changes on the characteristics of the initial vortex pro-duce changes on the formation and organisation processes of the system.
5 MM5 simulations
Two of the events, 950116 and 030527 cases have been sim-ulated with MM5 nonhydrostatic numerical model (Grell et al., 1994). MM5 simulations are used in order to obtain a realistic representation of the main characteristics of the systems. MM5 simulations are carried out with two nested domains (15 and 5 km spatial resolutions) coupled with two way interaction. Due to the high resolution of the second domain, no cumulus scheme is active in that domain. Thus convection and its processes are directly simulated by MM5
primitive equations, as in the previous cloud model simula-tions.
Both cases are quite well simulated by the MM5 model. A clear strong mesoscale vortex appeared during the sim-ulations. This strong vortex and associated strong winds and precipitation showed a similar trajectory as that obtained from satellite images (see Fig. 13). However, a spatial-temporal initial shift between simulated and observed trajec-tories exists. MM5 simulated medicanes also show a pretty similar behaviour to the observed systems. Simulated med-icanes are formed, maintained and weakened in the same manner as the observed ones. Although horizontal resolution is not as high as the horizontal resolution of the cloud resolv-ing model, the radial structure of the medicanes are somehow similar to the theoretical one derived from the axisymmetric cloud resolving model.
MM5 simulations results show relatively good agreement with the expected storm structure. In order to summarise the results, radial average values (located at the center of the storm) averaged during the most intense period of the sim-ulated 950115 storm are plotted (Fig. 14). MM5 simsim-ulated 950116 medicane shows a tropical-like storm structure. The storm presents a warm centre (thermal deviations about 2C in the core). An eye-wall radial structure is reflected by a sat-urated column of air at 20 km from the centre. Time-radial averaged horizontal wind speed reflects also a marked sign
of the wall structure in the sense of strong winds around the storm centre.In general it is also reflected the eye-wall pat-tern on the temporal-radial averaged vertical velocities plot. Moreover it is found a significant sign of subsidence that could indicate the clear cloud eye structure (strong down-drafts about 25 cm/s, at upper levels close to the core of the storm).
6 Conclusions and future work
An analysis of the characteristics and behaviour of the tropical-like Mediterranean storms has been presented in this paper. The study applied a nonhydrostatic, cloud-resolving model used previously to simulate tropical cyclones in order to analyse the potentiality of seven environments in which a tropical-like Mediterranean storm occurred. Observations show that the seven analysed Mediterranean systems are of tropical storm strength. From satellite imagery, a similar morphology to the tropical cyclone systems is also obtained for the medicanes: a clear rounded cloud system, in the cen-tre of which a free cloud zone, like an eye, is formed. Satel-lite imagery showed different trajectories and speeds for the movements of the medicanes. A detailed analysis of this as-pect of the medicanes remains for future work.
Mediterranean systems exhibit notable differences from the tropical ones. Sea surface temperature did not play as significant role as in hurricanes. As noticed in previous work (Emanuel, 2005), high values (>26◦C) of sea surface
tem-perature are not essential, in contrast to hurricanes. Thus, the vertical profile of the atmosphere, defined from the combi-nation of a mid-upper level cold low and a SST-controlled boundary layer, has been shown as one important aspect of medicane formation. Generally, analysed synoptic situations during medicane formation showed significant instability and high precipitable water quantities in the atmospheric column. The cloud model simulates a “theoretical” storm derived from an initial environment. Some assumptions and sim-plifications are implicit in the model. A main point is re-lated to the energy source. It is assumed that the storm will only obtain the energy from the sea surface and related surface fluxes. The axisymmetric cloud-resolving model demonstrates that medicanes can be developed and sustained at least partially by surface enthalpy fluxes, especially if the initial environment is moist. However results showed stronger and larger potential storms in comparison to the observed ones. Simulated wind speeds were significantly stronger, and simulated cloud-eye dimensions were wider. Simulated storms are formed more slowly (mainly 3–4 days) than the “real” ones as revealed by satellite images (mainly 1–2 days). Moreover, Mediterranean observed storms dis-sipated mainly in 2–3 days. Meanwhile, simulated storms were maintained for a longer period (mainly 4–5 days) and some cases did not show any weakening process. These sig-nificant differences are considered to be a sign of the
0 20 40 60 80 100 10 9 8 7 6 5 4 3 2 1 0 Speed (m/S)
Distance from center (km) max. wind
max. sfc. wind Pot. Int.
Fig. 12. As in Fig. 7, but increasing maximum speed of initial
vor-tex (warmer vorvor-tex, vmax=15 m/s).
plex atmospheric processes operating in the Mediterranean systems that the simplified numerical model is not able to resolve. The complex orography, the small dimensions of the basin and the continental influences from the neighbour-ing European and African lands are particular aspects of the Mediterranean which are not present in the largely homoge-neous tropical environments. These aspects will of course modify and limit the evolution of the tropical-like systems in the Mediterranean basin. Besides, the assumptions of the cloud-resolving model do not allow one to take into account baroclinic influences which are prominent in the Mediter-ranean. In some cases, ECMWF analyses showed a signif-icant horizontal thermal gradient in the region of the storm evolution, (e.g.: 950115 case). Tropical-like Mediterranean storms grow and evolve from a combination of deep convec-tion and typical mid-latitude baroclinic processes. The ax-isymmetric cloud-resolving model assumes a homogeneous atmosphere. This assumed background atmosphere is also temporally invariant during the period of simulation. Spatial homogeneous and temporal invariant assumptions are inap-propriate in the Mediterranean basin (Reiter, 1975). Thus, a less restrictive cloud resolving model, in which either a baro-clinic environment or a time-evolving environment could be introduced, is at least necessary in order to produce realistic tropical-like storms in Mediterranean air masses. The MM5 three-dimensional numerical model was applied on two of the events to confirm that hypothesis. The results reflected a
S-N W-E satellite simulated S-N W-E satellite simulated S-N W-E 1020 1020 1016 1016 1016 1012 1012 1008 S-N W-E 1016 1016 1016 1016 1012 1008
Fig. 13. Top panels: MM5 simulated medicane trajectory (dashed line) and satellite derived medicane trajectory (solid line). Case 950116
(top left) 030527 (top right). Bottom panels: Sea level pressure (every 2 hPa), and horizontal wind at 950 hPa (barbs notation) on 16 January 1995 at 00:00 UTC (bottom left), and 27 May 2003 at 00:00 UTC (bottom right).
good agreement with observations and know aspects of these systems, such as warm core, the eye-wall structure and the subsidence at the centre of the storm.
The main results of the sensitivity tests of the environ-ments, which have been computed with the tropical cloud model, showed similar results as the tropical cases. The value of the SST is clearly important for the formation and evolu-tion of medicanes. In the simulaevolu-tions, colder SST inhibited the formation of the medicanes while, warmer SST acceler-ated and enforced the medicane formation. The results of
the simulations in which the size of the vortex was changed were significantly different from the control ones. Stronger and faster systems were formed when the initial vortex was enlarged. The importance of the vertical profile of the atmo-sphere for the medicane formation has been described. The sensitivity tests on the moisture content of the air column showed a deep impact on the formation and the evolution of the storm. Drier air made the formation and the evolution of the storm more difficult, while moister air enforced and accelerated the formation of the storm. Thus, the
charac-400 500 600 700 800 900 1000 90 80 70 60 50 40 30 20 10 0 pressure(hPa) radius(km) Tp (every 0.25, C) 2 2 2 2 2 2 2 2 2 30 40 50 60 70 80 90 100 radius(km) pressure(hPa) RH (%) 90 80 70 60 50 40 30 20 10 0 400 500 600 700 800 900 1000 400 500 600 700 800 900 90 80 70 60 50 40 30 20 10 pressure(hPa) radius(km) 14 12 12 10 10 10 10 10 400 500 600 700 800 900 1000 90 80 70 60 50 40 30 20 10 0 pressure(hPa) radius(km) W (up, 5 cm/s) W (down, 5 cm/s) 25 25 25 25 -25 -25
Fig. 14. Averaged time-radial fields (from the center of the storm) of MM5 simulated 950116 medicane during the period of maximum
intensity (from 15 January 1995 at 16:00 UTC to 16 January 1995 at 05:00 UTC). x-axis (radial distance from the centre of the storm, km), y-axis (pressure, hPa). Top left panel: Thermal anomaly in comparison to a standard OACI atmosphere (lines every 0.25C). Top right panel: Relative Humidity from 30%. Bottom left panel: Horizontal velocity (lines every 0.5 m/s). Bottom right panel: Vertical velocity (lines every 5 cm/s), upward (dashed line), downward (dash-dot line).
teristics of the initial vertical profile of the atmosphere have been shown to be important influences on the evolution and formation of the medicanes. Finally, a warmer initial vor-tex produced a faster and stronger evolution of the simulated storms. This reflects the impact of a faster(slower) organi-sation of the convection induced by a stronger(weaker) rota-tion of the initial vortex (Rotunno and Emanuel, 1987). The good results obtained with MM5, encourages authors to use this kind of primitive equation model simulations in order to complete a more adequate model-based sensitivity test of the medicanes.
Moreover, due to the maritime characteristics of the sys-tems, the lack of observations and records of medicanes im-pedes research on their development. More observations are needed for a correct understanding of medicanes.
Acknowledgement. Support from PRECIOSO/CGL2005-03918/CLI project and PhD grant BES-2003-0696 (both from the Spanish “Ministerio de Educaci´on y Ciencia”) is acknowledged. The fourth author wishes to thanks his hosts for their gracious hospitality during his month-long visit and collaboration. L. Monerris is acknowledged for her comments and support.
Edited by: A. Loukas Reviewed by: two referees
References
Bister, M. and Emanuel, K. A.: Dissipative Heating and Hurricane Intensity, Meteor. Atmos. Physics, 50, 2662–2682, 1998. Campins, J., Genov´es, A., Jans`a, A., Guijarro, J. A., and Ramis,
C.: A catalogue and a classification of surface cyclones for the western Mediterranean, Int. J. Climatol., 20, 969–984, 2000. Emanuel, K.: Tropical Cyclones, Annu. Rev. Earth. Planet. Sci., 31,
75–104, 2003.
Emanuel, K. A.: An Air-Sea Interaction Theory for Tropical Cy-clones. Part I: Steady-State Maintenance, J.Atmos. Sci., 43, 585– 604, 1986.
Emanuel, K. A.: Genesis and maintenance of “Mediterranean hur-ricanes”, Adv. in Geos., 2, 217–220, 2005.
Grell, G., Dudhia, J., and Stauffer, D.: A description of the fifth-generation Penn State/NCAR mesoscale model (MM5), NCAR Technical Note, NCAR/TN-398+STR, 117pp, 1994.
Homar, V., Romero, R., Stensrud, D., Ramis, C., and Alonso, S.: Numerical diagnosis of a small, quasi-tropical cyclone over the western Mediterranean: Dynamical vs. boundary factors, Q. J. R. Meteorol. Soc., 129, 1469–1490, 2003.
Hoskins, B. J., McIntyre, M. E., and W., R. A.: On the use and sig-nificance of isentropic potential vorticity maps, Q. J. R. Meteo. Soc., 111, 877–946, 1985.
Jordan, C. L.: Mean Soundings for the West Indies Area, J. Meteor., 15, 91–97, 1958.
Lagouvardos, K., Kotroni, V., Nickovic, S., Jovic, D., and Kallos, G.: Observations and model simulations of a winter sub-synoptic vortex over the central Mediterranean, Meteorol. Appl., 6, 371– 383, 1999.
Pytharoulis, I., Craig, G. C., and Ballard, S. P.: The hurricane-like Mediterranean cyclone of January 1995, Meteorol. Appl., 7, 261–279, 2000.
Rasmussen, E. and Zick, C.: A subsynoptic vortex over the Mediter-ranean with some resemblance to polar lows, Tellus A, 39, 408– 425, 1987.
Reiter, E. R.: Handbook for Forecasters in the Mediterranean: Weather Phenomena of the Mediterranean Basin, Environmental Prediction Research Facility, Naval Postgraduate School, Mon-terey, CA, 1975.
Romero, R. and Emanuel, K.: Space-time probability density of Mediterranean hurricane genesis in the light of an empirical trop-ical index, 5a Assamble Hispano-Portuguesa de Geodesia y Ge-ofisica, (Spanish), 4, 2006.
Rotunno, R. and Emanuel, K.: An Air-Sea Interaction Theory for Tropical Cyclones. Part II: Evolutionary Study Using a Nonhy-drostatic Axisymmetric Numerical Model, J. Atmos. Sci., 44, 542–561, 1987.
Thorpe, A. J.: Synoptic scale disturbances with circular symmetry, Mon. Wea. Rev., 114, 1384–1389, 1986.
Tudur´ı E. and Ramis, C.: The Enviromments of Significant Con-vective Events in the Western Mediterranean, Weather and Fore-casting, 12, 294–306, 1997.