EcoGRAFI
2nd International Conference on Bio-based Building Materials &
1st Conference on ECOlogical valorisation of GRAnular and FIbrous materials June 21th - 23th 2017
Clermont-Ferrand, France
138
EFFECT OF THE USE OF AUTOCLAVE ON BIO-CONSTRUCTION MATERIALS
H. Elaqra1*, L. Arnaud21 Université of Palestine, Gaza, Palestine 2 Cerema Direction Technique Territoires et Ville, France
*Corresponding author; e-mail: helaqra@gmail.com
Abstract
The paper discusses the use of autoclave as acceleration method for increasing the strength of bio-construction materials. Three mixes where studied, they were prepared in order to have a CaO/SiO2
around 1. Hemp fibers were mixed with three different binder, Lime and silica fume mix (CaO/SiO2 = 1),
cement and silica fume mix (CaO/SiO2 = 0,96) and cement, silica fume and lime mix (CaO/SiO2 = 0,95).
Two curing temperature (110°C, 130°C and 180°C) used. The results show an increase of the strength of lime and silica fume mix from 0,5MPa to 4,4Mpa after autoclave at 110°C. While the cement and silica fume has an increase from 0,8Mpa to 1,5Mpa after autoclave at 110°C. The same mixes at autoclave 180°C show smaller increase in strength than autoclave at 110°C.
Keywords:
Hemp, lime, silica fume, cement, autoclave, compressive strength
1 INTRODUCTION
Concrete is among the least expensive materials we use around the world. However, the production of one tone of cement emits about 700-900 kg of CO2 and
other greenhouse gases (GHGs), which menace the stability of the planet.
In 2008, cement makers through World Business Council for Sustainable Development recognized the urgency to reduce CO2 emissions from cement
industries and requested the International Energy Agency (IEA) to evaluate long term options to lower the environmental impact. Improving energy efficiency, use of alternative fuels, use of alternative material to clinker and capture of CO2 emissions were the main
strategies considered. Where the main source of CO2
in cement production comes from the decomposition of limestone and emits CO2 (CaCO3 → CaO + CO2).
Therefore, hemp concrete can represent a sustainable solution which respects the environment demands. The compressive strength of hemp concrete is very low it is less than 2 MPa (1, 8-14), which is conceders as a negative property for this type of concrete. Many factors plays a role on the compressive strength if mixes prepared with hemp. The density is considered as a determinant factor in the increase of the compressive strength, higher density mix has higher compressive strength, mix with density 1,2g/cm3 its in the order of 1,8Mpa (1) while density of 0,8g/cm3 give higher strength 0,8MPa (2).
The mix composition represent second factor which has a direct relation with the compressive strength, the presence of cement in mix increase the compressive strength (5). An increase of cement from 29 to 50%
(weight) doubled compressive strength (4). The third factors is the relative humidity has a role on the increase of the compressive strength, the mix with 50RH give higher strength 0,35MPa (7).
In order to ameliorate this property the use of autoclaved cycle can be used to increase the compressive strength. Whoever, the choice of curing temperature is governed with the change on the microstructure of binder. Changes can be occurred from CSH and CH to crystalline form tobermorite, which has a higher strength than both structure (CSH and CH) (16). The use of autoclave increase the compressive strength of mix and the higher strength was given for mix with quartz powder less than 2MPa at 190°C autoclaved (15).
Samri shows that hemp concrete presents good hygic properties with comparison with other concrete and has a real economical heat comfort (17). Florence et all. Have shown that hemp concrete has a good thermal behavior which is related to the low thermal conductivity (3).
2 EXPERIMENTAL AND TESTING PROGRAM 2.1 Materials
Hemp from Urika, three type of binder lime Tradical 98 compose of 92,5 of CaO, cement CME52.4 compose from CaO (64%) and SiO2 (29.4%), silica fume type
S95 DS from Condensil, Superplasticizer Adefor 2003 LOM, content from 22% of solid.
Table 1 shows the chemical composition.
ICBBM & ECOGRAFI 2017
139 Tab. 1: chemical composition of materials
CaO (C) SiO2 (S) Lime Tradical 98 92.5 % Silica fume 95 % Cement 64 % 29.4 % 2.2 Test procedures Materials
Three mixes where studied, they were prepared in order to have a CaO/SiO2 around 1. Hemp fibers were
mixed with three different binder, Lime and silica fume mix (CaO/SiO2 = 1), cement and silica fume mix
(CaO/SiO2 = 0,96) and cement, silica fume and lime
mix (CaO/SiO2 = 0,95). Two curing temperature
(110°C and 180°C) used.
Table 2 shows the composition of mixes used in the study, the quantities were calculated for 1M3. The water content was optimizing in order to have workable paste.
Tab. 1 : Composition of mixes
Hemp Lime Cement
Cement 116 0 286
Lime 116 286 0
Lime + cement 116 100 140
The quantity of superplasticizer is 2% of the binder; the water was recalculated as the Superplasticizer has 78% of water. Mixer of 20 liter was used.
Mix proportions and concrete mix design
Samples were casted in cylindrical mold 11*22cm, each sample was casted using 6 increments, using 50N for compacted each one. Samples were conserved at 25°C and 50% of relative humidity (RH) for 24h, and then samples were placed in autoclave for 24h at 30°C. Samples were put in autoclave at wanted temperature.
Autoclave cycle
Three temperatures were used in this study, 110°C, 130°C and 180°C, the speed used for heating is 60°C in 1hour, then the temperature is stabilized for 6h at the curing temperature. Figure 1 shows the temperature cycle of autoclave.
Figure 9: Temperature cycle used by autoclave at 110°C
Figure 2 shows the temperature and the pressure cycle used for autoclave at 180°C. the figure shows two curves, the temperature was noted at the left (in black) and the pressure at the right (in red).
After the cycle the samples were conserved at 50°C and the mass was measured each day until the stabilization, where the mass loss is inferior to 1%.
Mechanical test
MTC machine was used for mechanical test, with 100N/sec speed.
Figure 10: Temperature and Pressure cycle used for autoclave at 180°C
3 RESULT AND DISCUSSIONS 3.1 Density
The initial densities of mixes (after demolded) is reported in table 3, the mixes where the lime was used show higher density than which of cement.
Tab. 2: Densities of mixes used
Density (g/cm3)
Cement + Silca Fume 0.90 ± 0.02
Cement + Lime + Silcia Fume 1.10 ± 0.05
Lime + Silca Fume 1.18 ± 0.02
Figure 3 show the mass loss as a function of conservation time. The mixes autoclaved at 180°C show mass loss stabilization after 15 days in 50°C where mixes at 110°C show a stabilization after 15 days, this can be related to the hydration of binder is faster for mixes at 180°C than at 110°C.
Figure 11: Mass loss as a function of mix and time 3.2 Mechanical tests:
Non autoclaved mixes
Samples were tested after 15 days conservation on 50°C RH. Figure 4 shows the stress train curves for the non-autoclaved mixes, cement, cement + lime, and lime. Cement mixes show higher compressive strength (0,8MPa) than other mixes, lime (0,5MPa) and lime + cement (0,7MPa).
Stress strain curve of cement mix and cement lime show similarity in behavior, it suggested that it comes from the composition, where the cement quantity is comparable thus the hydration product of cement can govern the mechanical behavior. The lime curve shows a lower value of compressive strength which comes from the formation of CaOH which has lower strength than CSH (which comes from cement hydration). 0 20 40 60 80 100 120 0 200 400 600 T e m e ra tu re ( °C) Time (Minutes) 0 2 4 6 8 10 12 10 60 110 160 0 200 400 600 800 Pre s s u re (b a r) T e m p e ra tu re ( °C) Time (Minutes) 1.1 1.2 1.3 1.4 1.5 1.6 1.7 1.8 1.9 0 5 10 15 M a ss (K g ) Time (day) Lime cement
ICBBM & ECOGRAFI 2017
140 Figure 4: Stress Strain curve of non-autoclaved
samples
Table 5 shows the compressive strength and the modulus of elasticity of non-autoclaved mixes.
Tab. 5: Compressive strength and modulus of elasticity of non-autoclaved mixes
Mix Compressive strength (MPa)
Cement 0.78
Cement + Lime 0.71
Lime 0.47
Autoclaved mixes at 110°C:
Figure 5 shows the stress train curves of autoclaved mixes at 110°C, lime mix show higher strength (4,4 MPa) then lime and cement mix (2,8MPa) and the lower strength is done for cement mix (1,5MPa) see table 6. It supposes that the higher strength of lime mix is coming from the reaction between CaOH and SiO2 to form tobermorite which has a higher strength than CH and CSH.
Figure 5: Stress Strain curves of autoclaved mixes at 110 °C
Table 6 shows the compressive strength and the modulus of elasticity of autoclaved mixes at 110°C. The strength values of autoclaved mixes are higher than non-autoclaved mixes.
The strength for autoclaved cement mix is 2 time higher than non-autoclaved one, while autoclaved lime mix shows 10 time higher than non-autoclaved one. The modulus of elasticity of lime mixes is higher for autoclaved mixes than non-autoclaved mixes while it is at the same range for cement mix.
Tab. 6: Compressive strength and modulus of elasticity of autoclaved mixes at 110 °C
Mix Compressive strength (MPa)
Cement 1.47 ± 0.04
Cement + Lime 2.80 ± 0.03
Lime 4.35 ± 0.27
As a result the autoclaved is good tool to increase the strength of mixes where the lime is present.
Autoclaved mixes at 130°C
Figure 6 shows stress strain curves of autoclaved cement and lime mixes at 130°C. The lime curve shows high ductility than cement mix and lower strength. Table 7 shows compressive strength and modulus of elasticity of autoclaved cement and lime mixes.
Figure 6: Stress Strain curves of autoclaved mixes at 130 °C
Tab. 7: Compressive strength and modulus of elasticity of autoclaved mixes at 130 °C
Mix Compressive strength (MPa)
Cement 0.96 ± 0.13
Lime 0.79 ± 0.40
Autoclaved mixes at 180°C
Figure 7 shows the stress strain curves of autoclaved cement and lime mixes at 180°C, both curves show same behavior. Table 8 shows the compressive strength and modulus of elasticity of autoclaved cement and lime mixes at 180°C. Cement mix show two time increase in compressive strength (from 0.72 MPa to 1.8 MPa) while lime mix shows five time increase in compressive strength (from 0.33 MPa to 1.7 MPa).
Figure7: Stress Strain curves of autoclaved mixes at 180 °C
Tab. 8: Compressive strength and modulus of elasticity of autoclaved mixes at 180 °C
Mix Compressive strength (MPa)
Cement 1.80 ± 0.15
Lime 1.68 ± 0.11
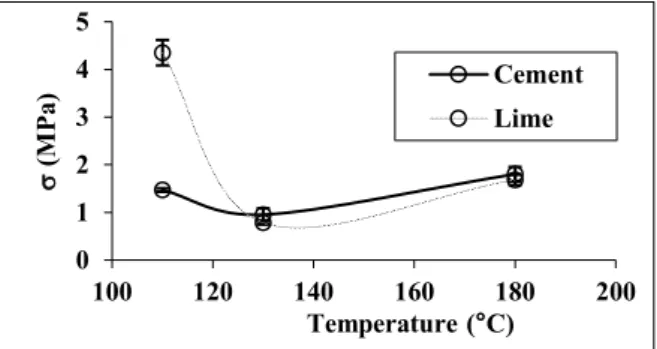
4 CONCLUSION:
Figure 8 show a summary of autoclaved results for cement and lime mixes at 110°C, 130°C and 180°C. Autoclaved lime mix at 110°C shows higher compressive strength while autoclaved mixes at 130°C 0 0.2 0.4 0.6 0.8 1 0 0.02 0.04 0.06 0.08 (M Pa ) Deformation (%) Cement + Lime Cement Lime 0 1 2 3 4 5 0 0.01 0.02 0.03 0.04 0.05 (M Pa ) Déformation (%) Cement + Lime Cement Lime 0 0.2 0.4 0.6 0.8 1 0 0.05 0.1 0.15 0.2 (M Pa ) Deforamtion (%) Lime 130°C Cement 130°C 0 0.5 1 1.5 2 0 0.01 0.02 0.03 0.04 0.05 (M Pa ) Déformation (%) Cement lime
ICBBM & ECOGRAFI 2017
141 show the lower strength. The higher strength can be the result of the formation of more tobermorite in the mix which has higher strength than CSH and CH.
Figure 8: Summary of autoclaved result for cement and lime mixes
5 ACKNOWLEDGMENT:
This work was supported by the ENTPE, Lyon France within a post doc position, collaboration with Laurent Arnaud.
6 REFERENCES
1. [Edward 2010] Edward AJ Hirst1, Peter Walker, Kevin A Paine, and Tim Yates, characterisation of Low Density Hemp-Lime Composite Building Materials under Compression Loading, , second international concference on sutainable materials and technololgies june 28-june 30 2010, universita politecnica delle marche, ancona Italy.
2. [Enrico 2015] Enrico Sassonia, Stefania Manzia,b,, Antonio Motoria,b, Matteo Montecchic, Max Cantid, Experimental study on the physical–mechanical durability of innovative hemp-based composites for the building industry, energy and building 104, 2015, 316-322.
3. [COLLET 2014] Florence COLLET a, Sylvie PRETOT, Thermal Conductivity of hemp concretes variation with formulation density and water content, repport.
4. [Paulien 2008] Paulien de Bruijn, Hemp Concretes Hemp Concretes, Mechanical Properties, using both Shives and Fibres, Thesis Licentiate, Swedish University of Agricultural Sciences, 2008.
5. [Paulien 2009] Paulien Brigitte de Bruijna,*, Knut-Ha˚kan Jeppssona, Kenneth Sandinb, Christer Nilssona, Mechanical properties of lime–hemp concrete containing shives and fibres, Biosystem engineering 103 (2009) 474-479.
6. [Elfordy 2008] S. Elfordy a, F. Lucas a, F. Tancret a,*, Y. Scudeller a, L. Goudet, Mechanical and thermal properties of lime and hemp, concrete (‘‘hempcrete’’)
manufactured by a projection process construction and building materials 22, 2008, 2116-2123.
7. [Arnaud 2012] Laurent Arnaud, Etienne Gourlay, Experimental study of parameters influencing mechanical properties of hemp concrete, construction and building materials 28n 2012, 50-56.
8. [Bütschi 2004] P.Y. Bütschi, Utilisation du chanvre pour la prefabrication de cements de la construction, Moncton University, Moncton, Canada, 2004. PhD Thesis.
9. [Eires 2006] R. Eires, P. Nunes, R. Fangueiro, S. Jalali, A. Cameos, New eco-friendly hybrid composite materials for civil construction, in: Proceedings European Confer- ence on Composite Materials, May, 2006. Biarritz.
10. [Elfordy 2008] S. Elfordy, F. Lucas, F. Tancret, Y. Scudeller, L. Goudet, Mechanical and thermal properties of lime and hemp concrete (« hempcrete ») manufactured by a projection process, ConstrBuild Mater 22 (10) (2008) 2116e2123.
11. [Bruijn 2009] P.B. Bruijn, K.H. Jeppsson, K. Sandin, C. Nilsson, Mechanical properties of lime e hemp concrete containing shives and fibres, Biosyst. Eng. 103 (2009) 474e479.
12. [Arnaud 2011] L. Arnaud, E. Gourlay, Experimental study of parameters influencing mechanical properties of hemp concrete, Constr. Build. Mater 28 (2011) 50e56.
13; [Kioy 2005] S. Kioy, Lime-hemp composites: compressive strength and resistance to fungal attacks. MEng dissertation, University of Bath, 2005, recalled in appendix 1: Resistance to compression and stress-strain properties, in: R. Bevan, T. Woolley (Eds.), Hemp Lime Construction, a Guide to Building with Hemp Lime.
14. [Pavía12015] Pavía, R. Walker, J. McGinn, Effect of testing variable on the hydration and compressive strength of lime hemp concretes. 1rst international
conference of bio based building materils june 22th-24th 2015, Clermont ferrnad France.
15. [MAUPETIT 2005] MAUPETIT Mathieu, Rapport de DEA, Développement de briques autoclavées à base de particules végetales, ENTPE 2005 master these.
16. [VILLAIN 1997] VILLAIN, G., « Caractérisation de la prise de matériaux à base de ciment par propagation d’ondes acoustiques et ultrasonores », Thèse : I.N.S.A. Lyon, Génie Civil : Sols, Matériaux, Structures, Physique du Bâtiment, 1997, 328 p 17. [SAMRI 2004] SAMRI, D., « Contribution au comportement hygrothermique de deux matériaux de construction », DEA Génie Civil : Ecole MEGA, 2004, 86p. 0 1 2 3 4 5 100 120 140 160 180 200 (M Pa ) Temperature (°C) Cement Lime