HAL Id: inserm-00267772
https://www.hal.inserm.fr/inserm-00267772
Submitted on 28 Mar 2008
HAL is a multi-disciplinary open access
archive for the deposit and dissemination of
sci-entific research documents, whether they are
pub-lished or not. The documents may come from
teaching and research institutions in France or
abroad, or from public or private research centers.
L’archive ouverte pluridisciplinaire HAL, est
destinée au dépôt et à la diffusion de documents
scientifiques de niveau recherche, publiés ou non,
émanant des établissements d’enseignement et de
recherche français ou étrangers, des laboratoires
publics ou privés.
pregnancy and offspring’s term birth weight: a study
relying on a land-use regression exposure model.
Rémy Slama, Verena Morgenstern, Josef Cyrys, Anne Zutavern, Olf Herbarth,
Heinz-Erich Wichmann, Joachim Heinrich, Lisa Study Group
To cite this version:
Rémy Slama, Verena Morgenstern, Josef Cyrys, Anne Zutavern, Olf Herbarth, et al.. Traffic-related
atmospheric pollutants levels during pregnancy and offspring’s term birth weight: a study relying
on a land-use regression exposure model.. Environmental Health Perspectives, National Institute of
Environmental Health Sciences, 2007, 115 (9), pp.1283-92. �10.1289/ehp.10047�. �inserm-00267772�
Particulate matter (PM) is a major family of atmospheric pollutants (National Center for Environmental Assessment 2004). Fine PM (PM with an aerodynamic diameter < 2.5 µm; PM2.5) and, perhaps to a greater extent,
ultra-fine particles (PM < 0.1 µm) can penetrate the innermost region of the lungs, and a fraction of them can cross the lung epithelium and enter the blood circulation (Kreyling et al. 2002). Several epidemiologic studies have reported associations between PM levels— most often total suspended particles (TSP) and PM < 10 µm in aerodynamic diameter (PM10)—around the maternal home address
during pregnancy with offspring birth weight (reviewed by Glinianaia et al. 2004; Sˇrám et al. 2005). Few studies assessed exposure to PM2.5(Basu et al. 2004; Bell et al. 2007;
Dejmek et al. 2000; Jedrychowski et al. 2004; Parker et al. 2005). Four of these studies reported a decrease in term birth weight in relation to maternal exposure to PM2.5during
pregnancy; exposure was assessed using
individual dosimeters carried 48 hr during pregnancy (Jedrychowski et al. 2004), from the pregnancy-average of the measurements of the air quality monitoring stations within an 8-km radius from the home address (Basu et al. 2004; Parker et al. 2005), or of all the measurement stations located in the county of residence of the woman (Bell et al. 2007).
Fine particles are composed of nonorganic compounds (sulfate, nitrate, ammonium and hydrogen ions, certain transition metals), ele-mental carbon, organic species including poly-cyclic aromatic hydrocarbons (PAHs) and many other families (National Center for Environmental Assessment 2004; Schauer et al. 1999, 2002). Vehicular traffic is one of the major sources of fine particles. Nitrogen dioxide, PM2.5mass concentration, and also
PM2.5absorbance are possible markers of
traf-fic-related pollution (Janssen et al. 2001). More specifically, PM2.5absorbance is a
meas-ure of the blackness of PM2.5, which strongly
depends on the presence of elemental carbon
in PM2.5(Janssen et al. 2001; Kinney et al.
2000). Because elemental carbon represents a major fraction of diesel motor exhausts (Lloyd and Cackette 2001; Schauer et al. 1999), PM2.5 absorbance is considered a sensitive
marker of air pollution due to diesel engines and truck traffic (Janssen et al. 2001; Kinney et al. 2000) and is probably a more sensitive marker of traffic-related pollution than PM2.5
(Cyrys et al. 2003; Kinney et al. 2000; Roemer and van Wijnen 2001). Diesel exhaust (Lloyd and Cackette 2001) has been shown in experi-mental animal studies to be a possible muta-genic agent, to cause allergic and nonallergic respiratory diseases (Krzyzanowski et al. 2005; Pope and Dockery 2006), to be a possible reprotoxicant, and to act as an endocrine dis-ruptor (Takeda et al. 2004; Tsukue et al. 2002; Yoshida et al. 2006). No epidemiologic study has described the association between PM absorbance and birth weight.
With a few exceptions (Choi et al. 2006; Jedrychowski et al. 2004; Wilhelm and Ritz 2003), most epidemiologic studies on the influence of PM or traffic-related pollutants on intrauterine growth restriction relied on birth weight certificates for the collection of birth weight and adjustment factors, whereas expo-sure was assessed from the background moni-toring stations closest to the home address of the mother at the time of delivery. This design
Research
Address correspondence to R. Slama, GSF-Research Center for Environment and Health, Institute of Epidemiology, Ingolstaedter Landstrasse 1, D-85764 Neuherberg, Germany. Telephone: 49 89 3187 4578. Fax: 49 89 3187 3380. E-mail: slama@vjf.inserm.fr.
We thank the Bavarian Environmental Protection Agency (Bayerisches Landesamt für Umweltschutz) for providing the data from the Munich monitoring station. We thank J. Bouyer and B. Ducot for useful comments.
This study was supported by the BFHZ-CCFB (Bavarian-French Center for Universitary Co-operation). The LISA cohort was funded by a grant from BMBF (German Ministry of Research). The air quality measurement campaign was conducted within the TRAPCA project, funded by European Union Environment contract ENV4 CT97-0506.
The authors declare they have no competing financial interests.
Received 3 January 2007; accepted 31 May 2007.
Traffic-Related Atmospheric Pollutants Levels during Pregnancy and
Offspring’s Term Birth Weight: A Study Relying on a Land-Use Regression
Exposure Model
Rémy Slama,1,2,3,4Verena Morgenstern,1Josef Cyrys,1,5Anne Zutavern,1,6Olf Herbarth,7,8Heinz-Erich Wichmann,1,9
Joachim Heinrich,1and the LISA Study Group
1GSF–National Research Center for Environment and Health, Institute of Epidemiology, Neuherberg, Germany; 2INSERM, Institut National de la Santé et de la Recherche Médicale, UMR822, Le Kremlin-Bicêtre, France; 3INED, Institut National des Etudes Démographiques, Paris, France; 4Univ Paris-Sud, Le Kremlin-Bicêtre, France; 5WZU–Environmental Science Center, University Augsburg, Augsburg, Germany; 6Kinderklinik und Kinderpoliklinik in Dr. v. Hauner’schen Kinderspital, Munich, Germany; 7UFZ–Umwelt Forschungszentrum, Human Exposure Research and Epidemiology, Leipzig, Germany; 8University of Leipzig, Medical Faculty, Leipzig, Germany; 9Ludwig-Maximilians University of Munich, Institute of Medical Data Management, Biometrics and Epidemiology, Munich, Germany
BACKGROUND: Some studies have suggested that particulate matter (PM) levels during pregnancy may be associated with birth weight. Road traffic is a major source of fine PM (PM with aero-dynamic diameter < 2.5 µm; PM2.5).
OBJECTIVE: We determined to characterize the influence of maternal exposure to atmospheric
pollutants due to road traffic and urban activities on offspring term birth weight.
METHODS: Women from a birth cohort [the LISA (Influences of Lifestyle Related Factors on the Human Immune System and Development of Allergies in Children) cohort] who delivered a non-premature baby with a birth weight > 2,500 g in Munich metropolitan area were included. We assessed PM2.5, PM2.5absorbance (which depends on the blackness of PM2.5, a marker of
traffic-related air pollution), and nitrogen dioxide levels using a land-use regression model, taking into account the type and length of roads, population density, land coverage around the home address, and temporal variations in pollution during pregnancy. Using Poisson regression, we estimated prevalence ratios (PR) of birth weight < 3,000 g, adjusted for gestational duration, sex, maternal smoking, height, weight, and education.
RESULTS: Exposure was defined for 1,016 births. Taking the lowest quartile of exposure during
pregnancy as a reference, the PR of birth weight < 3,000 g associated with the highest quartile was 1.7 for PM2.5[95% confidence interval (CI), 1.2–2.7], 1.8 for PM2.5absorbance (95% CI,
1.1–2.7), and 1.2 for NO2(95% CI, 0.7–1.7). The PR associated with an increase of 1 µg/m3in
PM2.5levels was 1.13 (95% CI, 1.00–1.29).
CONCLUSION: Increases in PM2.5levels and PM2.5absorbance were associated with decreases in
term birth weight. Traffic-related air pollutants may have adverse effects on birth weight.
KEY WORDS: atmospheric pollution, birth weight, diesel soot, environment, geographic information system, intrauterine growth restriction, particulate matter, pregnancy, reproduction, road traffic, sensitivity analysis. Environ Health Perspect 115:1283–1292 (2007). doi:10.1289/ehp.10047 available via http://dx.doi.org/ [Online 1 June 2007]
has several limitations: Factors known to strongly influence birth weight—such as maternal smoking, weight, or height, not always or accurately available in birth certifi-cates—could not always be controlled for, not allowing researchers to discard confounding (Glinianaia et al. 2004). Exposure misclassifica-tion is also a concern: First, pregnancy is often a time to change address, so the exposure levels around the home address at the time of birth might not match exposure levels around the home address during pregnancy for a number of women. Second, all women living within a distance of up to several kilometers around a monitoring station are assumed to be exposed to the pollutants’ levels measured by the sta-tion. To limit exposure misclassification, one may prefer to exclude women living far away from monitoring stations (Wilhelm and Ritz 2005); however, monitoring stations are often located at places where population density is higher, and hence air pollution levels are higher. Therefore, if unmeasured environmen-tal or social factors influencing birth weight also varied with distance from monitoring sta-tions, selection bias might occur in studies restricted to subjects living close to monitoring stations. This dilemma between exposure mis-classification and possible selection bias could be avoided by using alternative approaches to model exposure, such as land-use regression or dispersion modeling, which allow modeling of fine spatial contrasts in pollution levels in an area considered as a whole, using information on sources of pollution (Nieuwenhuijsen et al. 2006).
Within a cohort conducted in the Munich metropolitan area (Bavaria), we aimed to char-acterize the influence of maternal exposure to PM2.5, PM2.5absorbance, and NO2during
pregnancy on the birth weight of offspring at term, using a land-use regression exposure model and taking into account factors known to influence intrauterine growth.
Methods
Population. In the Munich LISA (Influences
of Lifestyle Related Factors on the Human Immune System and Development of Allergies in Children) birth cohort, women were included after delivery in six obstetric clinics between January 1998 and January 1999. Exclusion criteria for the mother were, among others, immune-related diseases (including dia-betes) and long-term use of medication. Exclusion criteria for the child were birth weight < 2,500 g, gestational duration < 37 completed weeks, congenital malformation, symptomatic neonatal infection, antibiotic medication, and hospitalization or intensive medical care during neonatal period (Gehring et al. 2002). These exclusion criteria had been chosen because the original focus of the cohort was the development of parameters of the
immune system, which might be associated with prematurity or low birth weight. We excluded twin births and women who changed home during pregnancy because we did not know their previous home address, and hence could not define their exposure.
Gestational duration and birth weight were collected from the child’s health records filled in at birth by the clinic’s midwife. Information on behavioral, health, and sociodemographic factors was collected dur-ing an interview with the mother after birth.
The study was approved by the ethics com-mission of the Landesaerztekammer Bavaria and was carried out in accordance with the international guidelines for the protection of human subjects. Parents or guardians of all subjects gave written informed consent.
Exposure model. The exposure model was
a stochastic (land-use regression) model with a temporal component. It builds on the previ-ously described TRAPCA (Traffic-Related Air Pollution and Childhood Asthma) II model (Morgenstern et al. 2007). This model is itself an extension and adaptation to part of the Munich metropolitan area of a model previ-ously developed for Munich to study the rela-tion between air pollutants and chronic respiratory diseases in childhood (Brauer et al. 2003; Gehring et al. 2002).
Spatial component. The TRAPCA II
model (Morgenstern et al. 2007) was built using four 2-week measurement campaigns at 40 background or traffic sites located in the city of Munich (Figure 1A). The measure-ments were conducted between March 1999
and July 2000. PM2.5concentration was
measured using Harvard impactors (Air Diagnostics and Engineering Inc., Naples,
ME, USA); PM2.5absorbance was assessed
from the reflectance of the particulate filters by M43D Smoke Stain Reflectometer (Diffusion Systems Ltd., Hanwell, UK) (Hoek et al.
2002), and NO2concentrations by Palmes
tubes (Cyrys et al. 2000). A quality control procedure for PM2.5and PM2.5absorbance
was conducted (Hoek et al. 2002). For each pollutant, a linear model was fitted with a sub-set of the following geographic characteristics as covariates: distance of measurement site to each type of road, length of each type of road within various buffers around the site, land coverage, population and household density (within a given ZIP code). The model preci-sion was estimated by cross-validation (Morgenstern et al. 2007). The values of the geographic characteristics corresponding to each home address of a woman in the cohort were retrieved using a geographic information system (ArcGIS 9.1; ESRI, Redlands, CA) and the linear models (consisting of a set of covari-ates and the corresponding parameters’ values) defined from the 40 measurement sites were applied to the home addresses.
Temporal component. These spatial
expo-sure estimates are yearly averages that do not allow testing for a higher susceptibility to atmospheric pollutants during a given trimester of pregnancy. To seasonalize our exposure model (i.e., include a temporal component depending on the conception and delivery dates), we applied the temporal variations observed in one background station in Munich operated by the Bavarian Environmental Protection Agency to the exposure estimate. Of the two background stations operating during the study period, one is located 60 m away from a busy road, and one is in a location dis-tant from an impordis-tant source of traffic in the suburbs of Munich (Johanneskirchen station; Figure 1A), which is the one we used to build the temporal component of our model. For NO2, this was done by averaging the NO2
daily mean levels over the pregnancy of each woman, by dividing this average by the average
NO2level during the TRAPCA measurement
campaign from 1999–2000, and multiplying the corresponding coefficient by the NO2
esti-mate from the TRAPCA II spatial model. PM2.5levels were not measured in Munich
during the period corresponding to the preg-nancies of the included mothers. To seasonal-ize the PM2.5estimate, we supposed that
temporal variations in PM2.5were similar to
that in larger PM measured in the background monitoring station. PM10values were available
only from February 2000 onward; values before this date were estimated from the TSP concentration, assuming a conversion factor of 1/1.2 = 0.833 from TSP to PM10(Council of
the European Union 1999). For PM2.5
absorbance, we assumed that temporal varia-tions were parallel to temporal variavaria-tions in NO2. Using the same approach, we also
esti-mated trimester-specific exposure variables.
Relation between exposure and birth weight. Poisson model. All statistical analyses
were conducted using Stata 9.2 statistical pack-age (StataCorp., College Station, TX, USA). Term birth weight was dichotomized using an arbitrary cut-off at 3,000 g. In addition, our
a priori choice was to analyze birth weight as a
continuous outcome, which did not turn out to be associated with air pollutants (data not shown). The exclusion of birth weights < 2,500 g and the relatively low sample size let us a priori discard low birth weight and small for gestational age as relevant health outcomes. Given the relatively high frequency of birth weights < 3,000 g, we chose to avoid estimat-ing odds ratios and estimated prevalence ratios (PR). Because log-binomial models failed to converge, we used a Poisson model (Greenland 2004; Spiegelman and Hertzmark 2005) with a maximum likelihood estimator. Confidence intervals (CIs) were constructed by bootstrap.
Adjustment factors were chosen from
to limit the number of parameters to estimate, we did not retain maternal passive smoking and age as adjustment factors, which modified the estimated PR associated with pollutants by < 5%. The coding of continuous factors was defined using non- and semiparametric model-ing (Slama and Werwatz 2005).
To identify possible windows of suscepti-bility during pregnancy or before its start, we fitted models with trimester-specific exposure variables. Because the trimester-specific expo-sure variables relative to a given pollutant were correlated, we also fitted models adjusted for all trimester-specific variables simultaneously.
Sensitivity analysis. To quantify possible
selection bias due to the noninclusion of children with a birth weight < 2,500 g, we performed a sensitivity analysis using a boot-strap approach (Efron and Tibshirani 1993; Lash and Fink 2003). We expected about 2%
of nonpremature children with a birth weight < 2,500 g (Charles MA, Slama R, personal communication), which would correspond to about 20 extra children in our study of about 1,000 births. At each replication, we drew at random with replacement 20 children among those with a birth weight between 2,500 and 2,750 g, and merged these 20 observations with the original data set including 987 obser-vations with a birth weight > 2,500 g and with no missing data on covariates. We then consti-tuted each bootstrap sample by drawing at random with replacement 1,007 observations from this data set of 1,007 observations. This approach therefore assumed that children with a birth weight < 2,500 g would have been sim-ilar to those with a birth weight between 2,500 and 2,750 g. The Poisson models were estimated from each bootstrap sample. The bootstrap PR corresponded to the median PR observed among 1,000 replications, and the
95% CI to the empirical 2.5th and 97.5th percentiles of the distribution of the PR.
Results
Study population. Among the 1,467
nonpre-mature newborns from the Munich LISA cohort, 1,287 lived in the Munich metropoli-tan area, and 1,284 birth addresses were suc-cessfully geocoded. We excluded the 27 multiple births; among the remaining 1,257 nonpremature singleton live births that occurred in the study area, we excluded 241 births (19%) corresponding to women who had moved out during pregnancy (n = 208) or for whom information on mov-ing was missmov-ing (n = 33). Mean birth weight of included births was 3,440 g (5th, 50th, and 95th percentiles: 2,800, 3,410 and 4,160 g); 142 children had a birth weight < 3,000 g (14.0%). This proportion was 14.9% in the excluded group of 241 births (percentage
Atmospheric pollution and term birth weight
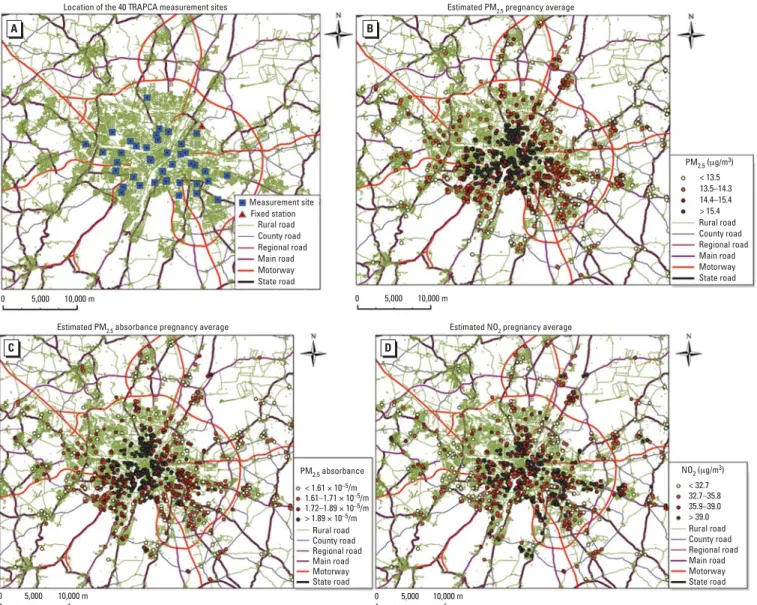
Figure 1. Map of the study area indicating (A) the location of the 40 TRAPCA measurement sites and of Johanneskirchen fixed air quality monitoring station (used
to seasonalize the exposure model), and (B,C,D) the home addresses of the women during pregnancy and the estimated exposure levels (pregnancy averages). (B) PM2.5levels; (C) PM2.5absorbance; (D) NO2levels. To improve readability, the study area furthest from the city center was not represented.
0 5,000 10,000 m C PM2.5 absorbance Rural road County road Regional road Main road Motorway State road < 1.61 × 10⁻⁵/m 1.61–1.71 × 10⁻⁵/m 1.72–1.89 × 10⁻⁵/m > 1.89 × 10⁻⁵/m
Estimated PM2.5 absorbance pregnancy average
0 5,000 10,000 m D Rural road County road Regional road Main road Motorway State road > 39.0 35.9–39.0 32.7–35.8 < 32.7 NO2 (μg/m3)
Estimated NO2 pregnancy average 0 5,000 10,000 m A Measurement site Fixed station Rural road County road Regional road Main road Motorway State road Location of the 40 TRAPCA measurement sites
0 5,000 10,000 m B Rural road County road Regional road Main road Motorway State road < 13.5 13.5–14.3 14.4–15.4 > 15.4 PM2.5 (μg/m3)
comparison test, p = 0.7).The characteristics of the study population are given in Table 1.
Exposure levels. The mean estimated
exposure levels averaged over the whole
preg-nancy (Figure 1B–D) were 14.4 µg/m3for
PM2.5(5th, 50th, and 95th percentiles: 11.8,
14.4, and 16.5 µg/m3), 1.76 × 10⁻⁵/m for
PM2.5absorbance (5th, 50th, and 95th
per-centiles: 1.46, 1.72, and 2.14 × 10⁻⁵/m) and
35.8 µg/m3for NO
2(5th, 50th, and 95th
percentiles: 28.3, 35.8, and 42.5 µg/m3). The
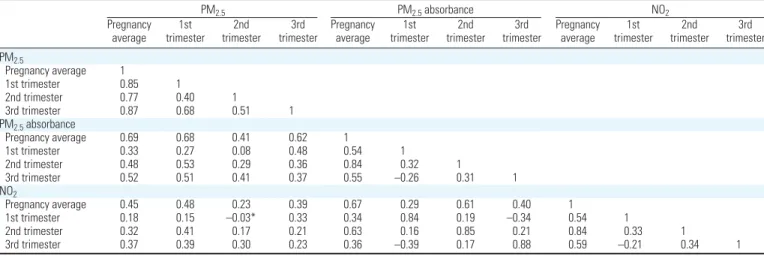
correlation between the estimated pollutants’ levels is given Table 2.
There was no evidence of a difference in exposure levels at the home address at the time of delivery between the included popula-tion and the 241 excluded births (p-value of Student’s t-test of comparison of means > 0.5 for all three pollutants).
Whole pregnancy exposure and term birth weight. The prevalence of birth weights
< 3,000 g was 11.4% in the lowest quartile of
entire pregnancy exposure to PM2.5 and
16.5% in the highest quartile (PR = 1.45; Table 3). After adjustment for the potential confounders, the relative increase in prevalence in the highest quartile was 73% (95% CI, 15 to 169%; Table 3) compared with the lowest quartile of exposure for PM2.5, 78% (95% CI,
10 to 170%) for PM2.5absorbance, and 16%
(95% CI, –29 to 71%) for NO2. The
preva-lence of birth weights < 3,000 g increased on average by 13% for each increment by 1 µg/m3
in PM2.5(95% CI, 0 to 29%), compared with
an increment by 6% without adjustment (Table 3). The prevalence of birth weights < 3,000 g increased by 45% for each increment by 0.5 × 10⁻⁵/m in PM
2.5absorbance (95%
CI, 6 to 87%), and by 21% for each increment
by 10 µg/m3in NO
2levels (95% CI, –14 to
68%). There was no evidence of differences in the effect measure of either PM2.5
concentra-tion or PM2.5absorbance between male and
female newborns (not detailed).
When the pollutants levels were averaged over the 9 months after birth, the estimated increments in the prevalence of birth weight < 3,000 g were lower: 7% for an increase of
1 µg/m3in PM
2.5, (95% CI, –7 to 22%),
18% for an increase of 0.5 × 10⁻⁵/m in PM 2.5
absorbance (95% CI, –16 to 57%), and –2% for an increase of 10 µg/m3in NO
2(95% CI,
–36 to 38%).
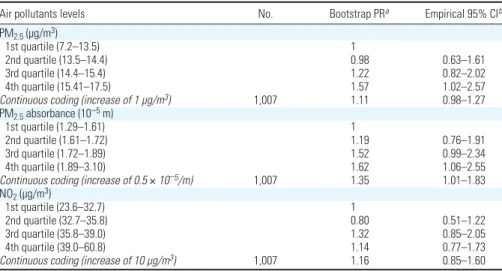
The sensitivity analysis used to study the possible bias due to the exclusion of birth weights < 2,500 g yielded a PR of birth weight < 3,000 g of 1.6 for the highest quar-tile of PM2.5levels and 1.6 for the highest
quartile of PM2.5absorbance (Table 4). Disentangling the effects of the three pollu-tants. When all three pollutants were
simulta-neously adjusted for, the PR associated with NO2decreased < 1, whereas those associated
with PM2.5and PM2.5absorbance exhibited a
relative decrease by about 30–50% (Table 3). In single-pollutant models, when we restricted the analyses to observations with a PM2.5
absorbance level below the median, the PR associated with PM2.5were close to those
observed in the whole population, with broader 95% CI (Figure 2); the PR corre-sponding to an increase of 1 µg/m3in PM
2.5
was 1.15 (95% CI, 0.89 to 1.52). The situa-tion was similar for PM2.5absorbance when we
restricted the analysis to observations with a PM2.5level below the median (data not shown;
PR = 1.67 for an increase of 0.5 × 10⁻⁵/m in
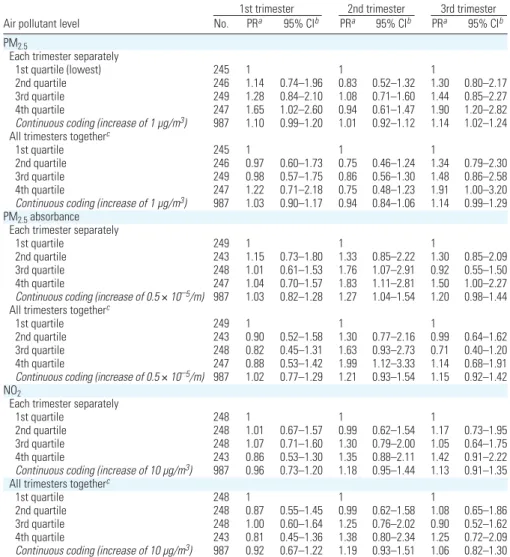
PM2.5absorbance; 95% CI, 0.66 to 3.73). Time windows of sensitivity. PM2.5levels
during the first and third trimesters of preg-nancy were associated with birth weight; when
the three trimester-specific exposure variables were simultaneously adjusted for, only the third-trimester PM2.5levels remained
associ-ated with birth weight (Table 5). Third-trimester PM2.5levels were highly correlated
with the whole pregnancy average (Table 2). In a model simultaneously adjusted for both variables, the PR of birth weight < 3,000 g associated with an increase of 1 µg/m3in
PM2.5whole pregnancy average was close to
unity (PR = 0.96; 95% CI, 0.75 to 1.19), and that associated with PM2.5third-trimester
average varied little (PR = 1.17; 95% CI, 0.98
to 1.40). For PM2.5absorbance,
second-trimester exposure was most strongly associ-ated with birth weight (Table 5); the PR
associated with second-trimester PM2.5
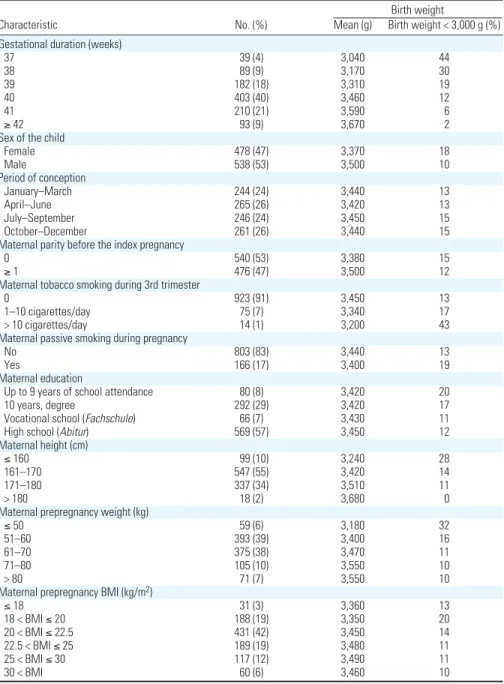
Table 1. Characteristics of the included 1,016 nonpremature singleton births.
Birth weight
Characteristic No. (%) Mean (g) Birth weight < 3,000 g (%) Gestational duration (weeks)
37 39 (4) 3,040 44 38 89 (9) 3,170 30 39 182 (18) 3,310 19 40 403 (40) 3,460 12 41 210 (21) 3,590 6 ≥ 42 93 (9) 3,670 2
Sex of the child
Female 478 (47) 3,370 18 Male 538 (53) 3,500 10 Period of conception January–March 244 (24) 3,440 13 April–June 265 (26) 3,420 13 July–September 246 (24) 3,450 15 October–December 261 (26) 3,440 15
Maternal parity before the index pregnancy
0 540 (53) 3,380 15
≥ 1 476 (47) 3,500 12
Maternal tobacco smoking during 3rd trimester
0 923 (91) 3,450 13
1–10 cigarettes/day 75 (7) 3,340 17
> 10 cigarettes/day 14 (1) 3,200 43
Maternal passive smoking during pregnancy
No 803 (83) 3,440 13
Yes 166 (17) 3,400 19
Maternal education
Up to 9 years of school attendance 80 (8) 3,420 20
10 years, degree 292 (29) 3,420 17
Vocational school (Fachschule) 66 (7) 3,430 11
High school (Abitur) 569 (57) 3,450 12
Maternal height (cm)
≤ 160 99 (10) 3,240 28
161–170 547 (55) 3,420 14
171–180 337 (34) 3,510 11
> 180 18 (2) 3,680 0
Maternal prepregnancy weight (kg)
≤ 50 59 (6) 3,180 32
51–60 393 (39) 3,400 16
61–70 375 (38) 3,470 11
71–80 105 (10) 3,550 10
> 80 71 (7) 3,550 10
Maternal prepregnancy BMI (kg/m2)
≤ 18 31 (3) 3,360 13 18 < BMI ≤ 20 188 (19) 3,350 20 20 < BMI ≤ 22.5 431 (42) 3,450 14 22.5 < BMI ≤ 25 189 (19) 3,480 11 25 < BMI ≤ 30 117 (12) 3,490 11 30 < BMI 60 (6) 3,460 10
absorbance decreased after adjustment for PM2.5absorbance whole pregnancy average
(PR = 1.47; 95% CI, 0.68 to 3.01 for the highest quartile).
The PR corresponding to the exposures during the trimester before pregnancy was close to unity for the three pollutants (not shown).
Discussion
Among a birth cohort of 1,016 nonpremature children from Bavaria, PM2.5mass
concentra-tion and PM2.5absorbance levels around
the maternal home address averaged during pregnancy were associated with an increased risk of birth weight < 3,000 g. Our estimates had large uncertainties, as indicated by the CIs. The PRs of birth weight < 3,000 g associ-ated with PM2.5pregnancy-averaged levels
decreased after adjustment for PM2.5
absor-bance, which might be attributed to either PM2.5absorbance’s explaining a part of the
estimated effect of PM2.5in single-pollutant
models, or to a less efficient estimation of the
respective effects of PM2.5 and PM2.5
absorbance in multipollutant models due to the correlation between both exposure vari-ables. In addition, the PRs of birth weight < 3,000 g associated with PM2.5were similar in the whole population and in the subgroup of subjects with a PM2.5absorbance level
below the median, in which confounding by PM2.5absorbance is less likely (Figure 2).
Although the CIs were much wider in this subgroup, this gives some evidence that the association between estimated PM2.5levels
and birth weight is (at least partly) independent
from the association between estimated PM2.5
absorbance and birth weight.
Comparison with former studies. A study
in two Czech districts highlighted no associa-tion between PM2.5levels averaged over the
whole pregnancy and intrauterine growth restriction. In the most polluted district of Teplice, PM2.5levels during the first
gesta-tional month were associated with intrauter-ine growth restriction (Dejmek et al. 1999,
2000). The fact that PM2.5levels were
assessed at one monitoring station in each district implied that the exposure model captured only temporal but not spatial varia-tions in air pollution. In a cohort study in Poland among 362 nonsmoking women (median personal exposure, 36 µg/m3), an
association between personal PM2.5levels and Atmospheric pollution and term birth weight
Table 2. Coefficient of correlation between the estimated air pollutants’ levels.
PM2.5 PM2.5absorbance NO2
Pregnancy 1st 2nd 3rd Pregnancy 1st 2nd 3rd Pregnancy 1st 2nd 3rd
average trimester trimester trimester average trimester trimester trimester average trimester trimester trimester PM2.5 Pregnancy average 1 1st trimester 0.85 1 2nd trimester 0.77 0.40 1 3rd trimester 0.87 0.68 0.51 1 PM2.5absorbance Pregnancy average 0.69 0.68 0.41 0.62 1 1st trimester 0.33 0.27 0.08 0.48 0.54 1 2nd trimester 0.48 0.53 0.29 0.36 0.84 0.32 1 3rd trimester 0.52 0.51 0.41 0.37 0.55 –0.26 0.31 1 NO2 Pregnancy average 0.45 0.48 0.23 0.39 0.67 0.29 0.61 0.40 1 1st trimester 0.18 0.15 –0.03* 0.33 0.34 0.84 0.19 –0.34 0.54 1 2nd trimester 0.32 0.41 0.17 0.21 0.63 0.16 0.85 0.21 0.84 0.33 1 3rd trimester 0.37 0.39 0.30 0.23 0.36 –0.39 0.17 0.88 0.59 –0.21 0.34 1
*p = 0.31. All other p-values testing equality to 0 are < 0.01.
Table 3. PRs of birth weight < 3,000 g associated with the estimated exposure levels to atmospheric pollutants averaged during the whole pregnancy, among 1,016 children from the LISA cohort born in Munich.
Single-pollutant models Multipollutant modelsa Unadjusted models Adjusted modelsb Adjusted modelsb Air pollutants level No. BW < 3,000 g (%) PR 95% CIc No. PR 95% CIc No. PR 95% CIc PM2.5(µg/m3)
1st quartile (7.2–13.5) 254 11.4 1 247 1 247 1
2nd quartile (13.5–14.4) 254 12.2 1.07 0.65–1.73 242 1.08 0.63–1.82 242 1.01 0.57–1.85
3rd quartile (14.4–15.4) 254 15.8 1.38 0.91–2.09 251 1.34 0.86–2.13 251 1.12 0.64–1.87
4th quartile (15.41–17.5) 254 16.5 1.45 0.92–2.25 247 1.73 1.15–2.69 247 1.36 0.72–2.45
Continuous coding (increase of 1 µg/m3) 1,016 14.0 1.06 0.95–1.19 987 1.13 1.00–1.29 987 1.07 0.91–1.26 PM2.5absorbance (10–5/m)
1st quartile (1.29–1.61) 254 10.6 1 245 1 245 1
2nd quartile (1.61–1.72) 254 12.6 1.19 0.74–1.99 249 1.21 0.73–1.97 249 1.19 0.70–2.01
3rd quartile (1.72–1.89) 254 16.5 1.56 0.98–2.50 247 1.63 0.98–2.57 247 1.55 0.80–2.80
4th quartile (1.89–3.10) 254 16.1 1.52 0.96–2.46 246 1.78 1.10–2.70 246 1.46 0.67–2.90
Continuous coding (increase of 0.5×10⁻⁵/m) 1,016 14.0 1.25 0.90–1.70 987 1.45 1.06–1.87 987 1.33 0.76–2.38 NO2(µg/m3)
1st quartile (23.6–32.7) 254 13.8 1 247 1 247 1
2nd quartile (32.7–35.8) 254 11.0 0.80 0.51–1.24 249 0.80 0.52–1.28 249 0.70 0.43–1.24
3rd quartile (35.8–39.0) 254 17.3 1.26 0.86–1.95 246 1.32 0.86–2.09 246 1.04 0.59–1.79
4th quartile (39.0–60.8) 254 13.8 1.00 0.64–1.58 245 1.16 0.71–1.71 245 0.84 0.47–1.45
Continuous coding (increase of 10 µg/m3) 1,016 14.0 1.07 0.77–1.50 987 1.21 0.86–1.68 987 0.95 0.57–1.64
BW, birth weight.
aTwo separate models were fitted: one including all three pollutants coded in quartiles (dummy variables), the other including all three pollutants as continuous terms. Both models were
adjusted for the covariates noted below. bPRs were adjusted for gestational duration (continuous variable), sex of the child, maternal smoking (continuous variable), parity (0, ≥ 1
previ-ous birth), maternal education, maternal size (broken stick variables with a threshold at 160 cm), and prepregnancy weight (broken stick variables with a threshold at 60 kg). cBootstrap
birth weight adjusted for gestational duration and passive smoking assessed by questionnaire has been reported (Jedrychowski et al. 2004). Exposure had been assessed using active air samplers carried by the woman for two consec-utive days during the second trimester of preg-nancy. From linear regression models in which exposure was log-transformed, Jedrychowski et al. (2004) estimated a decrease by 140 g in mean birth weight when exposure increased from a level of 10 µg/m3up to a level of
50 µg/m3, which on average corresponds to a
decrease by 3.5 g for each increase of 1 µg/m3
in PM2.5exposure. A study in California
among 18,247 children born at 40 weeks’ ges-tation by mothers living < 8 km away from an air monitoring station (Parker et al. 2005) reported an adjusted decrease by 3.8 g in mean birth weight with each increase of 1 µg/m3
in PM2.5pregnancy average (95% CI, 2.2
to 5.5 g). In a study in Connecticut and Massachusetts (USA), an increase of 1 µg/m3
in PM2.5pregnancy average was associated
with an adjusted decrease of 6.7 g (95% CI, 5.6 to 7.8 g) in mean birth weight (Bell et al. 2007). If we assume that the effect of maternal smoking during pregnancy corresponds to a decrease of 10–15 g in birth weight by ciga-rette smoked each day, in these former studies, the effect of smoking one cigarette per day cor-responded to the estimated effect of an increase in PM2.5concentration of 1.5 (Bell et al. 2007)
to 4 µg/m3 (Parker et al. 2005). In our study,
4% of the pregnant women smoked > 5 ciga-rettes/day, and an increase of 10 cigarettes/day in maternal smoking was associated with an increase of 66% in the prevalence of birth weight < 3,000 g (95% CI, 5 to 120%), so that the estimated effect of an increase of 1 µg/m3
in PM2.5corresponded to that of smoking two
to three cigarettes per day. Therefore, the
estimated amplitude of the association between PM2.5and birth weight relative to the effect of
smoking appears bigger in our study than in the former studies; this comparison is, how-ever, limited by the wide CI of our estimates and by the different exposure assessment methodologies, exposure levels, and pollution mix in the compared studies.
Time windows of sensitivity. In the
California study, there was no evidence for the trimester-specific effect estimates of PM2.5(not adjusted for the other trimesters’
levels) to be clearly stronger for one specific trimester (Parker et al. 2005). In the study in Connecticut and Massachusetts, low birth weight was associated with second- and third-trimester PM2.5levels (Bell et al. 2007). In our
study, the strongest associations with birth weight were estimated for the first- and third-trimester PM2.5levels. Our model
simultane-ously adjusted for all trimester-specific exposure variables tended to suggest that a part of the apparent effect of first-trimester exposure was indeed caused by third-trimester exposure. However, we urge caution in inter-preting these results as clear evidence of the existence of a specific window of sensitivity to
PM2.5during pregnancy. Indeed,
third-trimester PM2.5averages happened to be more
strongly correlated with PM2.5pregnancy
averages than were first- and second-trimester PM2.5averages (Table 2; a correlation pattern
driven mainly by the temporal variations in air pollution during the study period). Therefore, the stronger association between PM2.5
third-trimester averages and birth weight (Table 3) than between first- or second-trimester aver-ages and birth weight would also be expected if the whole pregnancy PM2.5average were the
most relevant exposure metric. Similarly, PM2.5absorbance second-trimester average
was the trimester-specific variable most strongly correlated to PM2.5absorbance whole
pregnancy average (Table 2) and also the most strongly associated with birth weight (Table 3). This should not be seen as strong evidence that PM2.5absorbance second-trimester levels
are more detrimental to birth weight than the whole pregnancy average—all the more because the model including both exposure variables did not highlight a clearly stronger association with birth weight for one variable or the other. The temporal pattern of the asso-ciation between trimester-specific NO2
aver-ages and birth weight was similar to that of
PM2.5 absorbance, which was expected
because both pollutants shared the same tem-poral component in our exposure model.
Our results were not in favor of a strong association between preconceptional air pollu-tion levels and birth weight.
Study population. We excluded about
19% of the cohort members living in the Munich metropolitan area, corresponding to subjects who were likely to have changed home address during pregnancy, because we had no information on their previous addresses. These subjects did not differ from those included in terms of birth weight nor exposure levels at the home address at birth, so this exclusion is unlikely to have entailed a selection bias. Birth weights < 2,500 g may represent about 2% of term births and 10% of infants with birth weight < 3,000 g (Charles MA, Slama R, personal communication); these were not included in the LISA cohort. Our sensitivity analysis tended to indicate that had birth weights < 2,500 g been included, the associations between air pollutant levels and birth weight may have been somewhat weaker, without substantial alteration of the monotonous association. This tends to discard the exclusion of birth weights < 2,500 g as a major source of bias.
Confounding. We controlled for several
fac-tors influencing birth weight, including mater-nal smoking, height, weight, and matermater-nal
Table 4. Sensitivity analysis - Bootstrap PRs of birth weight < 3,000 g and empirical 95% CIs associated with the estimated exposure levels to atmospheric pollutants averaged during pregnancy.
Air pollutants levels No. Bootstrap PRa Empirical 95% CIb PM2.5(µg/m3)
1st quartile (7.2–13.5) 1
2nd quartile (13.5–14.4) 0.98 0.63–1.61
3rd quartile (14.4–15.4) 1.22 0.82–2.02
4th quartile (15.41–17.5) 1.57 1.02–2.57
Continuous coding (increase of 1 µg/m3) 1,007 1.11 0.98–1.27
PM2.5absorbance (10–5m)
1st quartile (1.29–1.61) 1
2nd quartile (1.61–1.72) 1.19 0.76–1.91
3rd quartile (1.72–1.89) 1.52 0.99–2.34
4th quartile (1.89–3.10) 1.62 1.06–2.55
Continuous coding (increase of 0.5×10⁻⁵/m) 1,007 1.35 1.01–1.83 NO2(µg/m3)
1st quartile (23.6–32.7) 1
2nd quartile (32.7–35.8) 0.80 0.51–1.22
3rd quartile (35.8–39.0) 1.32 0.85–2.05
4th quartile (39.0–60.8) 1.14 0.77–1.73
Continuous coding (increase of 10 µg/m3) 1,007 1.16 0.85–1.60
To correct for possible selection bias, children with a birth weight between 2,500 and 2,750 g were oversampled.
aPRs were adjusted for the same variables as in Table 3. Each value corresponds to the median observed over 1,000
boot-strap replications. b2.5th and 97.5th percentiles of the distribution of PR over 1,000 bootstrap replications.
3.0 2.5 2.0 1.5 1.0 0.5 0
1st quartile 2nd quartile 3rd quartile 4th quartile
PM2.5 concentration (quartiles)
PR of birth weight < 3,000 g
All births (n = 987)
PM2.5 absorbance < median (n = 494)
95% CI
Figure 2. Adjusted PRs of birth weight < 3,000 g associated with PM2.5pregnancy average, in the whole population and in the subgroup in which PM2.5absorbance is below the median value.
education. Women with diabetes were excluded, and we checked that passive smok-ing assessed by questionnaire, maternal age, and income entailed no confounding. Adjustment did have an impact on the esti-mated effect of air pollutants coded as contin-uous factors: The relative increase in the prevalence of birth weight < 3,000 g associ-ated with PM2.5doubled after adjustment; it
increased by 80% for PM2.5absorbance. This
increase was not attributed to the exclusion of observations with missing values on an adjust-ment variable (not shown). The factors that, when removed from the adjusted model, entailed the strongest decrease in the PR of birth weight < 3,000 g associated with PM2.5
were maternal height, education, and gesta-tional duration. The fact that the pollutants’ levels averaged over the 9 months after birth tended to be less strongly associated with birth weight than the pregnancy averages could be seen as a further argument that residual confounding is unlikely.
Season of conception was strongly associ-ated with air pollution levels, with
pregnancy-averaged PM2.5levels being highest for
newborns conceived between April and
September, and pregnancy-averaged PM2.5
absorbance being highest for conceptions occurring between July and December. However, we did not treat season as a con-founder. We believed that, apart from chlori-nation by-products in drinking water (Lewis et al. 2006), there is currently little evidence for factors other than atmospheric pollutants varying with season influencing birth weight; this contrasts with studies on air pollution and mortality, in which season can be seen as a confounder because of its effect on mortal-ity partly mediated by factors with strong sea-sonal variations such as temperature or occurrence of influenza epidemics. Moreover, the strong correlation between season and exposure, particularly for the trimester-spe-cific exposure variables, was likely to make the estimates of our regression models adjusted for season instable. In our study, adjustment for season had little influence on the esti-mated effect of pregnancy-averaged exposure: After further adjustment for season of concep-tion, the PRs of birth weight < 3,000 g were 1.68 for the highest quartile of exposure to PM2.5(95% CI, 1.05 to 2.75) and 1.12 for
an increase of 1 µg/m3in PM
2.5(95% CI,
0.97 to 1.28); for PM2.5absorbance, the
cor-responding PRs were 1.72 for the highest exposure quartile (95% CI, 1.08 to 2.73) and 1.38 for an increase of 0.5 × 10⁻⁵/m (95%
CI, 0.96 to 1.86). Adjustment for season had a greater influence on the trimester-specific estimates: After adjustment for season, the PR of birth weight < 3,000 g associated with an increase of 1 µg/m3in third-trimester PM
2.5
levels simultaneously adjusted for other
trimester-specific variables increased to 1.25 (95% CI, 1.04 to 1.50). The mutually adjusted PR associated with an increase of 0.5 × 10⁻⁵/m in PM
2.5absorbance were 0.93 for
first-trimester levels (95% CI, 0.41 to 1.32), 1.14 for second-trimester levels (95% CI, 0.70 to 1.64) and 1.29 for third-trimester lev-els (95% CI, 0.90 to 1.75) and the PR
associ-ated with the highest quartile of PM2.5
absorbance were 0.73 (95% CI, 0.38 to 1.38), 2.45 (95% CI, 1.22 to 4.77), and 1.19 (95% CI, 0.60 to 2.48) for the first-, second-, and third-trimester levels, respectively.
Assessment of exposure to atmospheric pollutants. Temporal component. To study
exposure windows ranging from 3 to 9 months, we added a temporal component to the expo-sure model. In doing so, we made several assumptions. First, we assumed that temporal variations in the considered atmospheric pol-lutants were similar across the metropolitan area. For NO2, the pairwise correlations
between the daily measurements of the seven
background and traffic stations of the local air quality monitoring network ranged from 0.52 to 0.90 (median, 0.75). For PM2.5, Gomisˇcˇek
et al. (2004) reported a correlation of 0.79 in PM2.5daily concentrations between a rural
and an urban site in Vienna over a 1-year period. Because there was no monitoring of PM2.5and PM2.5absorbance in Munich when
the pregnancies took place, we had to assume that temporal variations in PM2.5paralleled
variations in PM10(Gehrig and Buchmann
2003) and that total suspended particles were strongly correlated to PM10(Monn et al.
1995). Finally, we assumed that temporal vari-ations in PM2.5absorbance paralleled
varia-tions in NO2. This assumption is supported
by a coefficient of correlation of 0.83 between
daily PM2.5 absorbance and NO2levels
measured at one monitoring station in Erfurt, Germany, from 2001 to 2002 (Cyrys J, per-sonal communication). Although reasonable, these assumptions are likely to have induced exposure misclassification, which we believe to
Atmospheric pollution and term birth weight
Table 5. Adjusted PRs of birth weight < 3,000 g according to the estimated exposure levels, for trimester-specific exposure windows, among 1,016 singleton children from the LISA cohort.
1st trimester 2nd trimester 3rd trimester Air pollutant level No. PRa 95% CIb PRa 95% CIb PRa 95% CIb PM2.5
Each trimester separately
1st quartile (lowest) 245 1 1 1
2nd quartile 246 1.14 0.74–1.96 0.83 0.52–1.32 1.30 0.80–2.17 3rd quartile 249 1.28 0.84–2.10 1.08 0.71–1.60 1.44 0.85–2.27 4th quartile 247 1.65 1.02–2.60 0.94 0.61–1.47 1.90 1.20–2.82
Continuous coding (increase of 1 µg/m3) 987 1.10 0.99–1.20 1.01 0.92–1.12 1.14 1.02–1.24 All trimesters togetherc
1st quartile 245 1 1 1
2nd quartile 246 0.97 0.60–1.73 0.75 0.46–1.24 1.34 0.79–2.30 3rd quartile 249 0.98 0.57–1.75 0.86 0.56–1.30 1.48 0.86–2.58 4th quartile 247 1.22 0.71–2.18 0.75 0.48–1.23 1.91 1.00–3.20
Continuous coding (increase of 1 µg/m3) 987 1.03 0.90–1.17 0.94 0.84–1.06 1.14 0.99–1.29 PM2.5absorbance
Each trimester separately
1st quartile 249 1 1 1
2nd quartile 243 1.15 0.73–1.80 1.33 0.85–2.22 1.30 0.85–2.09 3rd quartile 248 1.01 0.61–1.53 1.76 1.07–2.91 0.92 0.55–1.50 4th quartile 247 1.04 0.70–1.57 1.83 1.11–2.81 1.50 1.00–2.27
Continuous coding (increase of 0.5×10⁻⁵/m) 987 1.03 0.82–1.28 1.27 1.04–1.54 1.20 0.98–1.44 All trimesters togetherc
1st quartile 249 1 1 1
2nd quartile 243 0.90 0.52–1.58 1.30 0.77–2.16 0.99 0.64–1.62 3rd quartile 248 0.82 0.45–1.31 1.63 0.93–2.73 0.71 0.40–1.20 4th quartile 247 0.88 0.53–1.42 1.99 1.12–3.33 1.14 0.68–1.91
Continuous coding (increase of 0.5×10⁻⁵/m) 987 1.02 0.77–1.29 1.21 0.93–1.54 1.15 0.92–1.42 NO2
Each trimester separately
1st quartile 248 1 1 1
2nd quartile 248 1.01 0.67–1.57 0.99 0.62–1.54 1.17 0.73–1.95 3rd quartile 248 1.07 0.71–1.60 1.30 0.79–2.00 1.05 0.64–1.75 4th quartile 243 0.86 0.53–1.30 1.35 0.88–2.11 1.42 0.91–2.22
Continuous coding (increase of 10 µg/m3) 987 0.96 0.73–1.20 1.18 0.95–1.44 1.13 0.91–1.35 All trimesters togetherc
1st quartile 248 1 1 1
2nd quartile 248 0.87 0.55–1.45 0.99 0.62–1.58 1.08 0.65–1.86 3rd quartile 248 1.00 0.60–1.64 1.25 0.76–2.02 0.90 0.52–1.62 4th quartile 243 0.81 0.45–1.36 1.38 0.80–2.34 1.25 0.72–2.09
Continuous coding (increase of 10 µg/m3) 987 0.92 0.67–1.22 1.19 0.93–1.51 1.06 0.82–1.30
aPR of birth weight < 3,000 g adjusted for the same variables as in Table 3. bBootstrap CIs (bias-corrected and
be minor compared with that which would exist had temporal variations in air pollution been ignored. The original exposure estimates (Morgenstern et al. 2007) were strongly corre-lated with our seasonalized exposure estimates (coefficient of correlation, 0.95 for PM2.5,
0.89 for PM2.5absorbance); their associations
with birth weight were weaker than with our seasonalized model. For example, the PR of birth weight < 3,000 g associated with an increase of 1 µg/m3in PM
2.5levels averaged
during pregnancy was 1.10 (95% CI, 0.94 to 1.27) with the nonseasonalized exposure model (Morgenstern et al. 2007), compared with 1.13 with the seasonalized model. For an increase of 0.5 × 10⁻⁵/m in PM
2.5absorbance,
the PR was 1.31 with the nonseasonalized model (95% CI, 0.91 to 1.80). This may be seen as empirical evidence of the importance of including temporal trends in land-use regression exposure models when short term effects of exposure are expected.
Spatial component. Limitations of our
exposure model are that exposures at the work address and during transport were not taken into account. Moreover, the model made the assumption that outdoor pollutant levels were good approximations of personal exposure. This is the case for NO2for homes without
indoor combustion sources (Cyrys et al. 2000). Concerning PM2.5, a longitudinal
exposure assessment study in Amsterdam, the Netherlands, and Helsinki, Finland, reported median coefficients of correlation between individual exposure and outdoor levels assessed in the vicinity of the home ranging from 0.7 to 0.8 for PM2.5. Higher
correla-tions were observed for the contents in sulfur element and in sulfate ion of PM2.5. For
PM2.5absorbance, coefficients of correlation
between individual exposure and outdoor lev-els of 0.8–0.9 have been reported (Brunekreef et al. 2005). Therefore, in this population, outdoor levels in the vicinity of the home were good markers of individual exposure for PM2.5absorbance levels, and probably also
for PM2.5of outdoor origin. PM2.5of indoor
origin has a different composition and hence possibly different health effects, and thus war-rants separate consideration.
Several facts point toward road traffic as a major source of the pollutants that we assessed: first, the association between PM2.5
absorbance, a sensible marker of traffic-related air pollution (Janssen et al. 2001; Kinney et al. 2000; Roemer and van Wijnen 2001) and birth weight; second, the fact that length of roads in the vicinity of the home address were predictors of the exposure levels (Morgenstern et al. 2007); third, that road traffic accounts for about 60% of PM10emissions in Munich
(Regierung von Oberbayern 2004), a propor-tion that is probably higher for PM2.5
emis-sions. Possible harmful effects of air pollution
due to road traffic on birth weight are further supported by another study (Wilhelm and Ritz 2003) and by the possible effect of PAH on birth weight (Perera et al. 2004a). The respective contributions of gasoline-powered cars, light-duty diesel-powered vehicles, and heavy-duty vehicles in the PM2.5and PM2.5
absorbance levels in the study area cannot eas-ily be distinguished. On a per-vehicle basis, the emission rate of fine PM and elemental carbon increases from light-duty gasoline-powered vehicles to light-duty diesel-gasoline-powered vehicles, heavy-duty vehicles, and nonroad engines such as bulldozers (Lloyd and Cackette 2001). For instance, an average emis-sion rate of 0.8 mg elemental carbon per kilo-meter driven has been reported for a group of catalyst-equipped gasoline-powered cars (Schauer et al. 2002), compared with 56 mg/km for medium-duty diesel trucks (Schauer et al. 1999). However, the overall contribution in elemental carbon in fine PM of each type of vehicle depends on the vehicle mix; because most of the German vehicle fleet is composed of gasoline-powered cars, these may also contribute significantly to the esti-mated PM2.5absorbance levels. In Munich in
2000, 17% of the fleet of 679,000 light-duty vehicles registered in the city was diesel-powered (Munich City Statistical Office, personal communication).
NO2was weakly associated with birth
weight, and any association disappeared after control for PM2.5levels, although the wide CIs
do not allow us to discard an association between NO2levels and birth weight
indepen-dently of PM2.5levels. Assuming that the
asso-ciations observed with PM2.5and PM2.5
absorbance reflected causal effects, the fact that NO2was not clearly associated with birth
weight could be attributed to our exposure model being less accurate for NO2than for the
other pollutants; alternatively, it may also be attributed to NO2being a less sensitive marker
of the pollutants influencing birth weight than PM2.5and PM2.5absorbance. Previous work
on the TRAPCA model for the city of Munich indicated a somewhat greater proportion of variance explained by traffic variables for PM2.5
absorbance (Brauer et al. 2003) than for NO2
and PM2.5(Cyrys et al. 2005).
Statistical modeling. Simulations tend to
indicate that bias in the maximum likelihood estimates of the parameters of a logistic regression model and their variance (“overfit-ting”) may be a concern if there are < 10 events per variable (Harrell 2001; Peduzzi et al. 1996), whereas other researchers con-sider that bias remains infrequent with as few as 5–9 events per variable in the model (Vittinghoff and McCulloch 2007). In our study, the number of cases in the adjusted models was 139, and the number of adjustment variables exceeded 14 in multipollutant models
as well as in models including simultaneously all trimester-specific exposure variables. Thus, if we consider that the conclusions of these simulations (Peduzzi et al. 1996; Vittinghoff and McCulloch 2007) also hold for Poisson regression, one should consider with caution the estimates from our models including all pollutants simultaneously. The use of boot-strap to estimate confidence intervals may have reduced any effect of overfitting.
Possible biological mechanisms. Several
biological mechanisms leading to intrauterine growth restriction have been identified, among which are placental or fetal hypoxia, reduced maternal–placental blood flow, inflammatory processes, genetic (Infante-Rivard et al. 2006) or epigenetic (Miozzo and Simoni 2002) changes, viral infections and endocrine disruption (Kanaka-Gantenbein et al. 2003). Therefore, an effect of air pollu-tants on the placenta, the embryo, the mater-nal immunologic system, or the matermater-nal hypothalamic–ovarian axis might induce intrauterine growth restriction. There is some evidence that atmospheric pollutants reach some of the target organs or interfere with the above-mentioned physiologic systems. For example, exposure to PAHs during pregnancy has been shown to alter maternal serum prog-esterone and estrogen levels, as well as fetal survival in F-344 rats (Archibong et al. 2002), and diesel exhausts are likely to be endocrine disruptors in rodents (Takeda et al. 2004; Tsukue et al. 2002). PM2.5levels might be
associated with altered plasma viscosity (Peters et al. 1997), markers of inflammation such as C-reactive protein (Dubowsky et al. 2006), and blood pressure (Brook 2005) among sus-ceptible human populations. All these effects might influence intrauterine growth; however, pregnant women may differ from these popu-lations in terms of immunologic status, heart rate, plasma viscosity, and insulin resistance (Kaaja and Greer 2005), so that it is unclear whether such possible effects are enhanced or inhibited among pregnant women.
Several compounds of the PAH family are present in particles stemming from road traf-fic (Schauer et al. 1999, 2002). Personal exposure to PAHs (Whyatt et al. 1998) and maternal PAH–DNA adducts (Perera et al. 2004b) have been correlated with the pres-ence of PAH–DNA adducts in umbilical white blood cells. Atmospheric PAH levels have been associated with altered intrauterine growth in some populations (Choi et al. 2006; Dejmek et al. 2000). An association between the presence of PAH–DNA adducts in umbilical white blood cells and birth weight has also been reported in Poland (Perera et al. 1998), but not in Manhattan, New York (Perera et al. 2005).
Tobacco smoke—which contains particles peaking between 0.3 and 0.4 µm in diameter
(Kleeman et al. 1999) and PAHs, among many other families of pollutants—influences intrauterine growth restriction and has been shown to be associated with altered umbilical and uterine artery blood flow (Albuquerque et al. 2004) and altered placental structure and function (Zdravkovic et al. 2005).
Overall, there is therefore suggestive evi-dence that PM2.5and traffic-related air
pollu-tants interfere with several key organs and functions implied in intrauterine growth.
Conclusions
We highlighted an increased prevalence of birth weights < 3,000 g in association with estimated outdoor PM2.5levels and PM2.5
absorbance at the home address of the mother during pregnancy. These associations were monotonous, and unlikely to be attributed to confounding by the main factors known to influence birth weight. This is, to our knowl-edge, the first study on the influence of PM levels on term birth weight that uses a GIS-based land-use regression model to assess exposure, and the first to show that PM2.5
absorbance may be associated with decreases in birth weight. Except for a study among a birth cohort from 1946 (Bobak 2000) and of an ecologic Finnish study (Hansteen et al. 1998), no study had so far been published on populations from Western Europe. Overall, this study indicates that traffic-related air pollutants influence term birth weight.
REFERENCES
Albuquerque CA, Smith KR, Johnson C, Chao R, Harding R. 2004. Influence of maternal tobacco smoking during preg-nancy on uterine, umbilical and fetal cerebral artery blood flows. Early Hum Dev 80:31–42; doi:10.1016/j.earlhumdev. 2004.05.004.
Archibong AE, Inyang F, Ramesh A, Greenwood M, Nayyar T, Kopsombut P, et al. 2002. Alteration of pregnancy related hormones and fetal survival in F-344 rats exposed by inhalation to benzo(a)pyrene. Reprod Toxicol 16:801–808; doi:10.1016/S0890-6238(02)00058-8.
Basu R, Woodruff TJ, Parker JD, Saulnier L, Schoendorf KC. 2004. Comparing exposure metrics in the relationship between PM2.5and birth weight in California. J Expo Anal
Environ Epidemiol 14:391–396; doi:10.1038/sj.jea.7500336. Bell ML, Ebisu K, Belanger K. 2007. Ambient air pollution and low
birth weight in Connecticut and Massachusetts. Environ Health Perspect 115:1118–1125; doi:101289/ehp9759. Bobak M. 2000. Outdoor air pollution, low birth weight, and
pre-maturity. Environ Health Perspect 108:173–176; doi:10.2307/ 3454517.
Brauer M, Hoek G, van Vliet P, Meliefste K, Fischer P, Gehring U, et al. 2003. Estimating long-term average particulate air pollution concentrations: application of traffic indicators and geographic information systems. Epidemiology 14:228–239; doi:10.1097/00001648-200303000-00019. Brook RD. 2005. You are what you breathe: evidence linking air
pollution and blood pressure. Curr Hypertens Rep 7:427–434; doi:10.1007/s11906-005-0037-9.
Brunekreef B, Janssen NA, de Hartog JJ, Oldenwening M, Meliefste K, Hoek G, et al. 2005. Personal, Indoor, and Outdoor Exposures to PM2.5 and Its Components for Groups of Cardiovascular Patients in Amsterdam and Helsinki. Research Report 127. Boston:Health Effects Institute. Choi H, Jedrychowski W, Spengler J, Camann DE, Whyatt RM,
Rauh V, et al. 2006. International studies of prenatal expo-sure to polycyclic aromatic hydrocarbons and fetal growth. Environ Health Perspect 114:1744–1750.
Council of the European Union. 1999. Council directive 1999/30/EC of 22 April 1999 relating to limit values for sul-phur dioxide, nitrogen dioxide and oxides of nitrogen, par-ticulate matter and lead in ambient air. Off J Eur Commun L 163:41–60.
Cyrys J, Heinrich J, Hoek G, Meliefste K, Lewne M, Gehring U, et al. 2003. Comparison between different traffic-related particle indicators: elemental carbon (EC), PM2.5mass, and
absorbance. J Expo Anal Environ Epidemiol 13:134–143; doi:10.1038/sj.jea.7500262.
Cyrys J, Heinrich J, Richter K, Wolke G, Wichmann HE. 2000. Sources and concentrations of indoor nitrogen dioxide in Hamburg (West Germany) and Erfurt (East Germany). Sci Total Environ 250:51–62; doi:10.1016/S0048-9697(00)00361-2. Cyrys J, Hochadel M, Gehring U, Hoek G, Diegmann V,
Brunekreef B, et al. 2005. GIS-based estimation of expo-sure to particulate matter and NO2in an urban area:
sto-chastic versus dispersion modeling. Environ Health Perspect 113:987–992.
Dejmek J, Selevan SG, Benes I, Solansky I, Sˇrám RJ. 1999. Fetal growth and maternal exposure to particulate matter dur-ing pregnancy. Environ Health Perspect 107:475–480; doi:10.2307/3434630.
Dejmek J, Solansky I, Benes I, Lenicek J, Sˇrám RJ. 2000. The impact of polycyclic aromatic hydrocarbons and fine parti-cles on pregnancy outcome. Environ Health Perspect 108:1159–1164; doi:10.2307/3434828.
Dubowsky SD, Suh H, Schwartz J, Coull BA, Gold DR. 2006. Diabetes, obesity, and hypertension may enhance associ-ations between air pollution and markers of systemic inflammation. Environ Health Perspect 114:992–998. Efron B, Tibshirani R. 1993. An Introduction to the Bootstrap.
New York:Chapman & Hall.
Gehrig R, Buchmann B. 2003. Characterising seasonal variations and spatial distribution of ambient PM10and PM2.5
concen-trations based on long-term Swiss monitoring data. Atmos Environ 37:2571–2580; doi:10.1016/S1352-2310(03)00221-8. Gehring U, Cyrys J, Sedlmeir G, Brunekreef B, Bellander T,
Fischer P, et al. 2002. Traffic-related air pollution and res-piratory health during the first 2 yrs of life. Eur Respir J 19:690–698; doi:10.1183/09031936.02.01182001.
Glinianaia SV, Rankin J, Bell R, Pless-Mulloli T, Howel D. 2004. Particulate air pollution and fetal health: a systematic review of the epidemiologic evidence. Epidemiology 15:36–45.
Gomisˇcˇek B, Hauck H, Stopper S, Preining O. 2004. Spatial and temporal variations of PM1, PM2.5, PM10and particle
num-ber concentration during the AUPHEP-project. Atmos Environ 38:3917–3934; doi:10.1016/j.atmosenv.2004.03.056. Greenland S. 2004. Model-based estimation of relative risks
and other epidemiologic measures in studies of common outcomes and in case-control studies. Am J Epidemiol 160:301–305; doi:10.1093/aje/kwh221.
Hansteen IL, Kjuus H, Fandrem SI. 1998. Birth weight and envi-ronmental pollution in the county of Telemark, Norway. Int J Occup Environ Health 4:63–70.
Harrell FE. 2001. Regression Modeling Strategies: With Applications to Linear Models, Logistic Regression, and Survival Analysis. New York:Springer.
Hoek G, Meliefste K, Cyrys J, Lewne M, Bellander T, Brauer M, et al. 2002. Spatial variability of fine particle concentrations in three European areas. Atmos Environ 36:4077–4088; doi:10.1016/S1352-2310(02)00297-2.
Infante-Rivard C, Weinberg CR, Guiguet M. 2006. Xenobiotic-metabolizing genes and small-for-gestational-age births: interaction with maternal smoking. Epidemiology 17:38–46. Janssen NA, Van Vliet P, Aarts FJ, Harssema H, Brunekreef B. 2001. Assessment of exposure to traffic related air pollu-tion of children attending schools near motorway. Atmos Environ 35:3875–3884; doi:10.1016/S1352-2310(01)00144-3. Jedrychowski W, Bendkowska I, Flak E, Penar A, Jacek R,
Kaim I, et al. 2004. Estimated risk for altered fetal growth resulting from exposure to fine particles during preg-nancy: an epidemiologic prospective cohort study in Poland. Environ Health Perspect 112:1398–1402. Kaaja RJ, Greer IA. 2005. Manifestations of chronic disease
during pregnancy. JAMA 294:2751–2757; doi:10.1001/ jama.294.21.2751.
Kanaka-Gantenbein C, Mastorakos G, Chrousos GP. 2003. Endocrine-related causes and consequences of intrauter-ine growth retardation. Ann NY Acad Sci 997:150–157; doi:10.1196/annals.1290.017.
Kinney PL, Aggarwal M, Northridge ME, Janssen NA, Shepard P. 2000. Airborne concentrations of PM2.5and diesel
exhaust particles on Harlem sidewalks: a community-based pilot study. Environ Health Perspect 108:213–218; doi:10.2307/3454436.
Kleeman MJ, Schauer JJ, Cass GR. 1999. Size and composition distribution of fine particulate matter emitted from wood burning, meat charbroiling, and cigarettes. Environ Sci Technol 33:3516–3523; doi:10.1021/es981277q.
Kreyling WG, Semmler M, Erbe F, Mayer P, Takenaka S, Schulz H, et al. 2002. Translocation of ultrafine insoluble iridium particles from lung epithelium to extrapulmonary organs is size dependent but very low. J Toxicol Environ Health A 65:1513–1530; doi:10.1080/00984100290071649.
Krzyzanowski M, Kuna-Dibbert B, Schneider J, eds. 2005. Health Effects of Transport-related Air Pollution. Copenhagen: World Health Organization, Regional Office for Europe. Lash TL, Fink AK. 2003. Semi-automated sensitivity analysis to
assess systematic errors in observational data. Epidemiology 14:451–458; doi:10.1097/01.EDE.0000071419.41011.cf. Lewis C, Suffet IH, Ritz B. 2006. Estimated effects of disinfection
by-products on birth weight in a population served by a single water utility. Am J Epidemiol 163:38–47; doi:10.1093/ aje/kwj009.
Lloyd AC, Cackette TA. 2001. Diesel engines: environmental impact and control. J Air Waste Manag Assoc 51:809–847. Miozzo M, Simoni G. 2002. The role of imprinted genes in fetal
growth. Biol Neonate 81:217–228; doi:10.1159/000056752. Monn C, Braendli O, Schaepi G, Schindler C,
Ackerman-Liebrich U, Leueunberger P, et al. 1995. PM10 and total suspended particulates (TSP) in urban, rural and alpine air in Switzerland. Atmospheric Environ 29:2565–2573; doi:10.1016/1352-2310(95)94999-U.
Morgenstern V, Zutavern A, Cyrys J, Brockow I, Gehring U, Koletzko S, et al. 2007. Respiratory health and individual estimated exposure to traffic-related air pollutants in a cohort of young children. Occup Environ Med 64:8–16; doi:10.1136/oem.2006.028241.
National Center for Environmental Assessment. 2004. Air Quality Criteria for Particulate Matter. Research Triangle Park, NC:U.S. Environmental Protection Agency. Nieuwenhuijsen M, Paustenbach D, Duarte-Davidson R. 2006.
New developments in exposure assessment: the impact on the practice of health risk assessment and epidemio-logical studies. Environ Int 32:996–1009; doi:10.1016/ j.envint.2006.06.015.
Parker JD, Woodruff TJ, Basu R, Schoendorf KC. 2005. Air pol-lution and birth weight among term infants in California. Pediatrics 115:121–128.
Peduzzi P, Concato J, Kemper E, Holford TR, Feinstein AR. 1996. A simulation study of the number of events per variable in logistic regression analysis. J Clin Epidemiol 49:1373–1379; doi:10.1016/S0895-4356(96)00236-3.
Perera FP, Rauh V, Whyatt RM, Tsai WY, Bernert JT, Tu YH, et al. 2004a. Molecular evidence of an interaction between prenatal environmental exposures and birth outcomes in a multiethnic population. Environ Health Perspect 112:626–630.
Perera FP, Tang D, Rauh V, Lester K, Tsai WY, Tu YH, et al. 2005. Relationships among polycyclic aromatic hydrocar-bon–DNA adducts, proximity to the World Trade Center, and effects on fetal growth. Environ Health Perspect 113:1062–1067.
Perera FP, Tang D, Tu YH, Cruz LA, Borjas M, Bernert T, et al. 2004b. Biomarkers in maternal and newborn blood indi-cate heightened fetal susceptibility to procarcinogenic DNA damage. Environ Health Perspect 112:1133–1136. Perera FP, Whyatt RM, Jedrychowski W, Rauh V, Manchester
D, Santella RM, et al. 1998. Recent developments in molec-ular epidemiology: A study of the effects of environmental polycyclic aromatic hydrocarbons on birth outcomes in Poland. Am J Epidemiol 147:309–314.
Peters A, Doring A, Wichmann HE, Koenig W. 1997. Increased plasma viscosity during an air pollution episode: a link to mortality? Lancet 349:1582–1587; doi:10.1016/S0140-6736(97)01211-7.
Pope CA III, Dockery DW. 2006. Health effects of fine particu-late air pollution: lines that connect. J Air Waste Manag Assoc 56:709–742.
Regierung von Oberbayern. 2004. Luftreinhalteplan für die Stadt München: Bayerisches Staatsministerium für Umwelt, Gesundheit und Verbraucherschutz. Available: http://www.muenchen.de/cms/prod2/mde/_de/rubriken/ R a t h a u s / 7 0 _ r g u / 0 4 _ v o r s o r g e _ s c h u t z / l u f t / p d f / luftreinhalteplan.pdf [accessed 21 October 2006]. Roemer WH, van Wijnen JH. 2001. Differences among black
smoke, PM10, and PM1.0levels at urban measurement
sites. Environ Health Perspect 109:151–154; doi:10.2307/ 3434768.
Schauer JJ, Kleeman MJ, Cass GR, Simoneit BR. 1999. Measurement of emissions from air pollution sources. 2. C1 through C30 organic compounds from medium duty diesel trucks. Environ Sci Technol 3336:1578–1587; doi:10.1021/ es980081n.
Schauer JJ, Kleeman MJ, Cass GR, Simoneit BR. 2002. Measurement of emissions from air pollution sources. 5. C1-C32 organic compounds from gasoline-powered motor vehicles. Environ Sci Technol 36:1169–1180; doi:10.1021/ es0108077.
Slama R, Werwatz A. 2005. Controlling for continuous con-founding factors: non- and semi-parametric approaches. Rev Epidemiol Sante Publique 53:2S65–80.
Spiegelman D, Hertzmark E. 2005. Easy SAS calculations for
risk or prevalence ratios and differences. Am J Epidemiol 162:199–200; doi:10.1093/aje/kwi188.
Sˇrám RJ, Binková B, Dejmek J, Bobak M. 2005. Ambient air pol-lution and pregnancy outcomes: a review of the literature. Environ Health Perspect 113:375–382.
Takeda K, Tsukue N, Yoshida S. 2004. Endocrine-disrupting activity of chemicals in diesel exhaust and diesel exhaust particles. Environ Sci 11:33–45.
Tsukue N, Tsubone H, Suzuki AK. 2002. Diesel exhaust affects the abnormal delivery in pregnant mice and the growth of their young. Inhal Toxicol 14:635–651; doi:10.1080/ 08958370290084548.
Vittinghoff E, McCulloch CE. 2007. Relaxing the rule of ten events per variable in logistic and Cox regression. Am J Epidemiol 165:710–718; doi:10.1093/aje/kwk052. Whyatt RM, Santella RM, Jedrychowski W, Garte SJ, Bell DA,
Ottman R, et al. 1998. Relationship between ambient air
pollution and DNA damage in Polish mothers and newborns. Environ Health Perspect 106(suppl 3):821–826; doi:10.2307/3434196.
Wilhelm M, Ritz B. 2003. Residential proximity to traffic and adverse birth outcomes in Los Angeles County, California, 1994–1996. Environ Health Perspect 111:207–216. Wilhelm M, Ritz B. 2005. Local variations in CO and particulate
air pollution and adverse birth outcomes in Los Angeles County, California, USA. Environ Health Perspect 113:1212–1221.
Yoshida S, Ono N, Tsukue N, Oshio S, Umeda T, Takano H, et al. 2006. In utero exposure to diesel exhaust increased accessory reproductive gland weight and serum testos-terone concentration in male mice. Environ Sci 13:139–147. Zdravkovic T, Genbacev O, McMaster MT, Fisher SJ. 2005. The adverse effects of maternal smoking on the human placenta: a review. Placenta 26(suppl A):S81–86.