HAL Id: hal-02322062
https://hal.archives-ouvertes.fr/hal-02322062
Submitted on 12 Jan 2021
HAL is a multi-disciplinary open access
archive for the deposit and dissemination of
sci-entific research documents, whether they are
pub-lished or not. The documents may come from
teaching and research institutions in France or
abroad, or from public or private research centers.
L’archive ouverte pluridisciplinaire HAL, est
destinée au dépôt et à la diffusion de documents
scientifiques de niveau recherche, publiés ou non,
émanant des établissements d’enseignement et de
recherche français ou étrangers, des laboratoires
publics ou privés.
renal tubular epithelial cells
Malika Arhatte, Gihan Gunaratne, Charbel El Boustany, Ivana Kuo, Céline
Moro, Fabrice Duprat, Magali Plaisant, Hélène Duval, Dahui Li, Nicolas
Picard, et al.
To cite this version:
Malika Arhatte, Gihan Gunaratne, Charbel El Boustany, Ivana Kuo, Céline Moro, et al.. TMEM33
regulates intracellular calcium homeostasis in renal tubular epithelial cells. Nature Communications,
Nature Publishing Group, 2019, 10, pp.2024. �10.1038/s41467-019-10045-y�. �hal-02322062�
TMEM33 regulates intracellular calcium
homeostasis in renal tubular epithelial cells
Malika Arhatte
1,13
, Gihan S. Gunaratne
2,13
, Charbel El Boustany
1
, Ivana Y. Kuo
3
, Céline Moro
1
,
Fabrice Duprat
1
, Magali Plaisant
1
, Hélène Duval
1
, Dahui Li
4
, Nicolas Picard
5
, Anais Couvreux
1
,
Christophe Duranton
6
, Isabelle Rubera
6
, Sophie Pagnotta
7
, Sandra Lacas-Gervais
7
, Barbara E. Ehrlich
8
,
Jonathan S. Marchant
9
, Aaron M. Savage
10,11
, Fredericus J.M. van Eeden
11,12
, Robert N. Wilkinson
10,11
,
Sophie Demolombe
1
, Eric Honoré
1,14
& Amanda Patel
1,14
Mutations in the polycystins cause autosomal dominant polycystic kidney disease (ADPKD).
Here we show that transmembrane protein 33 (TMEM33) interacts with the ion channel
polycystin-2 (PC2) at the endoplasmic reticulum (ER) membrane, enhancing its opening over
the whole physiological calcium range in ER liposomes fused to planar bilayers. Consequently,
TMEM33 reduces intracellular calcium content in a PC2-dependent manner, impairs
lyso-somal calcium re
filling, causes cathepsins translocation, inhibition of autophagic flux upon ER
stress, as well as sensitization to apoptosis. Invalidation of TMEM33 in the mouse exerts a
potent protection against renal ER stress. By contrast, TMEM33 does not in
fluence
pkd2-dependent renal cystogenesis in the zebra
fish. Together, our results identify a key role for
TMEM33 in the regulation of intracellular calcium homeostasis of renal proximal convoluted
tubule cells and establish a causal link between TMEM33 and acute kidney injury.
https://doi.org/10.1038/s41467-019-10045-y
OPEN
1Université Côte d’Azur, Centre National de la Recherche Scientifique, Institut national de la santé et de la recherche médicale, Institut de Pharmacologie
Moléculaire et Cellulaire, Labex ICST, Valbonne 06560, France.2Department of Pharmacology, University of Minnesota, Minneapolis, MN 55455, USA.
3Cell and Molecular Physiology Stritch School of Medicine Loyola University Chicago, Maywood, IL 60153, USA.4The State Key Laboratory of
Pharmaceutical Biotechnology, Department of Pharmacology and Pharmacy, The University of Hong Kong, Hong Kong SAR, China.5Laboratory of Tissue Biology and Therapeutic Engineering, UMR 5305 CNRS, University Lyon 1, Lyon 69367, France.6Université Côte d’Azur, LP2M CNRS-UMR7370, Labex ICST, Medical Faculty, Nice 06108, France.7CCMA UFR Sciences, Université Côte d’Azur, Nice 06108, France.8Department of Pharmacology, School of Medicine, Yale University, New Haven, CT 06520-8066, USA.9Department of Cell Biology, Neurobiology and Anatomy, Medical College of Wisconsin, Milwaukee, WI 53226, USA.10Department of Infection, Immunity and Cardiovascular Disease, Medical School, University of Sheffield, Sheffield S102TN, UK. 11The Bateson Centre, University of Sheffield, Sheffield S102TN, UK.12Department of Biomedical Science, University of Sheffield, Sheffield S102TN, UK.
13These authors contributed equally: Malika Arhatte, Gihan S. Gunaratne.14These authors jointly supervised this work: Eric Honoré, Amanda Patel. Correspondence and requests for materials should be addressed to E.Hé. (email:honore@ipmc.cnrs.fr)
123456789
M
utations in the polycystin genes Pkd1 (encoding
poly-cystin-1; PC1) and Pkd2 (encoding PC2) cause
auto-somal dominant polycystic kidney disease (ADPKD),
the most common monogenic disease
1. This is a multisystemic
disease associated with the development of focal cysts in the
kidney, liver and pancreas, as well as arterial structural anomalies
and hypertension. A two hit mechanism was proposed including
one inactivating germinal mutation and an additional event
affecting the level of expression of the second allele (somatic
inactivating mutation or a hypomorphic dosage effect)
1. PC2 is a
member of the Transient Receptor Potential (TRP) ion channel
family (also called TRPP2) made of six transmembrane segments
with a pore (P) domain located between S5 and S6
2,3.
PC2 is targeted to the primary cilium and its ion channel
function within this tiny organelle protruding at the apical side of
tubular epithelial cells was recently demonstrated using patch
clamp recordings
4,5. Ciliary PC2 of mouse inner medullary
col-lecting duct cells mainly conducts monovalent cations, as well
as calcium, is inhibited at negative potentials by high external
calcium concentration (IC
50: 17 mM), but stimulated by a rise in
intracellular calcium (EC
50: 1.3
μM)
4,5.
PC2 is also retained in the endoplasmic reticulum (ER)
through a retention signal in its carboxy terminal domain
6,7.
PC2 was shown to act as a calcium releasing channel activated
by cytosolic calcium (calcium-activated calcium release) at the
ER membrane
7. An EF-hand domain in the cytoplasmic C
ter-minus is proposed to underlie activation of PC2 by cytosolic
calcium
7–11. Single channel recordings of microsomes enriched
ER PC2 fused in planar lipid bilayers show a bell-shaped
dependence on cytoplasmic calcium, with a maximum opening
at 0.3
μM Ca
2+7,10. Additional
findings indicate that PC2
inter-acts with the type I IP
3R to modulate intracellular calcium
signaling
12,13. Calcium
flowing through the IP
3
R is thought to
locally activate PC2, thus amplifying calcium release from the
ER
12,13. Accordingly, calcium transients elicited by vasopressin in
LLC-PK1 cells were greatly enhanced and prolonged when PC2
was overexpressed
7,10. Conversely, PC2 was also shown to lower
ER calcium concentration resulting in decreased IP
3-dependent
responses
14. ER-resident PC2 counteracts the activity of the
cal-cium ATPase by increasing passive calcal-cium leak
14. Accordingly,
knock down of PC2 in renal epithelial cells increases ER calcium
content
14. However, a role for PC2 in ER calcium leak remains
controversial
12. Thus, depending on the gating mode
(calcium-gated or leak) PC2 differentially influences IP
3-dependent
responses
7,14. What regulates PC2 gating at the ER is currently
unknown.
In the present report, we demonstrate in renal proximal
con-voluted tubule (PCT) cells, that the ER conserved transmembrane
protein TMEM33 interacts with PC2, enhancing its channel
activity over the whole physiological cytosolic calcium range in
ER liposomes fused to planar bilayers. Finally, we establish a
functional link between TMEM33 and acute kidney injury (AKI),
while Pkd2-dependent cystogenesis is independent of TMEM33.
Results
TMEM33 is in a complex with PC2 at the ER of PCT cells. Our
previous proteomic
findings indicated a possible biochemical
interaction between PC2 and TMEM33
15. TMEM33 was
co-purified with PC2 (73 peptides identified versus 0 peptide in
control mock conditions), together with IP
3R3 and IP
3R1
15. When
the C-terminal domain of PC2 was truncated (PC2–742X and
PC2–690X), the number of identified TMEM33 peptides dropped
(7 and 6 peptides, respectively). Co-immunoprecipitation
experi-ments performed in PCT cells confirmed that TMEM33 is found
in a complex together with PC2 (Fig.
1
a, b, Supplementary
Fig. 1a). PC2 was specifically immunoprecipitated with both
TMEM33-HA and HA-TMEM33 in stably complemented
TMEM33
−/−cell lines conditionally expressing TMEM33 at levels
(TMEM33-HA/TOP1 and HA-TMEM33/TOP1: 0.55 and 0.15,
respectively when induced with DOX), comparable to its native
physiological expression in WT PCT cells (TMEM33/TOP1: 0.2)
(Supplementary Fig. 1a). Importantly, immunoprecipitation of
TMEM33-HA or HA-TMEM33 with native PC2 was specifically
observed with an anti-HA antibody, and not with control rat
IgG (Supplementary Fig. 1a). Again partial truncation of the PC2
C-terminal domain lowered the interaction with TMEM33
(Fig.
1
a, b). Next, we used the LexA/B42 based Grow’n’Glow
yeast-2 hybrid system to further confirm the interaction (direct or
indirect) between TMEM33 and PC2 (Fig.
1
c). Interaction (i.e.,
yeast growth) was observed between the C terminus of TMEM33
and the N terminus of PC2, as well as between the N terminus of
TMEM33 and the C terminus of PC2 (Fig.
1
c). Of note, TMEM33
N and C termini (as well as the yeast homologues) are predicted
to be both facing the cytosolic side
16–18, although an alternative
topology was also proposed
19. Thus, TMEM33 establishes a
complex molecular interaction with PC2 in renal tubular epithelial
cells. In PCT cells, we observed an obvious co-localization of
TMEM33-GFP with mCherry-PC2 at the ER membrane, using ER
tracker as a specific marker for the ER (Fig.
1
d). HA-TMEM33
visualized in the complemented TMEM33
−/−PCT cell line was
also co-localized with native PC2 at the ER (visualized by calnexin
staining; Supplementary Fig. 5a). Importantly, co-localization was
absent at the primary cilium (Fig.
1
e). PC2 (red
fluorescence, alexa
594) is present at the primary cilium (deep red
fluorescence,
alexa 647), while in the same cells TMEM33 (EGFP) is absent
(although it is visible at the ER; Fig.
1
d, e, Supplementary Fig. 5a).
TMEM33 mRNA, as detected by qPCR, is broadly expressed in
mouse tissues (as previously reported for PC2
20), including the
kidney (Supplementary Fig.1b). Abundance of TMEM33 in renal
tubule cells was confirmed using a TMEM33 LacZ reporter
mouse line (Supplementary Fig. 1c).
Thus, TMEM33 is in a molecular complex with the ion channel
PC2 at the ER membrane, but is absent from the primary cilium.
In this report, we focused on the physiopathological function of
TMEM33 in the kidney. In the next section, we investigated
whether TMEM33 influences the regulation of intracellular
calcium homeostasis through its interaction with PC2.
TMEM33 diminishes IP
3-dependent calcium transients. We
investigated the effect of TMEM33 knock-down on the release
of intracellular calcium in PCT cells. IP
3-dependent ER calcium
release induced by purinergic stimulation in the absence of
extracellular calcium was significantly enhanced when cells were
transfected with two different validated siRNAs directed against
TMEM33 (Fig.
2
a, Supplementary Fig. 2a, Supplementary Fig. 2f,
g, Supplementary Fig. 3c, d). TMEM33 or PC2 knock-down or
knockout experiments were validated both at the mRNA (qPCR
experiments) and protein levels (Western blots)(Supplementary
Fig. 1d and 1g, Supplementary Fig. 2f-j). Of note, knock-down of
TMEM33 did not affect PC2 protein expression, and vice-versa
(Supplementary Fig. 2f-j). Conversely, TMEM33 overexpression
had the opposite effect (Fig.
2
b). Accordingly, the capacitative
calcium entry induced by re-addition of extracellular calcium
during ATP stimulation was enhanced when TMEM33 was
knocked down, but lowered when TMEM33 was overexpressed
(Fig.
2
a, b). Regulation of intracellular calcium homeostasis was
further studied in a conditionally complemented TMEM33
−/−PCT cell line (Fig.
2
c, d). In this cellular model, we used a Tet-on
system allowing an inducible expression of TMEM33 (or
TMEM33-HA or HA-TMEM33 tagged) along with a Cherry
fluorescent reporter in the presence of doxycycline
(DOX)(Sup-plementary Fig. 2e). Control cells were the parental TMEM33
−/−PCT cell expressing the repressor together with a CD8 construct
retained in the ER (CD8ER)
21and treated with DOX, similarly to
the cell line expressing TMEM33 (Fig.
2
d). We isolated a clone
with an inducible TMEM33 expression (i.e. in the presence of
DOX) comparable to the level found in the WT PCT cells
(Fig.
2
c). Again, when TMEM33 expression was enhanced by
DOX addition, the peak ATP response elicited in the absence of
extracellular calcium was blunted, as well as the associated
capacitative calcium entry (Fig.
2
c). Importantly, these effects
were absent in the control CD8ER complemented TMEM33
−/−PCT cell line (Fig.
2
d). Strikingly, in PCT Pkd2
−/−cells TMEM33
knock-down or overexpression failed to affect the ATP response
(Fig.
2
e, f, Supplementary Fig. 1d, Supplementary Fig. 2b). These
findings indicate that TMEM33 impacts the regulation of
intra-cellular calcium homeostasis through PC2.
The SERCA inhibitor thapsigargin does not allow the
discrimination of selective changes in ER calcium content or
number/activity of ER leak calcium channels since both
parameters are linked
14. However, the calcium ionophore
ionomycin in the absence of extracellular calcium allows the
150 75 50 37 150 75 HA-TMEM33 Inputs anti-Myc Inputs anti-HA IB anti-Myc Myc-PC2 742X Myc-PC2 HA-TMEM33 Myc-PC2 742X Myc-PC2 IP anti-HA kDaa
Myc-TMEM33 Myc-TMEM33c
Galactose Glucose Positive control Cterm TMEM33/ Nterm PC2 Nterm TMEM33 / Cterm PC2 GFP GFP 250 130 70 25 Inputs IP anti-HA IB anti-HA IB anti-Myc kDa pcDNA HA-PC2 HA-PC2 742X Myc-TMEM33 HA-PC2 HA-PC2 742X pcDNA HA-PC2 HA-PC2 742X Myc-TMEM33 HA-PC2 HA-PC2 742Xb
e
Acetylated-tubulin+ TMEM33Acetylated-tubulin+ PC2
d
TMEM33 PC2 TMEM33 + PC2
TMEM33 ER tracker TMEM33 + ER tracker
PC2 ER tracker PC2+ ER tracker
Fig. 1 TMEM33 interacts with PC2 at the ER membrane of PCT cells. a Co-immunoprecipitation of TMEM33 with PC2 in PCT cells when TMEM33 is pulled down. A pathologic PC2 deletion mutant PC2–742X was also tested. b Same, but when PC2 is pulled down. Arrowhead indicates TMEM33 and the upper band is non-specific. c Yeast two hybrid experiments indicating an interaction (direct or indirect) between TMEM33 and PC2. We used a yeast strain with chromosomal LEU2 reporter gene harboring LexA operator binding sites. As a second reporter we used GFP under the control of the LexA operator (URA). The bait was either the COOH or NH2 terminus of TMEM33 expressed in frame with LexA (HIS), and the prey was either the COOH or NH2 terminus of PC2 expressed in frame with B42. As a further selection the prey product is only expressed in the presence of galactose. For a positive interaction, the yeast need to grow on medium -HIS-TRP-URA-LEU+ Galactose and light up positive for GFP. As a positive control we used LexA-p53 with B42-LTA. As negative controls, we either expressed the LexA-CtermTMEM33 with the empty prey vector or B42-CtermPC2 with the empty bait vector. No growth was observed with any combination of either prey alone or bait alone.d Top: Co-localization of TMEM33-GFP (green) and mCherry-PC2 (red) in PCT cells; Middle: co-localization of TMEM33-GFP (green) with ER tracker as an ER marker (red); Bottom: co-localization of mCherry-PC2 (red) with ER tracker (green). The merged image (yellow shows co-localization) is shown at the right. False colors were used to consistently illustrate co-localizations in yellow (ER tracker blue). The scale bar corresponds to 20μm. e TMEM33 is absent at the primary cilium, unlike PC2. Acetylated-tubulin in red labels the primary cilia and TMEM33 (top panels) or PC2 (bottom panels) are labeled in green (false colors). Co-localization of PC2 and acetylated tubulin is seen in yellow (merged image; bottom panels). The right panels are magnification of the boxed area shown in the left panels. Arrows indicate primary cilia. The scale bar corresponds to 15μm. Source data are provided as a Source Data file
precise measurement of stored intracellular calcium content
14.
Notably, TMEM33 knock-down significantly increased the release
of calcium from intracellular stores induced by ionomycin in a
PC2-dependent manner (Fig.
2
g, h). A similar
finding was
obtained with the conditional TMEM33 cell line, although not in
the parental CD8 expressing TMEM33
−/−cell line
(Supplemen-tary Fig. 3a, b). Thus, our
findings indicate that TMEM33
controls intracellular calcium homeostasis through PC2. Next,
we investigated whether TMEM33 affects the gating of ER PC2.
TMEM33 stimulates PC2 calcium-dependent activity. PC2 is
strongly upregulated in both acute and chronic kidney
diseases
22–24. In light of these
findings, we investigated the effect
of PC2 overexpression in PCT cells. When PC2 was transiently
overexpressed, an increase in basal cytosolic calcium was
con-sistently observed (Fig.
3
a). Moreover, PC2 overexpression
mildly reduced the peak ATP response (Fig.
3
b). Notably, in this
condition when TMEM33 was knocked down, the basal level
of cytosolic calcium became normalized (Fig.
3
a). Again, in
PCT cells overexpressing PC2, an increase in the ATP response
was detected upon TMEM33 knock-down (Fig.
3
b). Similar
findings were obtained with a PCT cell line stably overexpressing
PC2 (Supplementary Fig. 3c, d). These results are consistent with
a stimulation of PC2 opening by TMEM33. To directly test
this idea, we fused ER enriched microsomes of PCT cells
over-expressing PC2 in planar lipid bilayers and electrophysiologically
recorded channel activity
7. Ba
2+was used as the charge carrier
on the trans (luminal) side, as it does not affect channel activity
on either side of the channel and permeates PC2
7. The open
channel probability showed a bell-shaped dependence on
cyto-plasmic calcium with a maximum observed at 0.3
μM, as
pre-viously reported
10(Fig.
3
c, d). When TMEM33 was co-expressed
with PC2, we observed a prominent increase in channel open
probability across the entire activating calcium range, with no
significant change in single channel current amplitude (Fig.
3
c, d).
The decrease in channel activity expected at the higher calcium
range with PC2 alone was absent when TMEM33 was
over-expressed (Fig.
3
d). Thus, TMEM33 modulates the gating of
PC2 by cytosolic calcium, removing channel inactivation at the
higher cytosolic calcium concentrations.
IP
3R activation drives the calcium refilling of other cellular
organelles, including lysosomes
25–27. Next, we investigated
whether TMEM33 might indirectly influence endolysosomal
calcium content because of an altered IP
3calcium signaling.
TMEM33/PC2 impacts endolysosomal structure and function.
Both TMEM33-HA and HA-TMEM33, as well as native PC2
are found at the ER membrane (Fig.
1
d, Supplementary Fig. 5a),
but are also detected within lysosomes (Supplementary Fig. 5b, c).
We found several lines of evidence that suggest a key role for
the ER TMEM33/PC2 complex on endolysosomal structure
and function. First, endosomes expressing Two-pore channel 1
(TPC1), as well as lysosomes expressing TPC2 were found in close
proximity to the ER (Supplementary Fig. 4a, b). Second, we
mea-sured the amount of calcium stored in lysosomes using the
lyso-somotropic agent glycyl-
L-phenylalanine 2-naphthylamide (GPN)
Δ 0.2 50 s
***
ATP siTMEM33-2 siTMEM33-1 siNTa
0 Ca2+ Pkd2+/+***
50 s Δ 0.2 siTMEM33-2 siTMEM33-1 siNT ATPe
0 Ca2+ Pkd2–/ – Δ 0.2 50 s ATPb
TMEM33 mCherry 0 Ca2+ Pkd2+/+ 50 s Δ 0.2 TMEM33 mCherry ATPf
0 Ca2+ Pkd2–/ –***
c
100 s DOX ATP TMEM33 0 Ca2+ Δ 0.5 30 s siTMEM33-2 siTMEM33-1 siNT Ionomycing
Δ 0.3 0 Ca2+ Pkd2+/ +d
ATP 0 Ca2+ 100 s Δ 0.7 DOX CD8 Δ 0.2 30 s siTMEM33-2 siTMEM33-1 siNT Ionomycinh
0 Ca2+ Pkd2–/ –***
***
***
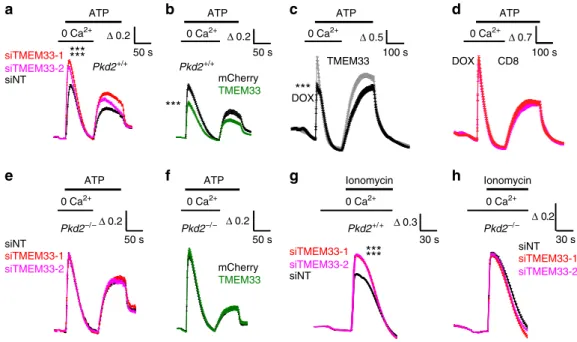
Fig. 2 TMEM33 regulates intracellular calcium homeostasis. a Increases in cytosolic calcium concentration are expressed as ratios of 340:380 nm fluorescence signals (ΔR/R0).ΔR is the fluorescence ratio (340 nm/380 nm) measured at a given time divided by the initial ratio at time 0 (R0). Transfection of PCT cells with two siRNAs directed against TMEM33 increases ATP calcium transients recorded in the absence of extracellular calcium, as compared to the control non-targeting siRNA condition (siNT, n= 684, black symbols; siTMEM33–1, n = 589, red symbols; siTMEM33–2, n = 649, magenta symbols). Re-addition of extracellular calcium during the ATP stimulation elicits a capacitative calcium entry.b Same in PCT cells transiently overexpressing TMEM33 or not (Cherry, n= 244, black symbols; TMEM33, n = 254, green symbols). c Same in a conditional PCT cell line expressing TMEM33 when induced with DOX (black trace; n= 321) or not (gray trace; n = 464). d Same in a conditional PCT line expressing CD8ER in the presence of DOX (magenta trace; n= 181) or not (red trace; n = 266). e Same in Pkd2−/−PCT cells transfected or not with siRNAs against TMEM33 (siNT, n= 764; siTMEM33–1, n = 1025; siTMEM33–2, n = 856). f Same in Pkd2−/−PCT cells overexpressing or not TMEM33 (Cherry, n= 144; TMEM33, n = 141). g Ionomycin calcium transients in PCT cells (Pkd2+/+) bathed in the absence of extracellular calcium and transfected or not with siRNAs against TMEM33 (siNT, n= 1648; siTMEM33–1, n = 11615; siTMEM33–2, n = 1587). h Same in Pkd2−/−PCT cells (siNT, n= 627; siTMEM33–1, n = 769; siTMEM33–2, n = 659). Values are means ± SEM. One star indicates p < 0.05, two stars p < 0.01 and three stars p < 0.001, with a Student’s t test used to evaluate statistical significance. Source data are provided as a Source Data file
(Fig.
4
a, b). Strikingly, TMEM33 significantly attenuated the
amplitude of the GPN response in TMEM33 conditional PCT cells,
unlike in parental TMEM33
−/−PCT cells expressing CD8ER
(Fig.
4
a, b). Moreover, the effect of TMEM33 expression on
lyso-somal calcium load was suppressed when PC2 was knocked down
(Fig.
4
c, d). Third, TMEM33 expression produced an increase in
the size of endolysosomes (Supplementary Fig. 4c–f). Fourth,
TMEM33 conditional expression increased cytosolic, as well as
extracellular
cathepsins
or
N-acetyl-beta-D-glucosaminidase
(NAG) (Supplementary Fig. 6). Cleavage of the
fluorogenic
cathe-psin B/L substrate was detected when added to non-permeabilized
cells, but not when added to cell-free conditioned media, suggesting
that the extracellular activity of lysosomal cathepsins was due to
membrane-associated proteases. Notably, the effect of TMEM33 on
cathepsins or NAG translocation was markedly enhanced by
tunicamycin (TM) treatment that causes ER stress (Supplementary
Fig. 6). Remarkably, altered translocation of cathepsins or NAG
upon TMEM33 expression was again blunted by knocking down
PC2 (Fig.
4
e-g; Supplementary Fig. 7). By contrast, overexpressing
PC2 had the opposite effect (Fig.
4
e-g; Supplementary Fig. 7).
Altogether these
findings suggest that the decrease in IP
3signaling mediated by TMEM33 impacts lysosomal size and
function in a PC2-dependent manner. Next, we investigated
whether TMEM33/PC2 might also influence the lysosomal
degradation pathway of autophagy.
TMEM33 inhibits autophagic
flux upon ER stress. Recent
studies indicate that PC2 stimulates autophagy in a variety of cell
types, including renal epithelial cells, as well as cardiomyocytes,
involving both the primary cilium and intracellular calcium
stores
28–31. LC3 is the most widely used autophagosome marker
because the amount of LC3 II (conjugated to
phosphatidyletha-nolamine) reflects the number of autophagosomes
32. Degradation
of p62 is another classical marker to monitor autophagic activity
because p62 is selectively degraded by autophagy
32. In PCT cells,
TM treatment greatly increased the amount of accumulated
LC3II and conversely induced a drop in p62 (Fig.
5
a–f).
Remarkably, both TMEM33 and PC2 knock-down prevented
TM-dependent LC3II accumulation (Fig.
5
a–d). These
observa-tions suggest that in renal epithelial cells TMEM33/PC2 links ER
Δ 0.2 50 s**
***
***
***
***
ATP*
*
*
100 105 110 Empty PC2 Cytosolic resting Ca 2+ level (%) si TMEM33-1 si TMEM33-2 si NT si TMEM33-1 si TMEM33-2 si NT 95b
a
0 Ca2+c
O C 1 s 1pA O C C 0 μM Ca2+ 0.1 μM Ca2+ 10 μM Ca2+ PC2 PC2+TMEM33d
[Free Ca2+] (μM)**
*
**
PC2 PC2 + TMEM33 0.01 0.03 0.1 0.3 1 3 10 0 0.2 0.4Open channel probability
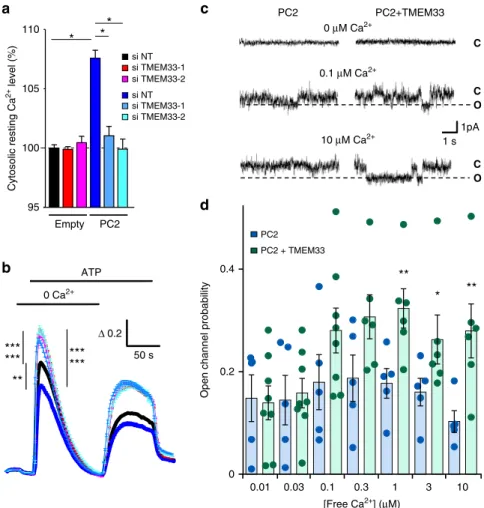
Fig. 3 TMEM33 controls the calcium-dependent gating of PC2. a Increases in cytosolic calcium concentration are expressed as ratios of 340:380 nm fluorescence signals (ΔR/R0). Relative (to the siNT empty vector condition; black bar) basal cytosolic calcium levels in PCT cells transfected or not with siRNAs against TMEM33 (red and magenta bars). The effect of PC2 overexpression (as indicated at the bottom of the graph) was also investigated (dark blue bar, siNT and light blue bars: siTMEM33–1 and siTMEM33–2). Experimental points are available in the data source file. Numbers of cells analyzed are indicated in Fig.2and (b) legends. b ATP-induced calcium transients in the absence of extracellular calcium (siNT, n= 2353; siTMEM33–1, n = 2437; siTMEM33–2, n = 2201; siNT + PC2, n = 262; siTMEM33–1 + PC2, n = 246, siTMEM33 + PC2, n = 322). Same cells as in (a). c PC2 channel activity elicited with 0, 0.1 and 10μM free calcium on the cis-side (cytosolic) in ER liposomes fused to planar bilayers (holding potential: 0 mV). As previously reported, the slope conductance of the channel was 85 pS when PC2 was activated by cytosolic calcium7,10. C indicates the closed state and O the open state (dashed line).d Open channel probability of PC2 measured at increasing concentration of free cytosolic calcium (PC2: blue bars and PC2+ TMEM33: green bars). Values are means ± SEM overlaid with dot plots for (d). One star indicates p < 0.05, two stars p < 0.01 and three stars p < 0.001, with a Student’s t test for (a, b), as well as a Mann–Whitney test for (d) used to evaluate statistical significance. Source data are provided as a Source Data file
stress to the regulation of autophagy. LC3II accumulation
induced by TM might be due to either a stimulated autophagic
flux and/or to a decreased degradation of autolysosomes
32.
Chloroquine (CQ), a lysosomotropic agent, which prevents
autolysosomal degradation, caused an accumulation of LC3II in
basal conditions, that was further enhanced by TMEM33
expression (Fig.
5
e, f)
32. However, when TM was present (which
by itself elevates LC3II), CQ-induced LC3II accumulation in
TMEM33 expressing cells was blunted (1.3 fold versus 2.6 fold in
the presence of DMSO; Fig.
5
e, f). These
findings indicate that
TMEM33 stimulates the autophagic
flux in basal conditions,
while it attenuates autolysosome degradation during
TM-mediated ER stress.
Lysosomal dysfunction and translocation of cathepsins have
been shown to initiate cell death
33–35. Next, we explored whether
TMEM33 might influence PCT cell death, as a consequence of
altered lysosomal function.
TMEM33 sensitizes PCT cells to apoptotic cell death. PCT cells
from TMEM33
−/−mice were transiently complemented using
plasmids encoding TMEM33 and/or PC2, along with a
fluor-escent Cherry reporter (IRES construct). Cell viability was
e
***
60 s 60 s 60 s Δ 0.2 Δ 0.2 Δ 0.2 60 s Δ 0.2***
f
g
a
b
c
d
0 8 16Cathepsin B+L substrate cleavage
(Δ
RFU×1000)
Cathepsin B+L substrate cleavage
(Δ
RFU×1000)
Cathepsin B+L substrate cleavage
(Δ RFU×1000) Cytosolic CD8 TMEM33 CD8 TMEM33
* *
###**
**
***
***
0 30 60 Extracellular**
###** **
**
CD8 TMEM33TMEM33 + siNT-1 TMEM33 + siPkd2-1 DOX DOX DOX DOX GPN GPN GPN GPN CD8 TMEM33 Untransfected Untransfected siNT-1 siNT-2 siPkd2-1 siPkd2-2 GFP
PC2-IRES-GFP Untransfected Untransfected siNT-1 siNT-2 siPkd2-1 siPkd2-2 GFP PC2-IRES-GFP K 0 30 60 Intracellular
* *
* *
##**
DOX DOX Untransfected Untransfected siNT-1 siNT-2 siPkd2-1 siPkd2-2 GFPPC2-IRES-GFP Untransfected Untransfected siNT-1 siNT-2 siPkd2-1 siPkd2-2 GFP PC2-IRES-GFP DOX DOX Untransfected Untransfected siNT-1 siNT-2 siPkd2-1 siPkd2-2 GFP
PC2-IRES-GFP Untransfected Untransfected siNT-1 siNT-2
siPkd2-1 siPkd2-2
GFP
PC2-IRES-GFP
DOX DOX
Fig. 4 TMEM33 inhibits endolysosomal calcium refilling and induces cathepsins translocation. a Increases in cytosolic calcium concentration are expressed as ratios of 340:380 nmfluorescence signals (ΔR/R0). GPN (250μM) response in the absence of extracellular calcium in a conditional PCT cell line expressing CD8ER in the presence of DOX (magenta trace, n= 692), as compared to the non-induced condition (red trace; n = 706). b Same in a conditional PCT cell line expressing TMEM33 in the presence of DOX (black trace; n= 548) or without induction (gray trace; n = 620). c GPN response in cells transfected with siNT (n= 204 and n = 224, in the absence [gray trace] or the presence of DOX [black trace], respectively). d Knockdown of Pkd2 (coding for PC2) suppresses the effect of TMEM33 (n= 361 and n = 422 in the absence and in the presence of DOX, respectively). e Effect of Pkd2 knock-down or PC2 overexpression on intracellular cathepsins B/L content. CD8: red dots; TMEM33 non induced: gray dots; TMEM33 induced: black dots. f Same for cytosolic cathepsins. g Same for extracellular cathepsins. Values represent average peakΔRFU values for n = 3 independent transfection experiments done in triplicate. * compared to respective untransfected DOX induced controls and # compared to respective non-induced controls. Bars are meansΔRFU ± SEM overlaid with dot plots for e-g. One star indicates p < 0.05, two stars p < 0.01 and three stars p < 0.001, with a Student’s t-test used to evaluate statistical significance. Source data are provided as a Source Data file
estimated by counting the number of Cherry positive cells using
a cell sorter and normalized to the control CD8ER condition
(Fig.
6
a). TMEM33 significantly lowered cell viability when
transfected in a TMEM33
−/−background (Fig.
6
a). Remarkably,
in Pkd2
−/−PCT cells this effect was absent, although the
effect was recovered when PC2 was also complemented (Fig.
6
a).
In addition, the number of DAPI positive cells (as an index
of membrane permeabilization) was significantly enhanced when
TMEM33 was expressed in TMEM33
−/−, unlike in Pkd2
−/−cells
[unless PC2 was complemented] (Fig.
6
b). Of note, neither the
number of annexin V positive cells nor caspase activity was
significantly enhanced by TMEM33 expression in TMEM33
−/−cells (Fig.
6
c, d).
Next, we used an in vitro model of PCT cells ER stress
induced by TM (1
μg/ml; 16 h)
36,37. In the conditional
TMEM33 expressing PCT cell line, DOX addition induced a
a
UntransfectedsiNT-1siNT-2siTMEM33-1siTMEM33-2Untransfected
Vehicle TM p62 GAPDH siNT-1siNT-2siTMEM33-1siTMEM33-2
b
c
Vehicle TMsiNT-1siNT-2siPkd2-1siPkd2-2
DOX DOX
siNT-1siNT-2siPkd2-1siPkd2-2
LC3 II LC3 I Tubulin
Control
Control ControlControl
TMEM33-complemented PCT cell line WT PCT cell line
d
CD8 TMEM33 LC3 II LC3 I GAPDH 20 15 37+ + + + +
+ + + + +
+
+
+
+
+ +
+ +
DOX CQ TMComplemented PCT cell line
LC3 II LC3 I
e
f
0 1 LC3II / GAPDH 2 3 Untransfected siNT-1 siNT-2 siTMEM33-1 siTMEM33-2 Untransfected siNT-1 siNT-2 siTMEM33-1 siTMEM33-2 Vehicle TM 0 1 LC3II / tubulin siNT-1 siNT-2 siPkd2-1 siPkd2-2 ControlControl siNT-1 siNT-2 siPkd2-1 siPkd2-2 Control Control DOX DOX Vehicle TM 0 1 2
DMSO DMSO DMSO DMSO
CQ CQ TM TM CQ+TM CQ+TM DOX DOX
**
*
** ## ## ### # # ns 20 75 50 37 15 20 15 50 LC3II / GAPDH kDa kDa kDaFig. 5 TMEM33/PC2 and the regulation of autophagy. a p62, LC3II/LC3I and GAPDH expression in WT PCT cells transfected with control siNT or siTMEM33 siRNAs. Cells were either treated with the vehicle or with TM (1μg/ml for 16 h). Stimulation of autophagy induced by TM is seen as a decreased expression of p62 and increased LC3II/LC3I ratio.b LC3II/GAPDH ratio quantified from (a). c LC3II/LC3I and tubulin expression in TMEM33−/−cells conditionally complemented with TMEM33 (upon DOX induction). Cells were transfected with control siNT or siPkd2 siRNAs. Cells were either treated with the vehicle or with TM (1μg/ml for 12 h). d LC3II/tubulin ratio quantified from (c). Gray dots: uninduced cells; black dots: induced with DOX.e Estimation of autophagicflux in CD8- or TMEM33-complemented TMEM33−/−stably complemented PCT cells. Treatments with doxycyline (DOX) to induce either CD8ER or TMEM33 expression is illustrated in red. Cells are treated either with vehicle (DMSO) or with TM (1μg/ml) for 8 h with or without chloroquine (20μg/ml)(CQ) for 2 h. f LC3II/GAPDH ratio quantified from e. Red dots: CD8; Gray dots: TMEM33 uninduced cells; black dots: TMEM33 induced with DOX. For TMEM33 expressing cells, the difference between DMSO and CQ is significant (**), while the difference between TM and TM+ CQ is not significant. Values are means ± SEM overlaid with dot plots for b, d, f. One star indicates p < 0.05, two stars p < 0.01 and three stars p < 0.001, with a two-tailed Student’s t-test used to evaluate statistical significance. Source data are provided as a Source Data file
***
*
***
**
CD8 PC2 TMEM33 PC2/TMEM33 TMEM33 CD8 Relative DAPI 0 1 2***
Pkd2–/– Relative annexin 0 1 TMEM33–/– 2 CD8 PC2 TMEM33 PC2/TMEM33 TMEM33 CD8 Pkd2–/– TMEM33–/– Pkd2–/– TMEM33–/– 0 1 Relative viability 3 CD8 PC2 TMEM33 PC2/TMEM33 TMEM33 CD8 CD8 PC2 TMEM33 PC2/TMEM33 TMEM33 CD8 0 1 2 Pkd2–/–Relative caspase activity
TMEM33–/–
c
d
b
a
f
g
e
DOX TM + + + + + + + + CD8 CD8 TMEM33 TMEM33 48 h 96 h LDH release (%) 0 10 20 30 40**
**
*
DOX TM + + + + + + + + LEUP TMEM33 0 15 10 5 CD8 LDH release (%) 48 h***
DOX TM + + + + + + + + CD8 CD8 TMEM33 TMEM33 48 h 96 hRelative caspase activity
0 10 20
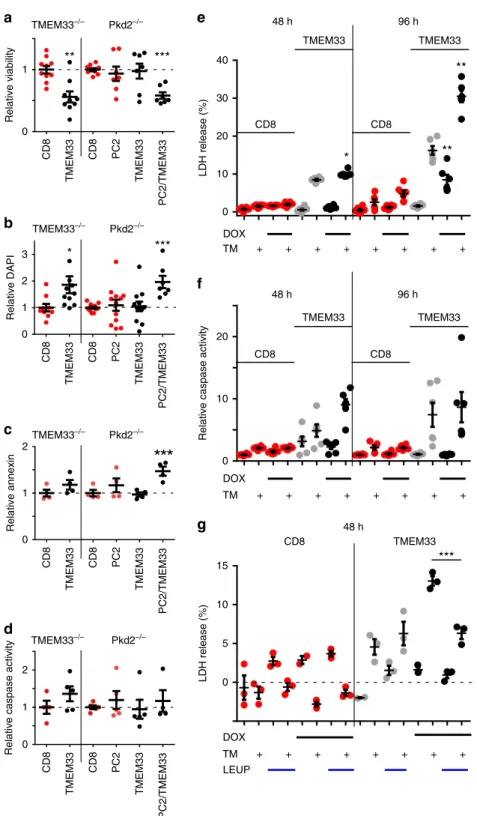
Fig. 6 TMEM33 overexpression induces cytotoxicity in a PC2-dependent manner. a Cell viability determined by measuring the number of Cherry positive cells using a cell sorter. CD8ER (red dots) was used as a negative control. Cells were transfected with TMEM33 (black dots) or PC2 alone (red dots), or with the mix TMEM33/PC2 (black dots). The relative (to the CD8ER conditions) number of viable cells expressing Cherry is illustrated.b Relative number of DAPI positive cells. One TMEM33 complemented TMEM33−/−data point (4.66) is out of scale.c Relative number of annexin positive cells. d Relative caspase 3/7 activity.e LDH release in either a conditional PCT cell line expressing CD8ER (in red) or TMEM33 (in black), without (in gray) or with DOX induction (in black) at 48 and 96 h. Cells were treated with vehicle (DMSO) or TM (1μg/ml) for 16 h. f Same for caspase 3/7 activity. g Effect of the cathepsins inhibitor leupeptin (LEUP; 25μM) on LDH release in a conditional PCT cell line expressing TMEM33 (black dots) or CD8ER (red dots) without or with DOX induction (48 h), as indicated. Values are means ± SEM overlaid with dot plots. One star indicates p < 0.05, two stars p < 0.01 and three stars p < 0.001, with a one-way permutation test used to evaluate statistical significance. Source data are provided as a Source Data file
time-dependent (over 96 h) increase in basal and TM-induced
release of lactate dehydrogenase (LDH; an index of cytotoxicity),
unlike in CD8ER expressing cells (Fig.
6
e). LDH release from the
TMEM33 expressing cell line in the absence of DOX induction is
likely to be related to the leakiness of the repressor system and to
the basal TMEM33 expression (TMEM33/TOP1: 0.06
+ 0.002)
occurring even in the absence of DOX, corresponding to about
10% of the cortical level of TMEM33 (Supplementary Fig. 9a).
Caspase 3/7 activity was not significantly influenced by basal
TMEM33 expression, although it was strongly enhanced by
TM treatment in TMEM33 expressing cells (Fig.
6
f). Finally,
cathepsins inhibition by leupeptin (LEUP) significantly protected
PCT cells expressing TMEM33 from TM-induced LDH leakage,
indicating lysosomal dysfunction and contribution of cathepsins
(Fig.
6
g).
Altogether, these
findings indicate that TMEM33 expression
causes cytotoxicity (as detected by an increase in LDH leakage
and DAPI staining, as well as decreased cell viability) of PCT cells
and markedly enhances TM-induced apoptosis. Importantly,
the cytotoxic effect of TMEM33 was critically dependent on the
presence of PC2.
Next, we investigated in vivo whether TMEM33 might
similarly exert a deleterious effect on renal tubular cells in
conditions of AKI.
TMEM33 deletion confers renal protection against AKI. We
took advantage of a constitutive TMEM33 knockout (KO)
mouse model and focused on the renal function of TMEM33,
specifically investigating sensitivity to AKI. Homozygote mice
were viable, breeding and basal physiological parameters were
similar to wild type (WT) mice (Supplementary Tables 1 and 2).
In aged mice, over 1 year old, we saw no evidence for
morpho-logical anomalies, including the presence of renal cysts
(Supple-mentary Fig. 8). Expression of various ER stress related genes
in cortical tissues, including GRP78 and CHOP were unchanged
in the KO model (Supplementary Fig. 10). Moreover, renal
expression of PC2 was not altered in the KO mice
(Supplemen-tary Fig. 9e). Mice were subjected to AKI using the in vivo
TM toxicity model
37,38. Following IP injection of 2 mg/kg TM,
about 20% of the WT mice died within 3 days (Fig.
7
a, top panel).
However, all KO mice survived, despite the fact that the loss
in body weight induced by TM injection was identical between
both mouse lines (Fig.
7
a, top and bottom panels). Of note,
the level of TMEM33 expression that is about twice as much
in mouse cortex, as compared to the medulla was unaltered in
the model of TM-induced AKI (Supplementary Fig. 9a, b).
Moreover, the pattern of TMEM33 expression (as visualized by
the LacZ reporter) in proximal or distal tubular segments was
not visibly altered upon TM treatment (Supplementary Fig. 9c, d).
In addition, expression of Pkd2 or TRPV4 (a partner of PC2
at the primary cilium
39), was unchanged in the KO without or
withTM treatment (Supplementary Fig. 2c, d). Expression of
GRP78 and CHOP in the cortex was monitored at 12 and 72 h
post TM injection (Supplementary Fig. 10). Both genes peaked
at 12 h post injection and subsequently declined at 72 h. We
observed no significant difference in the expression of either ER
a
c
TM Vehicle 28 25 Lethality (%) 0 10 20 9 8 WT KO Δ Weight (g) –4 –8 0 WT KO Vehicle TM LCN2 Hoechstb
d
1 2 0 Relative caspase 3/7 activity TM + + 3*
nsh
e
f
g
Lesions grade 0 1 2 3 Percentage 0 20 40 60 WT (12) KO (13)i
WT KOVehicle TM HoechstTUNEL
WT KO Vehicle TM KO 12H WT 12H KO 72H WT 72H
**
Vehicle TM LCN2//HPRT expression 0 0.4 0.8 Cortex 1.2***
WT KO 0 1 2 Cortex Medulla LCN2 expression (×100) Apoptotic cells (%) 0 0.8 0.4 1.2 WT KO**
TM + + + + Cortex Medulla**
WT KOFig. 7 Deletion of TMEM33 in the mouse confers protection against AKI. a Percentage of lethality (the number of mice is indicated) is shown in the top panel. The bottom panel shows the amount of weight loss induced by TM injection. WT: black bars and dots; KO: red bars and dots.b Expression of LCN2, as detected by qPCR in mouse renal cortex 12or 72 h after TM (2 mg/kg) injection, comparing WT (gray and black dots) and KO (orange and red dots) mice.c LCN2 and Hoechst staining on cortical sections of kidney from WT and KO mice injected with vehicle or TM (same n values as a). Scale bars indicate 200μm. d Relative intensity (TM/vehicle) of LCN2 staining in the cortex and medulla of WT and KO mice. e Tunel and Hoechst staining on cortical sections from kidneys of mice injected with vehicle or TM, comparing WT and KO mice. Scale bars indicate 200μm. f Percentage of apoptotic cells in the cortex and the medulla.g Relative (to the vehicle treated WT mice) caspase 3/7 activity determined in renal cortical homogenates from WT and KO mice either injected with vehicle or TM.h Hematoxylin staining of cortical renal sections of WT and KO mice injected with vehicle or TM. i Quantification of lesion grades on cortical sections from WT and KO mice injected with vehicle or TM. The number of mice is indicated on the graph. Values are means ± SEM overlaid with dot plots. One star indicates p < 0.05, two stars p < 0.01 and three stars p < 0.001, with a one-way permutation test used to evaluate statistical significance. Source data are provided as a Source Data file
stress genes between WT and KO mice injected with TM
(Sup-plementary Fig. 10). NGAL/LCN2 (neutrophil
gelatinase-associated lipocalin) is routinely used clinically as an early
bio-marker for AKI
40. We observed that LCN2 mRNA and protein
expression at 72 h post TM injection was significantly decreased
in the cortex of KO mice (Fig.
7
b–d). A similar effect was found
in the medulla, despite major differences in LCN2 mRNA and
protein expression levels (about 10-fold higher mRNA level, but
5-fold less protein in the medulla), as seen with two separate
antibodies (Fig.
7
d and Supplementary Fig. 9f). Next, we
esti-mated the number of apoptotic cells on renal sections using
TUNEL staining (Fig.
7
e, f). There was no significant difference
in basal apoptosis when comparing vehicle injected WT and KO
mice. However, in TM-injected mice the cortical increase in
apoptotic cell death, as well as caspase 3/7 activation, was blunted
in kidneys from KO mice (Fig.
7
e–g). These findings were
con-firmed using Periodic acid-Schiff (PAS) staining and
morpholo-gical analysis of kidney sections (Fig.
7
h, i). No evidence of renal
cysts was found with (n
= 12 and 13, for WT and KO,
respec-tively) or without TM treatment (n
= 4 and 2 for WT and KO,
respectively). Grade 2 cortical lesions in TM-injected mice,
characterized by massive tubular dilatation, were reduced by
about half in the KO mice (Fig.
7
h, i). Thus, a significant
pro-tection against TM-induced AKI is observed in the TMEM33
KO mice. In summary, our
findings indicate that TMEM33 plays
an important role in renal tubular cell vulnerability associated
with AKI.
Does TMEM33 exert a protective effect against cystogenesis?
It is now well established that reduced PC1/PC2 function (i.e.
dosage) causes ADPKD
1. However, the relative contribution of
PC2 at the primary cilium and/or at the ER in the pathology
remains unclear at this stage. An important question is whether
or not TMEM33 (a selective activator of PC2 at the ER, but not at
the primary cilium) might exert a protective effect against
Pkd2-dependent cystogenesis. In other words, does TMEM33
invali-dation aggravate cyst formation caused by Pkd2 knock-down and
can we probe the functional role of ER PC2 in renal cystogenesis
taking advantage of its activator TMEM33? It is important to
note that a protective effect of TMEM33 would not be expected
if Pkd2 is fully invalidated (homozygote knockout), since
TMEM33 could not enhance PC2 channel opening (Fig.
2
e, f).
Exploring these questions in mice is technically challenging as
a Pkd2 hypomorphic model together with a targeted deletion of
TMEM33 would need to be implemented (of note Pkd2
+/−mice
are not cystic and constitutive Pkd2
−/−is embryonic lethal
41).
To circumvent this major difficulty, we instead turned to a more
amenable and validated zebrafish model of renal cystogenesis
based on the injection of morpholino oligomers to knock down
pkd2 and recapitulate the molecular mechanism (dosage effect) of
ADPKD and induce renal cysts
42. The zebrafish pronephros is
composed of two nephrons with glomeruli fused at the midline
(Fig.
8
a). In the zebrafish ADPKD model, a translation blocking
morpholino oligomer complementary to the ATG of pkd2 (MO
pkd2) is injected into the embryos at the 1 cell stage, causing
a large dilation of the glomeruli (cysts) two days later
42(Fig.
8
b).
Taking advantage of this powerful and accessible assay, we
compared the effect of pkd2 knockdown on glomerular
enlarge-ment (using the wt1b:EGFP
fluorescent marker) in WT zebrafish
(tmem33
+/+) and in a tmem33 mutant
fish line
43. Glomerular
size of tmem33
+/+, tmem33
+/−or tmem33
−/−embryos injected
with control MO was identical (Fig.
8
c). Importantly,
enlarge-ment of glomeruli (i.e. cysts) induced by pkd2 MO was not
significantly different in tmem33
+/−or tmem33
−/−embryos, as
compared to WT embryos (Fig.
8
c).
Discussion
In this report, we demonstrate that TMEM33 is found in a
complex together with the ER channel PC2 in PCT cells. Deletion
of TMEM33 enhances IP
3-dependent calcium signaling, whereas
its overexpression has the opposite effect. Strikingly, these effects
on the regulation of intracellular calcium homeostasis critically
depend on PC2. TMEM33 promotes PC2 channel opening
over the whole cytosolic calcium range in lipid bilayer ER
lipo-somes reconstitution experiments. Inhibition of IP
3signaling by
TMEM33 lowers calcium refilling of endolysosomes, causing
lysosomal enlargement, cathepsins translocation and impaired
autophagic
flux during ER stress. Moreover, TMEM33 enhances
TM-induced PCT cytotoxicity in vitro that is prevented by
cathepsins pharmacological inhibition. In line with these
findings,
genetic deletion of TMEM33 exerts a significant protection in a
mouse model of TM-induced ER stress. Thus, TMEM33
influ-ences the regulation of intracellular calcium homeostasis in
kid-ney tubular epithelial cells and is associated with enhanced
c
Control MO tmem33 +/+ pkd2 MO tmem33 +/+ Control MO tmem33 +/– pkd2 MO tmem33 +/– Control MO tmem33 –/– pkd2 MO tmem33 –/– Glomerular area (µ m 2) × 1000***
****
*
ns 0 2 4 Control MO wt1b:egfp pkd2 MO wt1b:egfp 55 hpf 55 hpfa
b
Fig. 8 Tmem33 does not influence renal cystogenesis in zebrafish. a Epifluorescence image of zebrafish glomeruli. Control morpholino oligomer injected in Tg(wt1b:EGFP)li1.b Morpholino knockdown of pkd2
increases glomerular area in Tg(wt1b:EGFP)li1(red arrows). Scale bars:
50µm. c Pkd2-dependent renal cystogenesis was unaffected by the loss of tmem33 in zebrafish tmem33sh443mutants (tmem33+/+black dots,
tmem33+/-gray dots and tmem33−/−red dots). Each data point refers to a single glomerulus. Values are means ± SEM overlaid with dot plots. One way ANOVA with Turkey’s post hoc *p < 0.05, ***p < 0.001, ****p < 0.0001, F= 15.44, DF = 119, 2 repeats. Source data are provided as a Source Datafile
susceptibility to AKI, while it does not affect pkd2-dependent
renal cystogenesis.
TMEM33 is a transmembrane protein that is conserved during
evolution. There are two isoforms in the budding yeast S.
cere-visiae called Pom33 and Per33
16. Pom33 is present at the ER and
is also dynamically associated with the nuclear pore complex,
unlike Per33 that is restricted to the ER
16. Pom33 contributes to
the distribution and/or assembly of nuclear pores
16,44. The
fission
yeast TMEM33 protein (called Tts1) also functions in organizing
peripheral ER and in remodeling the nuclear envelope during
mitosis
17,18. It is predicted that TMEM33 is made of one
trans-membrane segment followed by a hairpin in which hydrophobic
segments do not fully span the membrane, with both N and C
termini facing the cytosol
16. The C-terminal amphipathic helix
in Tts1 plays a key role in ER shaping and modulating the
mitotic nuclear pore complex distribution
17. In addition, Tts1/
Pom33 might function to sustain the highly curved ER domains
in interaction with the reticulons Rtn1 and Yop1
16–18. In
mam-malian cells, TMEM33 was similarly characterized at the ER
membrane as a Rtn-binding protein
19. Interestingly, TMEM33
has the ability to suppress the membrane-shaping activity of
Rtns, thereby influencing the ER tubular structure
19. In addition,
TMEM33 was identified as a participant in US2-mediated
degradation of MHC I
45. Moreover, TMEM33 was shown to
be a stress-inducible ER protein that modulates the unfolded
protein response signaling by interacting with PERK and IRE1α
in cancer cells
46.
The in vivo physiopathological function of mammalian
TMEM33 remained to be determined. Here, we demonstrate that
TMEM33 is a key modulator of intracellular calcium homeostasis
through the regulation of PC2 at the ER, influencing AKI in the
mouse. Unexpectedly, we found that TMEM33 expression
dra-matically alters the calcium-dependency of PC2 in ER liposomes
fused to planar bilayer. Increasing cytosolic calcium typically
produces a bell-shaped increase in the open channel probability
of PC2, indicating the overlapping influence of both a stimulatory
(at the lower calcium range) and an inhibitory calcium-dependent
mechanism (at the higher calcium range)
7,10. When TMEM33
is overexpressed, the inhibitory mechanism disappears, thus
resulting in a net stimulation of channel activity over the entire
physiological calcium range. Our data are consistent with the fact
that enhanced PC2 channel opening in the presence of TMEM33
results in ER calcium depletion and diminished IP
3responses, in
line with a previously reported role for PC2 as a leak calcium
conductance of the ER
14. Thus, our in vitro experiments
demonstrate that TMEM33 is a major regulator of ER PC2 gating
(i.e. acting as an auxiliary subunit), promoting its opening over
the whole cytosolic calcium range. Our
findings further validate
PC2 as an ER calcium release channel
7,12,14.
Acidic organelles are coupled to the ER through calcium
microdomains at membrane contact sites. ER calcium content
and IP
3R-evoked calcium release are proposed to control the
uptake of calcium in lysosomes
26,27,47. We observed that
endo-lysosomal calcium load is reduced by TMEM33, along with
diminished IP
3responses. Endolysosomal size and translocation
of cathepsins is enhanced by TMEM33. We propose that altered
lysosomal calcium refilling through impaired IP
3-dependent
sig-naling is a major contributor to these anomalies. Previous
find-ings indicated that larger lysosomes are more susceptible to
breakage and release of their contents
48. Thus, lysosomal
leaki-ness induced by TMEM33 might possibly be related to the
increase in their size.
The effect of TMEM33 on the regulation of intracellular
cal-cium homeostasis shown in vitro is critically dependent on PC2.
Similarly, TMEM33-induced translocation of cathepsins was
greatly influenced by PC2. In addition, the cytotoxic effect of
TMEM33 was again dependent on PC2. However, we cannot rule
out that some of the TMEM33 effects might be PC2-independent.
TMEM33 was previously linked in various cell types to different
mechanisms, including tubulation of the ER, nuclear pore
assembly and distribution, protein degradation or ER stress
responses (see above). Thus, it is possible that these mechanisms
might also be at play in the kidney. For instance, previous
find-ings demonstrated that TMEM33 interacts with Rtns in both
yeast and mammalian cells, influencing ER tube caliber
16–19.
Whether or not TMEM33 might influence PC2 and/or IP
3R
activity through a change in local ER membrane curvature is a
possibility to be considered. Moreover, changes in membrane
curvature may also impact endolysosomal morphology and
ability to form membrane contact sites at the ER. Notably,
ER/endosome contact also regulates maturation and
fission of
endosomes
49,50. Thus, disruption of ER/lysosome contact may
be an additional explanation for depletion of lysosomal calcium
content. In this context, TMEM33 might also act as a negative
regulator of membrane contact sites between the ER and the
endolysosomes.
In the human breast cancer cell line MCF-7, TMEM33
inter-acted and stimulated both the PERK/p-eIF2α/ATF4/CHOP and
IRE1α-XBP1-S signaling pathways
46. However, the present
find-ings indicate that TMEM33 sensitizes PCT cells to TM-induced
apoptosis, independently of a change in the ER stress response.
Instead, our study indicates that kidney lysosomal dysfunction,
including translocation of cathepsins contribute to the cytotoxic
effects of TMEM33. Thus, renal tubular epithelial cells and breast
cancer cells show a different susceptibility to the deleterious
effects of TMEM33 expression, with the possible differential
involvement of cell cycle components or other elements that
contribute to cancer
46.
Clearly, future studies will be required to identify all the
mechanisms at play (including those independent of PC2) in
the renal effects of TMEM33. Nevertheless, the present work
already brings strong evidence that TMEM33 might behave
as an auxiliary regulatory subunit of ER PC2 in PCT cells,
acting as a gating activator (at least demonstrated in vitro in
the present report). In mammary breast cancer cells, TMEM33
mRNA and protein expression are greatly enhanced by
thap-sigargin or TM treatments
46. In the same line, it is interesting
to note that during ischemic acute renal failure, affecting
primarily the proximal tubule, a pronounced upregulation of
intracellular PC2 (the partner of TMEM33) was reported
22–24.
The upregulation of PC2 might act as a brake on cell
pro-liferation (acting in part as a tumour suppressor gene) to allow
the proliferative index of the ischemic kidney to return to
baseline
23. Accordingly, the magnitude and duration of tubular
and interstitial proliferative responses was enhanced in injured
Pkd2
+/−mice
51.
Dysregulation of cathepsins expression/activity is associated to
the onset and progression of various kidney diseases, including
AKI
34. For instance, cathepsin D is increasingly recognized as
a key driver of apoptosis during AKI
52. In addition, translocation
of cathepsins from the lysosome into the cytoplasm was
demonstrated as an important event involved in renal
physio-pathology
53. Thus, the previously reported multifaceted role of
cathepsins in kidney disease is clearly in line with the present
study
34.
Autophagy is triggered upon stress to eliminate excess proteins
and protects cells against metabolic damage
54–58. It has been
sug-gested that increased [Ca
2+]
cyt/[Ca
2+]
ER, at least partly, contributes
to the stimulation of autophagy
59. Recent
findings indicate that in
cardiomyocytes, PC2 functions to promote autophagy under
glu-cose starvation or mTOR (target of rapamycin) inhibition
29,31.
PC2 overexpression had the opposite effect
29,31. PC2-induced
autophagy in cardiac cells was blunted by intracellular calcium
chelation, whereas removal of extracellular calcium had no effect
29.
These
findings suggest a model whereby PC2-dependent regulation
of autophagy occurs through the regulation of intracellular calcium
homeostasis
29,31(Fig.
9
a). Previous
findings also indicated that
TMEM33 overexpression in cancer cells results in a stimulation
of autophagy
46. Similarly, in the present study we observed an
enhancement of the autophagic
flux of PCT cells by TMEM33 in
the basal conditions (Fig.
5
a–f). Activation of ER PC2 by TMEM33
at least partly contributes to this effect (Fig.
5
c and Fig.
9
a). By
contrast, upon TM-induced ER stress we observed an impaired
autophagic
flux when TMEM33 was expressed, likely due to
lyso-somal dysfunction (Fig.
5
e, f, Fig.
9
b).
Altogether, our
findings suggest that TMEM33 is an
impor-tant, so far unrecognized player in AKI. In basal conditions,
TMEM33 overexpression does not induce signs of apoptosis
(as detected by caspase 3/7 activity or TUNEL staining).
Rather, we show that TMEM33 sensitizes PCT cells to apoptosis
during ER stress. We propose a mechanistic model addressing
the scenario of AKI, including a possible role of TMEM33/
PC2 in cathepsins translocation and impaired autophagic
flux upon ER stress (Fig.
9
b). Accordingly, deletion of
TME-M33 exerts a potent protective role against TM toxicity
(Fig.
7
).
Since TMEM33 acts as an activator of PC2, at least in vitro,
we investigated whether or not it might exert some beneficial
effects against Pkd2-dependent cystogenesis. Using a pkd2
hypomorphic model (dosage) of ADPKD in the zebrafish, we
found no significant protection of TMEM33 against
pkd2-dependent renal cystogenesis. These
findings indicate that ER
PC2 might not be causal to ADPKD, but rather a loss-of-function
of PC2 at the primary cilium (that does not interact with
TMEM33) is responsible for cystogenesis, as already indicated
by the tight association between renal cystic diseases and
numerous ciliopathies
60.
In conclusion, our in vitro work shows that TMEM33 acts
as a gating activator of ER PC2. Moreover, our in vivo studies
suggest that TMEM33 is involved in AKI, while it does not
influence renal cystogenesis, at least in the zebrafish.
Methods
Cell culture. PCT cells were derived from mouse kidneys and primary cultures were immortalized with pSV3NEO61. Cells were grown in DMEM/F12 (V/V)
medium, containing 1% FBS, 15 mM NaHCO3, 2 mM glutamine, 20 mM HEPES, 5 mg/l insulin, 50 nM dexamethasone, 10 µg/l EGF, 5 mg/l transferrin, 30 nM sodium selenite, 10 nM T3 (triiodo-L-thyronine) and 125 µg/ml G418 (geneticin).
PCT Pkd2−/−cells62(a kind gift from Steve Somlo) were grown in DMEM/
HAMF12 (V/V) medium, containing 3% FBS, 7.5 nM Na selenite, 1.9 nM T3 (triiodo-L-thyronine), 5 mg/l insulin, 5 mg/l transferrin, 50 U/ml nystatin, 10 U/ml INF (interferon-gamma) and 100μg/ml penicillin/streptomycin at 33 °C in a humidity-controlled incubator with 5% CO2. HeLa cells (a kind gift from Valérie Doye;16) were cultured in DMEM containing 10% FBS and 100μg/ml penicillin/
streptomycin. For HeLa stably expressing GFP-TMEM33 1 mg/ml of G418 was added.
Plasmid constructs. The following plasmids were used in this study: pIRES2-EGFP PC2 (#32), pIRES2-pIRES2-EGFP TMEM33 (#212), pBUD mCherry-PC2 (#250), pBUD 1.mCherryPC2 2.EGFPTMEM33 (#255), pIRES-puro3 HA-PC2 (#203), pBUD 1.TMEM33iresCherry 2.PC2 (#438), pBUD 1.CherryiresCherry 2.PC2 (#439), pBUD 1.TM33iresCherry 2.CD8ER (#440), pBUD 1.CherryiresCherry 2. CD8ER (#441). pCDNA3.1 CD8-ER (I-II loop Cava 1 A)-Myc (#437). pCMV Myc-PC2 (#113), pCMV Myc-742X (#116), pcDNA3.1 Myc-TMEM33 (#217), pcDNA3.1 HA-PC2 (#179), pcDNA3.1 HA-742X (#180), pcDNA3.1 TMEM33-HA (#177), pCDNA3,1 zeo (+ )mCherry -PC2 (# 253), pEGFP-N1 -TMEM33 (#106). Samples and maps are available on request.
TMEM33 knockout mice. ES cells heterozygous for TMEM33 (Tmem33 tm1 (KOMP)Mbp) were purchased from the KOMP (Knockout Mouse Project) repo-sitory UC Davis, CA, USA. The construct contains a synthetic cassette including LacZ, inserted in intron 2–3 and deleting coding exons 3, 4, 5 and 6 (Supple-mentary Fig. 11). The remaining exons encode 27 amino acids of which 15 cor-respond to the predicted cytosolic amino terminus of TMEM33. TMEM33 knockout mice were generated using these ES cells at MRC Harwell, Oxford, UK. Generation of stable cell lines using the T-Rex system. As afirst step, immortalized PCT cells derived from (TMEM33−/−) KO mice were transfected with pcDNA6TR (Tet repressor) linearized with FspI. Transfections were per-formed in a 35 mm plate with 250 000 cells using 2μg of plasmid and 5 μl of Lipo2000 (Invitrogen) according to manufacturers instructions. After 48 h, cells were dissociated with 250μl trypsin and 750 μl of complete medium. The serum used was TET system approved FBS (Clontech). 25μl, 50 μl and 100 μl were then seeded into 10 cm dishes with medium supplemented with 15μg/ml blasticidin. Individual clones were picked using cloning cylinders and amplified in a 6-well plate. Each clone was tested by western blot to determine the best expression of the Tet repressor using the Tetr antibody from Sigma. Clones were further tested using the pcDNA4/TO lacz plasmid+ /− 1 μg/ml of DOX. Clone 34 was selected to introduce pcDNA4/TO TMEM33iresCherry (#368). Transfections were carried out
IP3R Ca2+ Lysosome Cathepsins translocation ER lumen TMEM33 Cytosol PC2 Autophagosome Autolysosome ER STRESS CELL DEATH Autophagy Autolysosome IP3R ER lumen TMEM33 Cytosol PC2 Ca2+ Lysosome Autophagosome Autophagy Cell death
a
b
Fig. 9 TMEM33/PC2, intracellular calcium homeostasis and cell death. Schematic model describing the effect of TMEM33 on the regulation of intracellular calcium homeostasis, lysosomal function, autophagicflux and tubular cell death in control conditions (a) or upon ER stress (b). The proposed model (figure created by EH) addresses the scenario of AKI (b), when TMEM33 expression is enhanced46(right panel). Ourfindings indicate an interaction between TMEM33 and PC2 at the ER membrane causing an increase in PC2 channel activity spanning the whole physiological calcium range. TMEM33 induces, through PC2, a decrease in intracellular calcium and a diminished IP3calcium signaling (right panel). Consequent decrease in the calcium refilling of lysosomes, associated with an enlargement and translocation of cathepsins sensitize PCT cells to TM-induced apoptosis. Moreover, impairment of autolysosome degradation causes an inhibition of the autophagicflux and a loss of cellular protection upon ER stress. Accordingly, genetic deletion of TMEM33 in the mouse provides a significant protection against TM-induced AKI. Source data are provided as a Source Data file