HAL Id: hal-02991774
https://hal.archives-ouvertes.fr/hal-02991774
Submitted on 10 Dec 2020HAL is a multi-disciplinary open access
archive for the deposit and dissemination of sci-entific research documents, whether they are pub-lished or not. The documents may come from teaching and research institutions in France or abroad, or from public or private research centers.
L’archive ouverte pluridisciplinaire HAL, est destinée au dépôt et à la diffusion de documents scientifiques de niveau recherche, publiés ou non, émanant des établissements d’enseignement et de recherche français ou étrangers, des laboratoires publics ou privés.
Energy transfer and luminescent properties of Eu3+,
Tb3+, Eu3+-Yb3+and Tb3+-Yb3+ doped α-NaYF4
nanophosphors prepared by coprecipitation route
Z. Smara, Y. Cheroura, D. Boyer, A. Potdevin, A. Chafa, O. Ziane, Rachid
Mahiou
To cite this version:
Z. Smara, Y. Cheroura, D. Boyer, A. Potdevin, A. Chafa, et al.. Energy transfer and lu-minescent properties of Eu3+, Tb3+, Eu3+-Yb3+and Tb3+-Yb3+ doped α-NaYF4 nanophos-phors prepared by coprecipitation route. Optical Materials, Elsevier, 2020, 104, pp.109932. �10.1016/j.optmat.2020.109932�. �hal-02991774�
1
Energy transfer and luminescent properties of Eu3+, Tb3+, Eu3+-Yb3+and Tb3+-Yb3+ doped α-NaYF4 nanophosphors prepared by coprecipitation route
Z. Smara1, 2, Y. Cheroura 1,3, D. Boyer1*, A. Potdevin1, A. Chafa2, O. Ziane3, R. Mahiou1,*
1
Université Clermont Auvergne, CNRS, SIGMA Clermont, Institut de Chimie de Clermont-Ferrand, F-63000 Clermont-Clermont-Ferrand, France
2
Laboratoire des Sciences Nucléaires et Interaction Rayonnement Matière, Faculté de Physique, USTHB, El-Alia Bab-Ezzouar, 16111 Alger, Algérie
3
Laboratoire d’Electronique Quantique, Faculté de Physique, USTHB, El-Alia Bab-Ezzouar, 16111 Alger, Algérie
*
Corresponding Authors: damien.boyer@sigma-clermont.fr, rachid.mahiou@uca.fr
Abstract
Cubic α-NaYF4 nanometer-sized crystals doped with Eu3+, Tb3+, Yb3+-Eu3+ or Yb3+-Tb3+
were synthesized by an original coprecipitation route. The obtained nanoparticles exhibited primary particles showing cubic shape with sizes ranging between 35 and 65 nm. The singly- or co-doped nanophosphors exhibited strong red (Eu3+) or green (Tb3+) fluorescence upon ultraviolet (UV) or near infrared (NIR) excitation, which resulted respectively from down- or up-conversion processes occurring in their structure. Spectroscopic properties were investigated on the basis of emission spectra as well as luminescence decays. From the emission spectra of Eu3+ doped samples, the Ω2 and Ω4 Judd-Ofelt intensity parameters were
calculated. The concentration quenching of the Eu3+ or Tb3+ ion emissions in singly-doped or Yb3+ co-doped α-NaYF4 were ascribed to resonant cross-relaxations. The main derived
interaction between the active ions was evidenced as an electric dipole-dipole one through fitting the decays curves with the Inokuti-Hirayama model. The critical distances and energy transfer microparameters for the transfer processes were given showing very short range interaction. The dependence of integral up-conversion intensity on the NIR energy of the beam power was measured. The results indicated a two-photon process based on a cooperative energy transfer.
Keywords: Nanophosphors, Fluorides, Luminescence, Down-Conversion, Up-Conversion,
2
1. Introduction
Due to their transparency in the ultraviolet-visible range and their low phonon energies, fluorides are efficient hosts for up-conversion (UC) and down-conversion (DC) luminescence of rare earth (RE) ions [1]. Many applications of fluorides doped with RE have been performed, such as optical communications [2], lasers [3], display devices [4], and so on [5]. One of the most emerging applications resides on the use of rare-earth doped fluorides exhibiting both down (DC) and up (UC) conversions as solution for improving the energy efficiency of crystalline silicon (c-Si) solar cells as they can be used as mismatch media between the incident sunlight spectrum and the c-Si semiconductor [6]. However, to be applied on a c-Si, the DC and UC converters should be coupled onto the front surfacesof the cells [7]. Consequently, nanoparticles (NPs) with uniform distribution are required as host material, since they are expected to minimize scattering of incident sunlight [8].
Recently, rare-earth doped NaYF4 nanocrystals were prepared with various methods like
hydrothermal [9-11], solvothermal [12, 13], thermolysis [14], sol-gel [15], molten salt [16]
and solid-state methods [17].
NaYF4 nanocrystals may be prepared in two polymorphic forms, either cubic (α) or
hexagonal (β) phases [18] depending on the synthesis conditions. The crystal structure of sodium yttrium fluoride has been the subject of debate for a long time. To obtain the cubic phase α-NaYF4, several hydrothermal and solvothermal processes were utilized. Z. Wang et
al. [9] used a hydrothermal route in a 30 mL autoclave, heated at 180°C for 24 h with the stoichiometry Y3+ : F- = (1:4). G. Wang et al. [10, 12] used a 50 mL autoclave heated at 180°C for 24 h and a 30 mL autoclave heated at 160°C for 6 h.Y. Ma et al. [11] used a 50 mL autoclave heated at 180°C for 10 h. J. Wang et al. [13]synthesized this cubic form by a facile citric acid-assisted solvothermal process in a 100 mL Teflon-lined autoclave sealed and heated at 170°C for 12 h. But all these synthesis processes are energy consuming due to the high pressure conditions they imply, thus new energy efficient routes for preparing these fluorides as nanocrystals are requested. An alternative will consist in implementing a coprecipitation method to prepare NaYF4 at low temperature and atmospheric pressure. Such
a synthesis process was already used to obtain α-NaYF4 but either as monodisperse
microspheres [19] or as polydisperse nanoparticles [20].
In this work, we were able to synthesize nanoparticles of undoped and Eu3+, Tb3+, Eu3+ -Yb3+and Tb3+-Yb3+ doped cubic α-NaYF4, via a facile approach at atmospheric pressure using
a coprecipitation method on the basis of P. Lei et al. report [21] which is related to the preparation of β-NaBiF4 nanocrystals. It was not possible to obtain the β hexagonal form in
our case since the synthesis of this phase requires a temperature higher than 200°C [22], and the ethylene glycol (EG) used as the solvent in this procedure, has a boiling point of 180°C. Different temperatures and different reaction times were used to check the stability of the α-NaYF4 matrices. The crystal structure and the morphology of the as-obtained NPs were
assessed by XRD and TEM. Such analyses have allowed us to define accurately the parameters allowing to obtain pure α-NaYF4 NPs with uniform size distribution. The defined
procedure was used to prepare singly doped α-NaYF4: Ln3+ and co-doped α-NaYF4: Yb3+,
Ln3+ NPs (Ln3+= Eu3+, and Tb3+). The choice of such ions is oriented by the fact they exhibit strong DC visible emissions under UV excitation, which fit nicely the absorption spectrum of
3
the c-Si cells. The activation by Yb3+ ions, which are well-known for their capability to efficiently absorb near IR radiations around ∼ 1 µm and to convert them into the visible wavelength range by UC mechanism with codoping ions like Er3+, Tm3+ or Ho3+ [23], was used to investigate such process in presence of both Eu3+ or Tb3+ for which only few reports exist [24].
Visible emissions from both singly doped and Yb3+ codoped α-NaYF4 were analyzed through
excitations in the UV and near IR as function of the Eu3+ orTb3+ ions concentrations keeping the Yb3+ concentration fixed at 20 mol.%, value which generally corresponds to the upper limit for which no energy transfer between Yb3+ occurs, as reported in several papers [10-12]. In addition, the luminescence decays of the emitting levels were recorded and discussed in the frame of energy transfer mechanisms occurring between the active ions. As a result, we found that the site symmetry of the crystallographic sites on which the emitting ions are embedded in the NPs diverges and is lowered from the ideal cubic symmetry expected for cubic α-NaYF4. For this reason, a Judd-Offelt calculation was done for a better understanding of the
crystallographic properties and mechanisms of transitions in the case of Eu3+. 2 - Experimental
2.1 - Materials and synthesis
Analytical grade yttrium nitrate hexahydrate (Y(NO3)3.6H2O, 99.9 %), terbium nitrate
pentahydrate (Tb(NO3)3.5H2O, 99.9 %) and ytterbium nitrate pentahydrate (Yb(NO3)3.5H2O,
99.9 %) were obtained from STREM CHEMICALS. Sodium nitrate (NaNO3, 99.5 %) and
ammonium fluoride (NH4F, 95 %) were purchased from PROLAB. Ethylene glycol (EG)
(C2H2O2, 99.8 %) and europium nitrate pentahydrate (Eu(NO3)3.5H2O, 99.9 %) were
respectively purchased from ACROS ORGANICS and SIGMA-ALDRICH. All the above chemicals materials were used directly without further purification.
The α-NaYF4 nanoparticles were synthesized by a facile route, using the coprecipitation
method as illustrated in Fig. 1. Firstly, solution 1 was prepared by dissolving 2 mmol of NaNO3 and 1 mmol of Y(NO3)3.6H2O into 10 mL of EG. Meanwhile, the solution 2 was
obtained by dissolving 6 mmol of NH4F into 25 mL of EG under vigorous stirring. After that,
the solution 1 was added gradually to the solution 2 under vigorous stirring. The resulting mixture was subsequently stirred at room temperature for different reaction times (30 min, 1 hour, 4 hours, 72 hours), and heated at different temperatures (30°C, 60°C, 100°C, 150°C) for 60 min. The final products were collected by centrifugation, washed several times with ethanol and water, and dried at 80 °C for one night.
Eu3+, Tb3+, Eu3+-Yb3+and Tb3+-Yb3+ doped α-NaYF4 were synthesized following the same
procedure by using the optimal parameters of temperature and reaction time determined in the case of undoped α-NaYF4.
2.2 – Characterization
The apparatus and the methods employed for identifying phases and analyzing their morphologies were already described previously [25].
The optical properties were investigated by recording the emission spectra with a Horiba-Jobin-Yvon set-up consisting of a Xenon lamp operating at 400 W monochromatized through Triax 180 then the emitted light was dispersed through Triax 550 and detected with the means
4
of a cryogenically cold charge coupled device (CCD) camera (Symphony LN2 series) for emission spectra.
Temporal evolution of the luminescence were carried out with a pulsed Nd:YAG OPO-Ekspla NT342B laser (3-5 ns pulse duration, 10 Hz, 5 cm-1 line width, 210-2600 nm). The emitted photons were detected at right angle from the excitation and analyzed through Edinburgh FLS980 spectrometer (1200 groove mm-1 grating, blazed at 500 nm, minimum band-pass of 0.1 nm) equipped with Hamamatsu R928P PMT (200-870 nm)
3- Results and discussion
3.1 - Structural and morphological analyses
Fig.2 reports the XRD patterns of undoped and doped α-NaYF4 NPs prepared at room
temperature for several times (30 min, 60 min, 1 hour, 4 hours, and 72 hours), and for 1 h at different temperatures (30°C, 60°C, 100°C, 150°C). The results indicate that, at room temperature (Fig. 2(a)), the reaction time has an influence on the crystallinity of the phases since, when the reaction time is longer than 30 min, the diffraction peaks are more intense. Depending on the temperature (Fig. 2(b)), the beginning of crystallization is observed for the sample obtained at 60 °C up to 150 °C for 1 hour ofsynthesis duration.
The XRD patterns of Eu3+ and Tb3+ doped α-NaY(1-x) F4 (x = 0.01, 0.05, 0.1, 0.2, 0.3)
samples, and α-NaYF4 doped 10 % Eu3+or 10 % Tb3+, codoped with 20 % Yb3+ are depicted
in Fig. 2(c) and Fig. 2(d).
The XRD measurements indicate a relatively good crystallization of the samples, and all the diffraction peaks are well indexed using standard patterns of α-NaYF4 (space group Fm3m,
JCPDS Card No. 01-077-2042).
The calculated cell parameters are gathered in Tables S1 and S2 (Supporting information) for undoped α-NaYF4 and singly doped α-NaYF4 respectively with Eu3+ or Tb3+ ions.
To confirm the evolution of the crystalline cell as a function of the doping rate, the Vegard law has been drawn in the case of Eu3+ ion doping (Fig. S1). A linear increase in the cell volume is observed confirming the partial substitution of Y3+ ions (rY3+ = 1.03Å for six-fold
coordinated) by larger Eu3+ ions (rEu3+ = 1.09Å for six-fold coordinated).
As observed at this stage, the crystallographic data indicate that the best conditions for obtaining pure crystallized phase of undoped α-NaYF4 correspond to a synthesis at 60 °C for
1 hour. To confirm these most suitable parameters to achieve α-NaYF4 NPs, transmission
electron microscopy (TEM) analyses were carried out on the same samples. The pictures recorded from NPs synthesized at room temperature exhibit a cubic morphology whatever the synthesis time (Fig. S2). The edge length of nanocubes lies in the range of 37 to 50 nm depending on the synthesis duration. It is worth noticing that the mean particle size does not change too much between 4h and 72h since all the synthesis precursors have reacted.
Then by setting the synthesis time at 1h, several temperatures were investigated to prepare the α-NaYF4 NPs. On the basis of the TEM pictures (Fig. 3), the most homogeneous and
well-defined nanocubes were obtained at 60°C.
Thus, these conditions have been considered as the most optimized ones for synthesizing Eu3+, Tb3+, Yb3+-Eu3+ and Yb3+-Tb3+ doped α-NaYF4 samples.
5
3.2 - IR spectroscopic studies
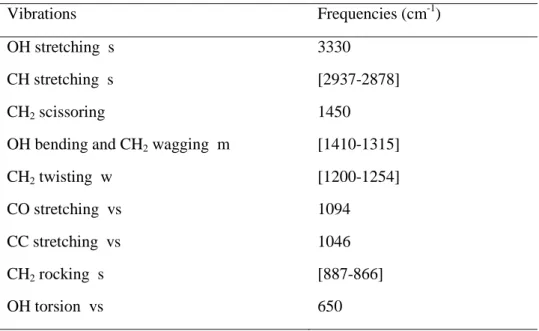
Fig. 4 gathers the ATR infrared spectra recorded in the range 4000-400 cm-1 from ethylene glycol, which was used as solvent, and α-NaYF4:10 % Eu3+ as well as α-NaYF4:10% Tb3+
synthesized at 60°C for 1 h. The interpretation of the spectra was made based on characteristic vibrational bands of EG [26, 27]. According to Table 1, the CH, OH, CC, and CO vibrations bands of EG are located in the region of 4000-500 cm-1; so that they prove the existence of hydrophilic EG molecules coordinated onto the surface of fluorides nanocubes. This peculiar feature will have to be taken into account for further applications.
3.3 - Luminescence properties
All the measurements have been carried out at room temperature. 3.3.1 - Eu3+ doped and Eu3+/Yb3+ co-doped α-NaYF4
Fig. 5 shows the emission spectra of α-NaYF4: Eu3+ (1, 5, 10, 20, 30 mol. %) nanocrystals,
under 380 nm laser excitation. The emissions related to the 5D1 →7F0, 1, 2, and 5D0 →7F0, 1, 2, 3, 4
transitions of Eu3+ ions are observed. The 5D0 →7F0 transition is clearly observed on all the
spectra. In addition, the intensity of the red 5D0 →7F2 emission is quite similar to that of the
orange one (5D0 →7F1). Such observations indicate that the local site symmetry of Eu3+ ions,
which substitute one part of the Y3+ ions, is slightly lowered from the ideal cubic one, as commonly reported in the literature for Eu3+ doped α-NaYF4.
The space group of α-NaYF4 could be Fm3m, and Eu3+ ions substituting Y3+ ions would
ideally possess a crystallographic site with point-group symmetry of Oh. The site occupation
factors (SOF) and positional parameters of cubic NaYF4 crystals are shown in Table 2.
The 5D0 →7F0, 2, 4 emissions should be strictly forbidden, because they are of forced
electric-dipole, and only the magnetic-dipole transition of 5D0 →7F1 would be allowed [28].
According to the branching rules and transition selection rules of the 32 point groups [29], the highest site symmetry of Eu3+, distorted from Oh, is Cs or C2. The crystallographic site
symmetry decreasing from Oh to Cs or C2 was also observed in cubic KLaF4 and KGdF4
nanocrystals which exhibit the same crystal structure [28].
Fig. 6 reports the emission spectrum of α-NaYF4 codoped with Eu3+ (10 mol. %) and Yb3+ (20
mol. %) under 973 nm excitation using OPO laser. We distinctly observe several bands centered at 590 nm, 613 nm, and 700 nm attributed to Eu3+ transitions. However, the emissions observed near 520, 540 and 650 nm correspond unambiguously to the 2H11/2 → 4
I15/2, 4S3/2 → 4I15/2 and 4F9/2 → 4I15/2 transitions of Er3+ ions.
The parasitic emission peaks related to Er3+ in α-NaYF4 are associated with the impurities
existing in the Yb source (having up to 1500 ppm rare earth elements impurities according to the supplier). Such observation was already reported by T. K. Pathak et al. [30], which have analyzed the UC occurring in Eu3+/Yb3+ co-doped α-NaYF4 phosphor. Since the
up-conversion connecting Yb3+ to Er3+ is an efficient process, these results prove that the up-conversion mechanism involving Yb3+ and Eu3+ ions has a weak efficacy but exists.
Fig. 7 reports the luminescence decays of the emissions arising from the 5D0 level of Eu3+
6
5
D0→7F1 or 5D0→7F2 emission. For the low concentrations of Eu3+ ions, the decays exhibit a
rise time which corresponds to the feeding of the 5D0 level due to the de-excitation from the
upper 5D1 level. The time constant of this build-up in the case of α-NaYF4:1%Eu3+ is around
∼ 1 ms confirming that the non-radiative de-excitation connecting 5
D1→5D0 is weak. This rise
is followed by an exponential decaying with a time constant around ∼ 10-11 ms for the concentrations above 10 % content in Eu3+ ions. Beyond this concentration, the decays become non-exponential. The time constant measured in the tail of the decays spread from ∼ 9.3 ms for the sample doped with 10 mol% Eu3+ to ∼ 8 ms for the sample doped with 30 mol. % Eu3+. These values are very high compared to that found in NPs of α-NaYF4 doped with 1
mol. % Eu3+ prepared by emulsion-based wet chemical method, for which the reported lifetime for the 5D0 level is of about 5.9 ms [31] but they are similar to that found in the bulk
α-NaYF4:0.5 % Eu3+ for which the measured lifetime of the 5D0 level reached ∼ 9 ms [32].
Since, in the case of NPs, several defects mainly at the surface of the NPs are known to reduce the radiative lifetime of active ions, such comparison clearly indicates that our samples are of very good quality. In the case of Eu3+, the multiphonon relaxation rate is negligible as there is a large energy gap of about ∼ 17300 cm-1
between the 5D0 emitting level and the 7F0
ground state (the transition 5D0→7F0 lies at ∼ 578 nm). Hence, lifetimes decrease by
concentration quenching is mainly due to energy transfer through cross-relaxation. In the cross-relaxation process, an excited Eu3+ ion in the 5D0 level is coupled with an unexcited one
in its 7F0 ground level by means of dipolar or multipolar interaction. Thus, such interaction
promotes the unexcited Eu3+ ion in its first excited state of 5D0 level. This process competes
adversely with radiative relaxation and gives rise to the phenomenon of self-quenching fluorescence. Therefore, the energy transfer process between the Eu3+ activator ions provides an extra decay channel to change the decay curve profiles, resulting in a non-exponential decay curve.
The luminescence decays recorded with higher Eu3+ concentrations consist of an initial fast and non-exponential stage followed by a nearly exponential one, implying that the cross-relaxation rate is considerably higher than the rate of energy migration; accordingly, the experimental luminescence decay curves are expected to be consistent with theoretical time dependence predicted by the Inokuti-Hirayama (I-H) model [33, 34]:
𝐼
(
𝑡
)
= 𝐼
0𝑒𝑒𝑒 [−
𝜏𝑡 0−
𝐶𝐴 𝐶0𝛤
�
1 −
3 𝑠� �
𝑡 𝜏0�
3 𝑠]
(1)
where t = time; τ0 = lifetime for low Eu3+ ion concentration; s = 6, 8, or 10 for dipole–dipole,
dipole-quadrupole, or quadrupole-quadrupole interactions, respectively; and Γ(1-3/s) = 1.77, 1.43, and 1.30 for s = 6, 8, and 10 respectively. CA is the concentration of acceptor ions.
When the energy transfer process is the cross-relaxation within a system of identical ions, the acceptor concentration equals the total concentration of activators. C0 is the critical
concentration given by C0 = 3 /(4πR03) (R0 is the critical transfer distance defined as the
separation at which the rate of energy transfer between a donor-acceptor pair is equal to the intrinsic decay rate τ0-1). The donor-acceptor energy transfer parameter CDA is related to R0 as
7
When we set s = 6 [Γ(1-3/6) =1.77], τ0 = 11 ms (being a lifetime value for Eu3+ dilute
concentration sample like α-NaY0.99Eu0.01F4), and treat CA/C0 as an adjustable parameter, the
best fits of Eq. (1) (see details in Fig. 7; solid lines in Fig. 7 represent the best fit of Eq. (1)) to the experimental data are achieved, which leads us to conclude that the interaction between Eu3+ ions occurs via a dipole-dipole interaction. When the energy transfer process is the cross-relaxation within a system of identical ions, the acceptor concentration equals the total concentration of activators. The derived and calculated values are listed in Table 3.
The values of the critical radius R0 are calculated for the decay curve of each sample and are
consistent whatever the concentration (∼ 3-4 Å). This value is short indicating that the interaction between two neighboring Eu3+ ions becomes efficient only for very large amount of activator ions.
Same procedure was used to analyze the luminescence decay of the 5D0 excited state of Eu3+
in Yb3+/Eu3+ co-doped α-NaYF4 samples. The Eu3+ concentration was fixed at 10 %
considering that this amount is the upper limit for which the interaction between two neighboring Eu3+ ions is weak. As observed on Fig. 8, the decay of the emission arising from the 5D0 level diverges from a single exponential, notably at short times, in Yb3+/Eu3+ co-doped
α-NaYF4 in comparison with the same decay recorded in the singly doped α-NaYF4 with 10
mol. % in Eu3+.This result is consistent with an energy transfer which occurs from the 5D0
level of Eu3+ to Yb3+ neighbors. The results derived from the fitting by the I-H model are gathered in Table 4. Considering that both Eu3+ and Yb3+ act as acceptors or that only the Yb3+ ions are considered as acceptors, an R0 value of ∼ 4 and ∼ 4.5 Å was obtained
respectively.
These values are quite close each other indicating that the value used for CA has a weak
importance. However, the shape of the decay suggests that the Eu3+→Yb3+ energy transfer occurs more probably at short time.
Fig. 9 reports the up-converted luminescence decays of the emissions peaking at 590 nm and 546 nm in Yb3+/Eu3+ co-doped α-NaYF4 under laser excitation at 973 nm. The decays present
a rise time τR of respectively 0.2 ms and 8 µs followed by exponential decaying characterized
by time constants τL of 3.3 ms and 103 µs respectively. These notable differences observed
confirm that the emission located at 590 nm corresponds to the radiative de-excitation from the 5D0 level of Eu3+ while the emission peaking at 546 nm corresponds to the de-excitation of
the 4S3/2 excited level of Er3+ ions present in the sample as impurities. In the case of Eu3+, the
value of τL is largely shorter than that of the radiative lifetime of the 5D0 level under UV
excitation (∼ 9ms). Such observation indicates that perhaps energy “back transfer” can connect the Eu3+ ions to Yb3+ ions. Such consideration will be the subject of more convincing argument by recording the up-converted decays versus the Eu3+ concentration. At this stage, we can propose a schematic representation (Fig. 10) of the energy transfer mechanism that may occur in Yb3+/Eu3+ co-doped α-NaYF4 samples under NIR excitation into Yb3+ ions.
It is well-known that Eu3+ ions substitute Y3+ ions sites and this substitution almost does not affect the local environment. The intensity of the 5D0→7F2 transition is extremely sensitive to
chemical bonds in the vicinity of Eu3+, and increases with the decrease in the site symmetry of Eu3+ center. On the other hand, the intensity of the 5D0→7F1 transition is independent of the
surroundings of Eu3+. Therefore, the asymmetry ratio (R) is widely used as a criterion of the coordination state and the site symmetry for the RE ions. The higher the value of R is, the
8
lower the symmetry around the Eu3+ ions and the higher the Eu–O covalence are, and vice versa [35, 36].
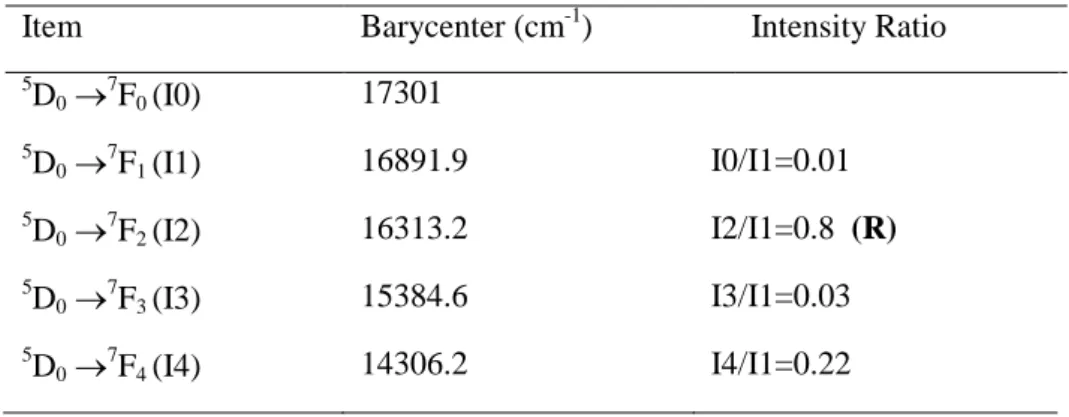
The barycenters and the intensity ratios were determined and listed in Table 5 for α-NaYF4: 1
% Eu3+. Intensities of the main emission bands were normalized and compared to the standard reference 5D0→7F1. Judd-Ofelt (J-O) [37, 38] intensity parameters are essential indicators in
judging radiative potential of RE ions in different hosts, which are usually derived from absorption spectrum. Effective absorption measurement is very difficult for powdered phosphors. However, owing to the special energy level structure of Eu3+, as stated above, they can be calculated from the emission spectra.
The asymmetry ratio R and J-O Ω2 parameter reveal quite similar physical significance of the
symmetric/asymmetric and covalent/ ionic bonding nature between Eu3+ ions and the surrounding ligands. Ω2 is very sensitive to the environment in which Eu3+ ions exist.
Therefore, the maximum value of Ω2 can be related to changes in the structural environment
around the Eu3+ ions because of the hypersensitivity of the 5D0 →7F2 transition. The larger Ω2
parameter is a good indication that the symmetry of the Eu3+ sites is distorted [39, 40]. On the other hand, Ω4 is related to the rigidity and stability of the matrix in which the rare earth ions
are located [40, 41]. The J-O concepts and steps for the calculation of the Ωt parameters have
been reported in several papers and do not need to be repeated. For this reason, we shorten this presentation by retaining only two equations, since they are connected to the nature of the material [42].The transitions of Eu3+ from 5D0 to 7FJ (J=2–4) are electric dipole allowed and
the spontaneous emission probability A from initial manifold J to terminal manifold J’ is given using the following expression:
𝐴(𝐽; 𝐽′) = 64𝜋4𝜈̅3
3ℎ(2𝐽 + 1) �
𝑛(𝑛2+ 2)2
9 � 𝑆𝐸𝐸+ 𝑛3𝑆𝑀𝐸 (2)
where n is the refractive index of the medium (n=1.432-1.438 [43]). υ is the average transition energy (in cm−1), h is the Planck constant (6.63x1027 J.s) and (2J + 1) is the degeneracy of the initial state. SED and SMD are the electric and magnetic dipole strengths. The strength of all
induced dipole transitions can be calculated on basis of only three phenomenological J-O parameters using the following equation:
𝑆𝐸𝐸�5𝐷0; 7𝐹𝐽� = 𝑒2Ωt��Ψ𝐽�𝑈(𝑡)�Ψ𝐽′��2 (3)
where e is the elementary charge, and ��Ψ𝐽�𝑈(𝑡)�Ψ𝐽′��2 is the squared reduced matrix element of unit tensor operator which is independent of the chemical environment of the ion. For the case of Eu3+, these values are given in ref. [44]. The derived values are reported in Table 6. In Table 7, we have reported the calculated values of J-O Ω2,4 parameters.
The estimated value of radiative lifetime τR, for the 5D0 level, derived from J-O theory using Eq.4 for α-NaYF4: 1 % Eu3+ is around ∼ 12.5 ms and close to that experimentally measured
for this sample (∼ 11 ms).
1
𝜏𝑅 = ∑ 𝐴0𝑗
𝑗=4
9
Only few works concern the cubic form α-NaYF4:Eu3+. The most important comparison deals
with the value of 5.03 for Ω2 parameter reported in the literature by P. Ghosh et al. [45].
Analyzing carefully this work, we found that the asymmetry ratio is close to that we have reported: around 1.3 in [46] 1.2 in [45] and 0.8 in our case. Since this ratio exhibits same information than the Ω2 parameter, we suggest that our measurements are closer to the reality than the reported values in the literature, since these values diverge notably from the asymmetry ratio R measured on the depicted emission spectra under UV excitation: ie the
5
D0→ 7F2 electric dipole transition is forbidden in cubic symmetry leading to an asymmetric
ratio R expected to be lower than 1. This is clearly illustrated in the Eu3+ doped α-NaYF4 bulk
for which R is 0.6 [32]. A possible explanation resides in the difference between the measured radiative lifetime of the 5D0 level which is 9.35 ms in [46] and 5.6 ms in [45] while the value
in our sample is 11 ms. Another possibility concerns the value of the refractive index. As reported in the case of nanocrystalline α-Lu2O3:Eu3+ [47], the radiative lifetime of an
electronic transition of an ion embedded in a medium (air in our case) is correlated with an effective refractive index neff, which is a function of the intrinsic refractive index of the
material and the fraction of space occupied by the NPs surrounded by the media with refractive index nmed [48]. The reported results [47] seem to indicate that both radiative
lifetime and asymmetry ratio increase when the refractive index nmed decreases.
The obtained values for the branching ratios (Table 8) are very indicative and close to relative intensities between the main emission transitions connecting the first excited state 5D0 to the
manifolds 7FJ (J = 0–4) as observed in Fig. 5.
3.3.2 - Tb3+ doped and Tb3+/Yb3+ co-doped α-NaYF4
The emission spectra of Tb3+ doped α-NaYF4 samples upon excitation at 380 nm are gathered
in Fig. 11 for several molar concentrations in Tb3+ ions. The emission bands centered at 489, 542, 588 and 620 nm correspond to the transitions connecting the first excited state 5D4 of
Tb3+ ion to 7FJ manifolds of its ground state (J = 6, 5, 4, 3).The 5D4 →7F5 transition is the
most intense as usually reported, conferring the characteristic green emission.
The transitions arising from the 5D3 level are negligible compared to that issuing from the 5D4
as observed in the inset of Fig. 11, indicating that the non-radiative de-excitation from the 5D3
level is fast, probably by means of cross-relaxation mechanism, which is well established in the case of Tb3+ involving the quasi energy resonance between the 5D3 → 7F0,1 emission and
the 7F6 → 5D4 absorption (Tb3+ (5D3) + Tb3+ (7F6) → Tb3+ (5D4) + Tb3+ (7F0,1)).
Same emission spectra are recorded for Tb3+/Yb3+ co-doped α-NaYF4 upon excitation at 380
nm (results not shown). Upon NIR excitation in the Yb3+ ion at 973 nm, only the emissions arising from the excited 5D4 level are observed Fig. 12. A concentration of 10 % in Tb3+ ions
was used in our experiments since the luminescence decay of the 5D4 level of Tb3+ ions, under
UV excitation, starts to diverge from single exponential from 20 % content in Tb3+ ions. 10% in Tb3+ was considered as the best concentration in our studies where no interaction between Tb3+ ions can occur allowing for a better understanding of the Yb3+ → Tb3+ mechanism. Corresponding UC mechanism is proposed and illustrated in Fig. 13 in addition to the UV excitation. The incident photons at 973 nm are absorbed by the Yb3+ ions in the 2F7/2 ground
state and promoted in the 2F5/2 excited state. Because the Tb3+ ions do not have corresponding
energy levels in this range, after excitation of two Yb3+ ions, they can simultaneously transfer their energy to a Tb3+ ion lying in the7F6 ground state, which then is promoted to the excited 5
10
Fig. 14 shows decay curves of 5D4 excited level of Tb3+ ions in α-NaYF4: x % Tb3+ (x = 1, 5,
10, 20, and 30) under 380 nm excitation and monitoring the 5D4→7F5 transition. A very short
rise time (τR) is observed in the case of α-NaYF4: 1 % Tb3+confirming that the non-radiative
de-excitation from the 5D3 level is fast. The other decays are singly exponential with time
constants of ∼ 10-11 ms for the low concentrations. A shorter time constant of about 8 ms was recorded for 20 % Tb3+ content and the decays become non exponential for 30 % content in Tb3+ ions with a shorter time constant around 8 ms. As discussed above in the case of Eu3+ doped α-NaYF4, we have considered that the non-exponential character of the decay is related
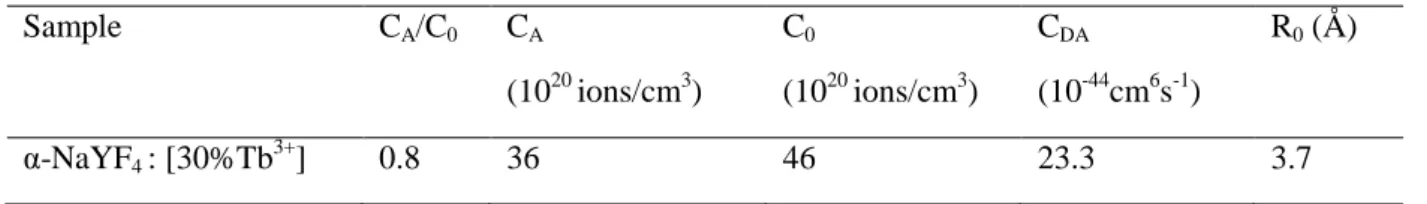
to the interaction occurring between the active ions Tb3+. For this reason, we have fitted this decay using I-H model. Considering that the intrinsic radiative lifetime of the 5D4 level is ∼11
ms, the parameters derived from the fit are gathered in Table 9.
The critical distance R0 and energy transfer microparameter CDA are the same than that
obtained for Eu3+. This observation is not surprising since the part of the exchange interaction is quite similar in the wave function of both 5D4:Tb3+ and 5D0:Eu3+ ions [49]. This means that
the situation is not essentially different for Tb3+ than for Eu3+, except that the 5D4 and 7F6
levels are connected by an optical transition with higher absorption strength than the 7F0 and 5
D0 levels in the case of Eu3+. The quenching of Tb3+ emission in singly doped α-NaYF4 only
reduces the luminescence lifetime by ≈50% in heavily (30 %) doped sample (estimation made by fitting the 5D4 emission decay for this sample by bi-exponential function and using the
time average determination as described in [50]). Same observation concerns the emission of Eu3+ in singly doped α-NaYF4.
The decays of the 5D4 level of Tb3+ in Tb3+/Yb3+ co-doped α-NaYF4 under UV excitation at
380 nm or NIR excitation at 973 nm are reported in Fig. 15. Under UV excitation the decay is exponential with a time constant of 7 ms. This value is lower than that found in singly doped 10 % Tb3+: α-NaYF4 for which the measured lifetime is about 9 ms. Such decrease is
connected to the presence of Yb3+ ions indicating that a Tb3+ →Yb3+ energy transfer occurs. Under NIR excitation, the decay slightly diverges from single exponential, but remains relatively long with time constant in the tail of 6.5 ms which is close to that found in Tb3+/Yb3+ doped α-NaYF4 under UV excitation. Surprisingly, no rise time was recorded for
this decay indicating that the UC mechanism is fast and the Yb3+→Tb3+ energy transfer occurs mostly during the laser pulse. However, we have fitted this decay using I-H model. The derived parameters using τ0 = 11 ms assuming that the concentration of ions acting as
acceptor are only Tb3+ or Tb3+ in addition to Yb3+ are gathered in Table 10. Considering all the I-H fittings reported above, the critical distance R0 remains always around 4 Å.
In order to determine the UC dynamics of Yb3+ / Tb3+ co-doped NaYF4 nanocrystals, the
power dependence of the UC luminescence have also been measured under NIR-CW excitation and shown in Fig. S3. The NIR power of the OPO laser did not allow checking the evolution of the luminescence decays versus the pump power. The photon processes involved can be achieved, according to the relation, I~P(n), where I is the measured UC intensity, P is the incident pump power, and n is the number of pump photons that are required for populating the upper emitting state [51]. The quadratic dependences illustrate that the green emission at 542 nm needs two-photon UC process. Same result was already reported for the
11
UC mechanism in Yb3+/Tb3+-codoped α-NaYF4 nanocrystals synthesized by hydrothermal
process [52].
Conclusion
In summary, α-NaYF4 nanocubes, undoped, singly Eu3+ or Tb3+ doped as well as Eu3+/Yb3+
and Tb3+/Yb3+ co-doped were synthesized at 60°C during 1h by a facile route based on coprecipitation method in ethylene glycol. XRD analysis showed that all the products exhibit α-cubic NaYF4 phase. The TEM images evidenced that the mean edge length of nanocubes
(NCs) was 50 nm with small size dispersion. Under UV and NIR excitations, the luminescence spectra of singly doped samples showed the characteristics emission of Eu3+ or Tb3+ ions. Using the special character of Eu3+ as crystallographic local probe, we have discussed the Judd-Ofelt parameters calculated from the emission spectra of Eu3+ singly doped α-NaYF4. The results indicate that the deformation of the crystallite sites is weak and
the spectral distribution is close to that found in the bulk single crystal with pure cubic structure. Notably, the Ω2 parameter derived from our measurement is not so far from the
asymmetry ratio R2-1 compared to the reported values in the literature for Eu3+ activated
α-NaYF4 nanoparticles. Decay curves of Eu3+ and Tb3+ in singly doped or Yb3+ co-doped NCs
were analyzed under UV and NIR excitations. For both singly or co-doped samples, the decays are mainly exponential and diverge from the exponential when the concentration of active ions such as Eu3+ or Tb3+ is high or when the Yb3+ ion is added in the matrices. In that case, the decays are well fitted using Inokuti-Hirayama model for dipole-dipole interaction, for which the critical distance was found to be around 4∼5 Å suggesting a dipolar interaction occurring at very short distance. Under NIR excitation, the kinetics decay time and pump power dependence analyses show that two Yb3+ ions can simultaneously transfer their energy to the first excited levels 5D0 for Eu3+ and 5D4 for Tb3+ from which two-photon emission
occurs. The efficiency of such up-conversion process is acceptable in the case Yb3+/Tb3+ pair while it is not in the case for Yb3+/Eu3+ pair for which green and red luminescence are recorded because of the presence of Er3+ impurity.
Acknowledgements
This research was performed as a part of joint PHC, Tassili and Tassili Phase II, Algeria-France R&D Project (project N° 16MDU959) supported by Campus Algeria-France (project N° 35079VB). Z.Smara and Y. Cheroura are grateful to the USTHB (Algeria) for providing a training grant under the faculty of physics program 2018-2019 and for the RI of UCA (France) for their facilities supports. We thank Christelle Blavignac (CICS, UCA) for TEM observations.
12
References
[1] G.J. De, W.P. Qin, J.S. Zhang, J.S. Zhang, Y. Wang, C.Y. Cao, Y. Cui, J. Infrared-to-ultraviolet up-conversion luminescence of YF3 :Yb3+, Tm3+ microsheets, J. Lumin. 122,
(2007), 128–130, doi.org/10.1016/j.jlumin.2006.01.120
[2] P.M. Becker, A.A. Olsson, J.R. Simpson, Erbium-Doped Fiber Amplifiers: Fundamentals and Technology, Eds :Academic Press, San Diego, 1999, 460 pages, ASIN : B0089EM0NY [3] R. Reisfeld, C.K. Jørgensen, Lasers and Excited States of Rare Earths, Springer,
Berlin, 1977, 228 pages, ISBN-13 : 978-3-642-66698-8, doi.org/10.1007/978-3-642-66696-4 [4] G. Blasse, B.C. Grabmaier, Luminescent Materials, Springer, Verlag Berlin Heidelberg, 1994, 232 pages, ISBN 978-3-540-58019-5, doi.org/10.1007/978-3-642-79017-1
[5] F. Wang, D. Chatterjee, Z. Li, Y. Zhang, X. Fan, M. Wang, Synthesis of polyethylenimine / NaYF4 nanoparticles with upconversion fluorescence, Nanotechnology, 17, (2006) 5786–
5791, doi.org/10.1088/0957-4484/17/23/013
[6] B.S. Richards, Enhancing the performance of silicon solar cells via the application of passive luminescence conversion layers, Sol. Energy Mater. Sol. Cells. 90, (2006), 2329-2337, doi.org/10.1016/j.solmat.2006.03.035
[7] T. Trupke, M. A. Green, P. Würfel , Improving solar cell efficiencies by down-conversion of high-energy photons, J. Appl. Phys. 92, (2002), 1668-1674, doi.org/10.1063/1.1492021 [8] C. Lorbeer, J. Cybinska, A. Mudring, Facile preparation of quantum cutting GdF3 : Eu3+
nanoparticles from ionic liquids, Chem. Commun. 46, (2010), 571-573, doi.org/10.1039/B919732J
[9] Z. Wang, F. Tao, L. Yao, W. Cai, X. Li, Selected synthesis of cubic and hexagonal NaYF4
crystals via a complex-assisted hydrothermal route, J. Cryst. Growth. 290, (2006), 296–300, doi.org/10.1016/j.jcrysgro.2006.01.012
[10] G. Wang, W. Qin, L. Wang, G. Wei, P. Zhu, D. Zhang, F. Ding, Synthesis and upconversion luminescence properties of NaYF4 :Yb3+/Er3+ microspheres, J. Rare Earths. 27,
(2009), 394, doi.org/10.1016/S1002-0721(08)60258-6
[11] Y. Ma, M. Chen, M. Li, Hydrothermal synthesis of hydrophilic NaYF4:Yb, Er
nanoparticles with bright upconversion luminescence as biological label, Mater. Lett. 139, (2015), 22–25, doi.org/10.1016/j.matlet.2014.10.042
[12] G. Wang, W. Qin, J. Zhang, L. Wang, G. Wei, P. Zhu, R. Kim, Controlled synthesis and luminescence properties from cubic to hexagonal NaYF4:Ln3+ (Ln = Eu and Yb/Tm)
microcrystals, J. Alloy. Compd. 475, (2009), 452–455, doi.org/10.1016/j.jallcom.2008.07.050 [13] J. Wang, Y. Zhao, B. Li, L. Sun, J. Chen, Solvothermal synthesis and down / up conversion luminescence properties of Ln3+-doped NaYF4 nanocrystals, Mater. Lett. 93,
13
[14] G. Chen, T. Y. Ohulchanskyy, R. Kumar, H. Agren, P. N. Prasad, Ultrasmall Monodisperse NaYF4: Yb3+/Tm3+ Nanocrystals with Enhanced Near-Infrared to Near-Infrared
Upconversion Photoluminescence, ACS Nano, 4, (2010), 3163–3168, doi.org/10.1021/nn100457j
[15] X. Gao, N. Wang, T. Shi, S. Wang, M. Zhang, W. Zhang, J. Zhong, H. Tong, X. Zhang, Sol-gel synthesis of β-NaYF4: Yb3+/Nd3+/Tm3+/Mn2+ nanophosphors and color-tunable
upconversion luminescence, J. Fluorine Chem. 188, (2016), 23–27, doi.org/10.1016/j.jfluchem.2016.06.002
[16] X. Huang, G. Hu, Q. Xu, X. Li, Q. Yu, Molten-salt synthesis and up conversion of hexagonal NaYF4: Er3+:Yb3+ micro/nano-crystals, J. Alloys Comp. 616, (2014), 652–661,
doi.org/10.1016/j.jallcom.2014.07.067
[17] A. A. Arnold, V. Terskikh, Q. Y. Li, R. Naccache, I. Marcotte, J. A. Capobianco, Structure of NaYF4 Up converting Nanoparticles: A Multinuclear Solid-State NMR and DFT
Computational Study, J. Phys. Chem. C. 117, (2013), 25733−25741, doi.org/10.1021/jp405813a
[18] J.F. Suyver, A. Aebischer, S. Garcia-Revilla, P. Gerner, H.U. Güdel, Anomalous power dependence of sensitized upconversion luminescence. Phys. Rev. B. 71, (2005), 125123, doi:10.1103/physrevb.71.125123
[19] Y. Han, S. Gai, P. Ma, L. Wang, M. Zhang, S. Huang, P. Yang, Highly Uniform α‑ NaYF4:Yb/Er Hollow Microspheres and Their Application as Drug Carrier. Inorg. Chem.
52, (2013), 9184-9191, doi.org/10.1021/ic4001818
[20] N.O. Nunez, H. Miguez, M. Quintanilla, E. Cantelar, F. Cusso, M. Ocana, Synthesis of Spherical Down- and Up-Conversion NaYF4-Based Nanophosphors with Tunable Size in
Ethylene Glycol without Surfactants or Capping Additives. Eur. J. Inorg. Chem., (2008), 4517-4524, doi: 10.1002/ejic.200800363
[21] P. Lei, R. An, S. Yao, Q. Wang, L. Dong, X. Xu, K. Du, J. Feng, H. Zhang, Ultrafast Synthesis of Novel Hexagonal Phase NaBiF4 Upconversion Nanoparticles at Room
Temperature, Adv. Mater. 29, (2017), 1700505, doi.org/10.1002/adma.201700505
[22] H. Li, L. Xu, G. Chen, Controlled Synthesis of Monodisperse Hexagonal NaYF4: Yb/Er
Nanocrystals with Ultrasmall Size and Enhanced Upconversion Luminescence, Molecules, 22 (2017), 2113, doi.org/10.3390/molecules22122113
[23] N. Niu, F. He, S. Gai, C. Li, X. Zhang, S. Huang, P. Yang, Rapid microwave reflux process for the synthesis of pure hexagonal NaYF4:Yb3+,Ln3+,Bi3+ (Ln3+ ¼ Er3+, Tm3+, Ho3+)
and its enhanced UC Luminescence, J. Mater. Chem. 22, (2012), 21613-21623, doi.org/10.1039/C2JM34653B
[24] K. Prorok, A. Gnach , A. Bednarkiewicz, W. Stręk. Energy up-conversion in Tb3+/Yb3+ co-doped colloidal α-NaYF4 nanocrystals, J. Lumin. 140, (2013), 103–109,
14
[25] Y. Cheroura, Z. Smara, A. Potdevin, D. Boyer, A. Chafa, O. Ziane, R. Mahiou, Mater. Res. Bull. 125, (2020), 110809, doi.org/10.1016/j.materresbull.2020.110809]
[26] P. Buckley, P. A. Giguere, Infrared studies on rotational isomerism. I. Ethylene glycol, Can. J. Chem. 45, (1967), 397-407, doi.org/10.1139/v67-070
[27] G. Socrates, Infrared and Raman characteristic group frequencies tables and charts-Wiley (2001) Upconversion Photoluminescence, ACS Nano, 4, (2010), 3163–3168, doi.org/10.1021/nn100457j
[28] D. Tu, Y. Liu, H. Zhu, R. Li, L. Liu, U. Chen, Breakdown of Crystallographic Site Symmetry in Lanthanide-Doped NaYF4, Angew. Chem. Int. Ed. 52, (2013), 1128 –1133,
doi.org/10.1002/anie.201208218
[29] Q. Ju, Y. S. Liu, R. F. Li, L. Q. Liu, W. Q. Luo, X. Y. Chen, Optical Spectroscopy of Eu3+-Doped BaFCl Nanocrystals, J. Phys. Chem. C. 113, (2009), 2309 – 2315, doi.org/10.1021/jp809233p
[30] T. K. Pathak, A. Kumar, L. J. Erasmus, A. Pandey, E. Coetsee, H. C. Swart, R. E. Kroon, Highly efficient infrared to visible up-conversion emission tuning fromred to white in Eu/Yb co-doped NaYF4 phosphor, Spectrochim. Acta. A. 207, (2019), 23-30,
doi.org/10.1016/j.saa.2018.08.064
[31] P. Ghosh, A. Patra, Tuning of Crystal Phase and Luminescence Properties of Eu3+ Doped Sodium Yttrium Fluoride Nanocrystals, J. Phys. Chem. C. 112, (2008), 3223-3231, doi.org/10.1021/jp7099114
[32] D. Jiang, H. Xia, J. Zhang, C. Wang, Z. Feng,S. He, Q. Tang, Q. Sheng, B. Chen & H. Jiang. Luminescent properties of Eu3+ doped α-NaYF4 single crystal under NUV-excitation, J.
Mod. Optic. 64, (2016), 164-169, doi.org/10.1080/09500340.2016.1218076
[33] M. Inokuti, F. Hirayama, Influence of Energy Transfer by the Exchange Mechanism on Donor Luminescence, J. Chem. Phys. 43, (1965), 1978-1989, doi.org/10.1063/1.1697063 [34] X. Zhang, W. Jiang, H. J. Seo, Analysis of Energy Transfer and Concentration Quenching in Sm3+-Activated Borate Gd3BO6 Phosphors by Means of Fluorescence
Dynamics, Spectrosc. Lett., 48, (2015), 27-31, doi.org/10.1080/00387010.20.2013.850778 [35] K. Binnemans, K. Van Herck, C. Görller-Walrand, Influence of dipicolinate ligands on the spectroscopic properties of europium (III) in solution, Chem. Phys. Lett. 266, (1997), 297–302, doi.org/10.1016/S0009-2614(97)00012-2
[36] R. Reisfeld, E. Zigansky, M. Gaft, Europium probe for estimation of site symmetry in glass films, glasses and crystals, Mol. Phys. 102, (2004), 1319–1330, doi.org/10.1080/00268970410001728609
[37] B.R. Judd, Optical absorption intensities of rare-earth ions, Phys. Rev. 127, (1962), 750– 761, doi.org/10.1103/PhysRev.127.750
15
[38] G.S. Ofelt, Intensities of crystal spectra of rare-earth ions, J. Chem. Phys. 37, (1962), 511–520, doi.org/10.1063/1.1701366
[39] K. Binnemans, Interpretation of europium (III) spectra, Coord. Chem. Rev. 295, (2015), 1–45, doi.org/10.1016/j.ccr.2015.02.015
[40] C. Görller-Walrand, K. Binnemans, Spectral Intensities of Transitions, Handbook on the Physics and Chemistry of Rare Earths vol 25, Elsevier, 1998, 101–264, ISBN: 978-0-444-50185-1
[41] G. Anjaiah, S.K. Nayab Rasool, P. Kistaiah, Spectroscopic and visible luminescence properties of rare earth ions in lead fluoroborate glasses, J. Lumin. 159, (2015), 110–118, doi.org/10.1016/j.jlumin.2014.10.068
[42] S. Sebai, D. Zambon, A. Watras, P.J. Dereń, A. Megriche, R. Mahiou, Opt. Mater.92, (2019), 217–222, https://doi.org/10.1016/j.optmat.2019.04.037 ]
[43] R. E. Thoma, G. M. Hebert, H. Insley, C. F. Weaver, Phase Equilibria in the System Sodium Fluoride-Yttrium Fluoride, Inorg. Chem. 2, (1963), 1005-1012.
[44] W.T. Carnall, H. Crosswhite, H.M. Crosswhite, Energy Level Structure and Transition Probabilities in the Spectra of the Trivalent Lanthanides in LaF3, Report Argonne National
Laboratory, Chemistry Division, Argonne IL, 1977
[45] P. Ghosh, A. Patra, Influence of Crystal Phase and Excitation Wavelength on Luminescence Properties of Eu3+-Doped Sodium Yttrium Fluoride Nanocrystals, J. Phys. Chem. C. 112, (2008), 19283-19292,doi.org/10.1021/jp807539r
[46] C. Cao, H. K. Yang, J. W. Chung, B. K. Moon, B. C. Choi, J. H. Jeong, K. H. Kim, Hydrothermal synthesis and optical properties of Eu3+ doped NaREF4 (RE = Y, Gd), LnF3 (Ln
= Y, La), and YF31.5NH3 micro/nanocrystals, Mater. Res. Bull. 46, (2011), 1553–1559,
doi.org/10.1016/j.materresbull.2011.06.026
[47] J. C. Boyer, F. Vetrone, J. A. Capobianco, A. Speghini, and M. Bettinelli, Variation of Fluorescence Lifetimes and Judd-Ofelt Parameters between Eu3+ Doped Bulk and Nanocrystalline Cubic Lu2O3, J. Phys. Chem B. 108, (2004), 20137-20143,
doi.org/10.1021/jp0480504
[48] R. Meltzer, S. P. Feofilov, B. Tissue, H. B. Yuan Dependence of fluorescence lifetimes of Y2O3:Eu3+ nanoparticles on the surrounding medium, Phys. Rev. B. 60, (1999),
14012-14015, doi.org/10.1103/PhysRevB.60.R14012
[49] G. Blasse, Luminescence of inorganic solids: from isolated centres to concentrated systems, Prog. Solid. St. Chem. 18, (1988), 79-171, doi.org/10.1016/0079-6786(88)90004-0 [50] R. K. Bauer, P. de Mayo, L.V. Natarajan, W. R. Ware, Can. Surface photochemistry: the effect of surface modification on the photophysics of naphthalene and pyrene adsorbed on silica gel, J. Chem. 62, (1984), 1279-1286, doi.org/10.1139/v84-213
16
[51] B. P. Sobolev, D. A. Mineev, V. P. Pashutin, Low temperature hexagonal modification of NaYF4 having the gagarinite structure, Dokl. Akad. Nauk SSSR, 150, (1963), 791–794.
[52] H. Liang, G. Chen. Li. Liu, F. Qin, Z. Zhang, Upconversion luminescence in Yb3+/Tb3+ codoped monodisperse NaYF4 nanocrystals, Opt. Commun. 282, (2009), 3028-3031,
17
Fig. 1. Schematic diagram describing the synthesis process of α-NaYF4 nanoparticles.
18
Fig. 2. XRD patterns of α-NaYF4 NPs (a) synthesized at room temperature for different reaction time, (b) synthesized at 30°C, 60°C, 100°C, and 150°C for 1 hour, (c) XRD patterns of Tb3+ doped α-NaYF4 NPs synthesized at 60°C for 1 h, and co-doped with 20 % Yb
3+
/ 10 % Tb3+ and (d) XRD patterns of Eu3+ doped α-NaYF4 NPs synthesized at 60°C for 1 h, and co-doped with 20 % Yb
3+ / 10 % Eu3+.
1h-60 °C 1h-60 °C
(JCPDS Card No. 01- 077-2042) (JCPDS Card No. 01- 077-2042)
(a) (b) RT-30 min RT-1 hour RT-4 hours RT-72 hours 1h-30 °C 1h-60 °C 1h-100 °C 1h-150 °C Int ens ity ( a. u. ) 2θ (degree) 2θ (degree) Int ens ity ( a. u. ) (JCPDS Card No. 01- 077-2042) (c) (d) 30%Eu3+ 20%Eu3+ 10%Eu3+ 5%Eu3+ 1%Eu3+ 2θ (degree) 2θ (degree) Int ens ity ( a. u. ) Int ens ity ( a. u. ) 30% Tb3+ 20% Tb3+ 10% Tb3+ 5% Tb3+ (JCPDS Card No. 01- 077-2042) 1% Tb3+ 10%Eu3+/ 20%Yb3+ 10%Tb3+/ 20%Yb3+
19
Fig. 3. TEM of α-NaYF4 for one hour of reaction time at different temperatures: (a) 60°C, (b) 100°C, (c) 150°C and corresponding particles size distribution.
20
Fig. 4. Infrared spectra of EG, α-NaYF4 : 10 % Eu
3+, and α-NaYF 4 : 10 % Tb 3+ samples. 4000 3500 3000 2500 2000 1500 1000 500
Ethylene Glycol
α-NaY
0.9Eu
0.1F
4α-NaY
0.9Tb
0.1F
4Int
ens
it
y
(
a
.
u
.)
wavenumber
(
cm
-1)
21
Fig. 5. Emission spectra of α-NaYF4 doped (1, 5, 10, 20, 30) % Eu 3+ under UV excitation at 380 nm.
500
550
600
650
700
5D
2→
7F
3 5D
1→
7F
1 5D
0→
7F
0 5D
0→
7F
4 5D
0→
7F
3 5D
0→
7F
2 5D
0→
7F
1 5D
1→
7F
2 5D
1→
7F
01% Eu
3+5% Eu
3+10% Eu
3+20% Eu
3+30% Eu
3+Int
ens
ity
(
a.
u.
)
Wavelength (nm)
l
Exc= 380 nm
T= 300 K
22
Fig. 6. Emission spectra of α-NaYF4 co-doped 10% Eu 3+ / 20 % Yb3+ under 973nm excitation. 4
S
3/ 2→
4I
15/ 2(
Er
3+)
2H
11/ 2→
4I
15/ 2(
Er
3+)
500
550
600
650
700
Int
ens
ity
(
a.
u.
)
Wavelength (nm)
l
Exc= 973 nm
T=300K
5D
0→
7F
1(
Eu
3+)
4F
9/ 2→
4I
15/ 2(
Er
3+)
5D
0→
7F
2(
Eu
3+)
5D
0→
7F
4(
Eu
3+)
23
Fig. 7. Experimental emission decays (λexc = 380 nm, λem = 590 nm) of the 5
D0 level of Eu
3+ in α-NaYF4 : x % Eu
3+
(x =1, 5, 10, 20, 30). Solid lines represent fitting decays plotted using bi-exponential function (one in the rise and the other in the tail of the decays) for lower dopant concentration samples and using the I-H model for higher dopant concentration samples.
0 20 40 60 80 100 10-9 10-8 10-7 10-6 10-5 10-4 10-3 10-2 10-1 100 101 τ R= 0. 8 ms τ R= 1.1 ms lExc = 380 nm lEm = 590 nm T=300 K 1%Eu3+ 5%Eu3+ 10%Eu3+ 20%Eu3+ 30%Eu3+
Log
In
tens
it
y
(
a.
u.
)
Time (ms)
24
Fig. 8. Experimental emission decays (λexc = 380 nm, λem = 590 nm) of the 5 D0 level of Eu 3+ in α-NaYF4: 10 % Eu 3+ / 20 % Yb3+ and of Eu3+ in α-NaYF4 : 10 % Eu 3+
For comparison. Solid lines represent fitting decay derived using the I-H model.
0 20 40 60 80 100 100 101 102 103 104 105
Log I
nt
ens
ity
(
a.
u.
)
Time (ms)
l
Em= 590 nm
α-NaYF
4:10% Eu
3+α-NaYF
4:10% Eu
3+/20% Yb
3+l
Exc= 380 nm
T= 300 K
25
Fig. 9. Experimental up-converted emission decays of both Eu3+ : 5D0 (λem = 590 nm) and Er 3+
: 4S3/2 (λem = 546 nm) excited levels in α-NaYF4 doped 10 % Eu
3+
/ 20 % Yb3+ under laser excitation at 973 nm. Solid lines represent fitting decay derived using bi-exponential function.
lEm=546 nm lExc=973 nm τR= 8 µs τL= 103 µs α-NaYF4:10% Eu3+ / 20% Yb3+
Time (ms)
Log I
n
tens
ity
(
a
. u.
)
(a) (b) α-NaYF4:10% Eu3+ / 20% Yb3+ lEm=590 nm lExc=973 nm τR= 0.2 ms τL= 3.3 msLog I
n
tens
ity
(
a
. u.
)
Time (ms)
26
Fig. 10. Energy level diagram of the Eu3+ and Yb3+ ions as well as the proposed UC mechanism in α-NaYF4 : Eu 3+ /Yb3+. 0 5 10 15 20 25
E
ner
gy
(10
3cm
-1 ) Eu3+ 550 nm 546 nm 522 nm 700 nm 613 nm 5 D1 Er3+ 2 H 9/2 4 F 7/2 4 F 3/2 4 F9/2 4 I9/2 4 I11/2 4 I13/2 2 F7/2 2 F5/2 Yb3+ 973 nm 4 I15/2 4 S3/2 4 H 11/2 7 FJ J=0-4 5 D0 590 nm27
Fig. 11. Emission spectra of (1, 5, 10, 20, 30) % Tb3+ doped α-NaYF4 under UV excitation at 380 nm. The inset shows the magnification of emission arising from the 5D3 level of Tb
3+ .
400
450
500
550
600
650
1% Tb
3+5% Tb
3+10% Tb
3+20% Tb
3+30% Tb
3+Int
ens
ity
(
a.
u.
)
Wavelength (nm)
l
Exc= 380 nm
T=300 K
5D
4→
7F
3 5D
4→
7F
4 5D
4→
7F
6 5D
4→
7F
528
29
Fig. 13. Energy level diagram of Yb3+/Tb3+ co-doped α-NaYF4 as well as the proposed UC mechanism.
0
10
20
30
380 nm
413 nm
436 nm
542 nm
588 nm
620 nm
Tb
3+ 2F
7/2 5 D1 5 D3 7 F0-2 7 F3 7 F4 7 F6 7 F5 5 D4 2F
5/2Yb
3+489 nm
973 nm
E
ner
gy
(
10
3cm
-1)
30
Fig. 14. Decay curves of the 5D4 excited level of Tb
3+ in α-NaYF
4 doped Tb 3+
under UV excitation at 380 nm. Solid lines represent fitting decays derived using non-exponential function (one in the rise and other in the tail of the decays) for lower dopant concentration samples, and using the I-H model for 30 % dopant concentration sample.
0 20 40 60 80 100 10-4 10-3 10-2 10-1 100 101 102 103 104 105 106 τR= 0.3 ms lExc=380 nm lEm=542 nm T=300 K
Log
In
tens
it
y
(
a.
u.
)
Time (ms)
1% Tb3+ 5% Tb3+ 10% Tb3+ 20% Tb3+ 30% Tb3+31
Fig. 15. Decay curves of the 5D4 → 7
F5 transition of Tb 3+
in 10 % Tb3+ / 20 % Yb3+ co-doped α-NaYF4 under IR and UV excitation. Solid lines represent fitting decay derived using exponential function for UV excitation, and using the I-H model for NIR excitation.
0
10
20
30
40
10
010
110
210
310
4NaYF
4:10% Tb
3+/20% Yb
3+, l
Exc=973 nm
NaYF
4:10% Tb
3+/20% Yb
3+, l
Exc=380 nm
Log
Int
ens
ity
(
a.
u.
)
Time (ms)
l
Em=542 nm
T=300 K
32
Table 1. Symmetry classes of the normal vibrations of ethylene glycol Vs frequencies.
Vibrations Frequencies (cm-1)
OH stretching s CH stretching s CH2 scissoring
OH bending and CH2 wagging m CH2 twisting w CO stretching vs CC stretching vs CH2 rocking s OH torsion vs 3330 [2937-2878] 1450 [1410-1315] [1200-1254] 1094 1046 [887-866] 650
Table 2. Positional parameters and site occupation factors (SOF) of cubic α-NaYF4 crystals.
Table 3. The experimental values of CA/C0, critical concentration (C0), energy transfer microparameter (CDA), and critical distance (R0) obtained from I-H model.
Sample CA/C0 CA (1020 ions/cm3) C0 (1020 ions/cm3) CDA (10-44 cm6s-1) R0 (Å) α-NaYF4 [10% Eu 3+ ] 0.2 12.1 71 9.8 3.2 α-NaYF4 [20% Eu 3+ ] 0.3 24 85 6.6 3 α-NaYF4 [30% Eu 3+ ] 0.8 36 46 23.3 3.7
Phase Atom Site x/a y/b z/c SOF
Cubic (Fm-3m)
Y 4a 0 0 0 0.5
Na 4a 0 0 0 0.5
33
Table 4. The experimental values of CA/C0, critical concentration (C0), energy transfer microparameter (CDA), and critical distance (R0) obtained from I-H model.
Sample CA/C0 CA (1020 ions/cm3) C0 (1020 ions/cm3) CDA (10-44cm6s-1) R0 (Å) α-NaYF4 : [10% Eu3+/20%Yb3+] 0.9 36 40 32 3.9 α-NaYF4 : [10% Eu3+/20%Yb3+] 0.9 24 27 75.5 4.5
Table 5. Integrated intensity ratios in α-NaYF4: 1% Eu 3+
compounds (The notation In/I1 refers to the intensity ratios 5D0→ 7 Fn/ 5 D0→ 7 F1 where n= (0, 2, 3, 4).
Item Barycenter (cm-1) Intensity Ratio
5 D0 → 7 F0 (I0) 17301 5 D0 → 7 F1 (I1) 16891.9 I0/I1=0.01 5 D0 → 7 F2 (I2) 16313.2 I2/I1=0.8 (R) 5 D0 →7F3 (I3) 15384.6 I3/I1=0.03 5 D0 → 7 F4 (I4) 14306.2 I4/I1=0.22
Table 6 . SED: The strength of an electrical dipole, SMD: The strength of an magnetic dipole, A (J, J’): Probabilities of each spontaneous emission (radiative rates).
Transition l(nm) SED 10-65C2m2 SMD A(J,J’) 10-65C2m2 S-1 5 D0→ 7 F1 590 5 D0→ 7 F2 613 9.83 5 D0→7F4 700 3.06 10.44 35.23 26.32 5.50
34
Table 7. Comparison of the J-O parameters for the 5D0 → 7 F2 (𝛺2) and 5 D0 → 7 F4 (𝛺4) transitions of Eu3+ in similar materials. This work [45] [46] Ω2× 10⁻²⁰𝑐𝑐2 1.2 5.03 6.13 Ω4× 10⁻²⁰𝑐𝑐2 0.52 5.88
Table 8. Calculated branching ratios of α-NaYF4: 1%Eu 3+ . β (0 →0) β (0 →1) β (0 →2) β (0 →3) β (0 →4) α-NaYF4: 1%Eu 3+ 0.006 0.48 0.39 0.02 0.1
Table 9. The experimental values of CA/C0, critical concentration (C0), energy transfer microparameter (CDA), and critical distance (R0) obtained from I-H model.
Sample CA/C0 CA (1020 ions/cm3) C0 (1020 ions/cm3) CDA (10-44cm6s-1) R0 (Å) α-NaYF4 : [30%Tb 3+ ] 0.8 36 46 23.3 3.7
Table 10. The experimental values of CA/C0, critical concentration (C0), energy transfer microparameter (CDA), and critical distance (R0) obtained from I-H model.
Sample CA/C0 CA (1020 ions/cm3) C0 (1020 ions/cm3) CDA (10-44cm6s-1) R0 (Å) α-NaYF4 : [10%Tb3+/20%Yb3+] 0.7 36 54 16.7 3.5 α-NaYF4 : [10%Tb3+/20%Yb3+] 0.7 24 36 52.3 4.1