HAL Id: hal-02789461
https://hal.inrae.fr/hal-02789461
Submitted on 5 Jun 2020HAL is a multi-disciplinary open access archive for the deposit and dissemination of sci-entific research documents, whether they are pub-lished or not. The documents may come from teaching and research institutions in France or abroad, or from public or private research centers.
L’archive ouverte pluridisciplinaire HAL, est destinée au dépôt et à la diffusion de documents scientifiques de niveau recherche, publiés ou non, émanant des établissements d’enseignement et de recherche français ou étrangers, des laboratoires publics ou privés.
. Inra, . Ifip, . Aafc
To cite this version:
. Inra, . Ifip, . Aafc. Prototypes of precision feeding systems gestating and lactating sows. [Contract] D4.6, 2019. �hal-02789461�
Page 1/38
FEED-A-GENE
Adapting the feed, the animal and the feeding techniques to
improve the efficiency and sustainability of monogastric livestock
production systems
Deliverable D4.6
Prototypes of precision feeding
systems gestating and lactating sows
Due date of deliverable: M55
Actual submission date: M55
Start date of the project: March 1
st, 2015
Duration: 60 months
Organisation name of lead contractor: INRA
Revision: V1
Dissemination level
Public - PU
X
Confidential, only for members of the consortium (including Commission
Services) - CO
Page 2/38
Table of contents
1.
Summary ... 3
2.
Introduction ... 5
3.
General description of the precision feeding systems ... 6
3.1
General approach ... 6
3.2
Description of the Decision Support System (DSS) ... 6
3.3
Description of the models used for the determination of nutrient
requirement during gestation and lactation ... 8
4.
Databases used for the evaluation of the precision feeding systems . 9
5.
Evaluation of the precision feeding system for lactation ... 10
5.1
Variability of nutrient requirement during lactation ... 10
5.2
Evaluation of a precision feeding strategy for lactation ... 12
6.
Evaluation of the precision feeding system during gestation ... 15
6.1
Variability of nutrient requirement during gestation ... 15
6.2
Evaluation of a precision feeding strategy for gestation ... 17
7.
General description of the pre-industrial precision feeder system
prototypes for sows ... 19
7.1
Feeding system for gestating sows (device developed at IFIP) ... 19
7.2
Feeding systems for gestating and lactating sows (devices developed at
INRA) 25
8.
Conclusion ... 28
9.
References ... 30
Annex 1 – Detailed description of the nutritional model used for lactating
sows ... 32
Annex 2 – Detailed description of the nutritional model used for gestating
sows ... 35
Page 3/38
1. Summary
Objectives
Nutritional studies indicate that nutrient requirements for pregnant and lactation differ largely among sows and according tbo the stage of pregnancy or lactation, whereas in practice the same feed is generally fed to all sows in a given herd, for a given physiological stage (i.e., gestation or lactation). The availability of new technologies for high-throughput phenotyping of sows and their environment, and of innovative feeders that allow the distribution of different diets, offers opportunities for a renewed and practical implementation of prediction models of nutrient requirements to improve animal performance and the efficiency of nutrient utilisation, and to reduce feed costs and environmental impacts. The objective of this task was to develop prototypes of precision feeding systems, including the development of the decision support system (DSS) for gestating and lactating sows allowing the distribution of a tailored ration to each sow on each day.
Rationale:
The precision feeding system is based on the development of a decision support system (DSS) connected to an automated feeder for feed distribution. This DSS informs the feeder with the amount of each of the different diets to be fed to a given sow over a given day or period, generally two diets differing in their nutrient content. To take that decision, the DSS uses the flow of information relative to the individual sow, her housing conditions and the general feeding strategy in the farm. This information may be provided by sensors and or by the farmer and is stored in a herd database. From the available information, which may vary according to the equipment available on the farm and the data management system, the DSS builds the "best guess" decision to be transmitted to the automated feeder. This involves two steps: (i) the determination of the energy, amino acid, and mineral requirements and (ii) the determination of the amount and composition of the ration to be fed. This ration is prepared by mixing (generally two) different diets available in the automated feeder.
Energy and nutrient requirements are determined according to a factorial approach. The metabolizable energy requirement is calculated as the sum of the requirements for maintenance, physical activity, thermoregulation, growth, and the constitution of body reserves, and (i) development of foetuses and uterine contents during gestation or (ii) synthesis of milk during lactation. These calculations were adapted from the InraPorc® model with some
improvements based on recent literature results.
Farm data were used for an in silico evaluation of the precision feeding systems. For gestation, the database was obtained from an experimental farm and contained data from 2511 gestating sows with information about their body condition at mating (i.e., body weight (BW) and backfat thickness (BT) and, at farrowing, their performance (i.e., prolificacy, piglet birth weights). For lactation, the database was obtained from two experimental farms with data from 633 and 817 lactating sows (i.e., parity, body condition at farrowing, and daily feed intake) and their litter (i.e., litter size throughout lactation and piglet weights at birth and at weaning). These data were used to calibrate the parameters of InraPorc® for these phenotypes.
The databases were used to evaluate the interest of precision feeding strategy through simulation approaches. A conventional 1-phase feeding strategy (CF) was compared to a precision feeding (PF) strategy consisting of the mixing of two diets with either a low (L) or a high (H) nutrient content.
Page 4/38
For gestation, the CF, L, and H diets contained 4.8, 3.0, and 6.0 g/kg standardized digestible (SID) lysine, and 14, 9, and 16% crude protein, respectively. On average, the level of incorporation of diet L in the PF strategy was 84%, the value being lower in first parity sows (67%). The level or incorporation of diet L decreased during gestation from almost 100% in the first week to less than 30% in the last week, in agreement with the change in amino acid requirements. Compared to the CF strategy, the PF strategy resulted in a 27% decrease in total SID lysine supply and in a 24% decrease in the total crude protein supply. The nitrogen excretion was reduced by 30%, whereas the feed cost decreased by 4.6%. The proportion of sows that were underfed in the last two weeks of lactation decreased from more than 60% with CF to less than 5% with PF. For first parity sows, the difference was even more marked. Conversely, the proportion of sows that were overfed was drastically reduced with PF strategy.
For lactation, the CF, L, and H diets contained 8.5, 11.5 and 6.5 g/kg SID lysine, respectively. On average, the level of incorporation of diet L in the PF strategy was 87%, the value being lower in first parity sows, which have lower feed intake. This resulted in a reduction by about 8% of the average lysine intake, a reduction of 7.1% of N excretion, and a reduction of 1.5% in feed cost. With CF, about 60% of the sows received lysine that was more than 10% in excess of their requirements, and about 20% of the sows received less than 90% of their requirements. With PF, up to 60% sows were adequately fed (i.e., between 90% and 110% of their requirements), and about 10% of the sows were underfed. With PF, protein intake was reduced on average by 5.1%, N excretion was reduced by 8.5%, and feed cost was reduced by 1.5%.
The DSS were validated in silico using a large number of real farm data. For both gestation and lactation, a conventional 1-phase feeding strategy (CF) was compared to a precision feeding (PF) strategy consisting in the mixing of two diets with either a low (L) or a high (H) nutrient content. With precision feeding during gestation, protein intake was reduced by 24% compared to conventional feeding and N excretion was reduced by almost 30%. The average feed cost was decreased by 4.6%. The proportion of sows that were underfed in the last two weeks of gestation was drastically reduced with precision feeding, whereas in the beginning of gestation, the proportion of overfed sows was reduced. With precision feeding during lactation, protein intake was reduced by 5.1%, N excretion was reduced by 8.5%, and feed cost was reduced by 1.5%.
Three different prototypes of precision feeding systems have been implemented on the basis of the adaptation of industrial equipment, one at IFIP for gestation and two at INRA for gestation and lactation. They are now available for demonstration.
Teams involved:
INRA (FR): Jean-Yves Dourmad; Raphaël Gauthier, Charlotte Gaillard, Benoit Blanchet, Serge Dubois
IFIP (FR): Nathalie Quiniou, Michel Marcon
Agriculture and Agrofood Canada (CA): Candido Pomar
Page 5/38
2. Introduction
Nutritional studies indicate that nutrient requirements for pregnant and lactation differ largely among sows and according to the stage of pregnancy or lactation, whereas in practice the same diet is generally fed to all sows in a given herd for a given physiological stage (i.e., gestation or lactation).
During lactation, nutrient requirements depend mainly on the sow’s milk yield and feed intake, and vary greatly among individuals (Dourmad et al., 2008; NRC, 2012). In practice, the same standard lactation diet is generally provided to all sows in the herd, and nutrient intake is often insufficient to meet the nutrient requirements of the sows (Noblet et al., 1990), especially for primiparous sows. Sows experiencing a negative energy balance can, to some extent, maintain their milk production by mobilising their body energy reserves (Noblet and Etienne, 1986), while milk production appears to be more sensitive to a protein or amino acid deficiency (Richert et al., 1997; NRC, 2012).
During gestation, nutrient requirements for sows largely differ among animals according to their body condition at mating, parity, expected reproductive performance, stage of pregnancy, physical activity, and the housing conditions (Dourmad et al., 2008). Nutrient requirements for sows are quite variable during gestation (NRC, 2012). At the end of gestation, requirements for energy (Noblet et al., 1987), amino acids (King and Brown, 1993; Dourmad and Etienne, 2005), and minerals (Jondreville and Dourmad, 2005) are much higher than in early gestation. Amino acid and mineral requirements, especially when expressed per kg feed, are higher in younger sows, which are still growing. These requirements also vary between individual sows (McPherson et al., 2004; Dourmad et al., 2008) according to their body weight and litter size. In practice, the feeding level of pregnant sows is to some extent adapted to account for this variation but, generally, the same diet is fed to all sows in a given herd resulting in that some sows will be underfed, especially young sows and sows in late gestation, whereas others will be overfed, especially older sows and sows in early gestation.
Insufficient nutrient supplies during lactation may reduce milk production and litter growth, and affect the subsequent reproductive performance (Trottier et al., 2015). During gestation, insufficient supplies, especially during late pregnancy, may also affect piglet birth weight, especially in hyper-prolific sows, although this is not clearly demonstrated, yet. Conversely, sows receiving more nutrients than required release large amounts of nitrogen and phosphorus in excreta, which results in increased environmental impacts and feed costs.
During lactation, sows are generally housed individually, which makes it easy to adjust the feeding level of each sow. However, changing the composition of the diet is more difficult to achieve, and the same lactation diet is fed to all sows. During gestation, pregnant sows are housed in groups for welfare issues, which makes it difficult to feed animals individually, especially when the sows are housed in small groups with a common feeding trough. Conversely, the group-housing of pregnant sows has favoured the development of innovative technologies allowing the individual distribution of feed using automated electronic feeders and animal identification. Nevertheless, in practice the same gestation diet is generally fed to all sows.
In recent years, the development of innovative feeders and the availability of technologies for high-throughput phenotyping of individual sows provide new opportunities to better adapt
Page 6/38
nutrient supplies to the performance potential and requirements. Precision feeding has been successfully evaluated for growing pigs (Cloutier et al., 2015).
In this context, the objective of this task was to develop prototypes of precision feeding systems, including the development of a decision support system (DSS) for gestating and lactating sows allowing the distribution of a tailored ration each day to each sow, to test this using different datasets available from an experimental farm, and to implement the prototypes in two experimental farms.
3. General description of the precision feeding systems
3.1 General approach
The originality of the approach developed is the combination of current knowledge about nutrient use of sows with data recorded on-farm (Figure 1). For lactation, these data include (i) farrowing events (i.e., date of farrowing, parity, body weight (BW), and backfat thickness (BT) of sows, number and weight of piglets at birth and after litter homogenization), (ii) events that occur during lactation (i.e., piglet cross-fostering and mortality, daily sow feed intake), and (iii) weaning events (i.e., date of weaning, litter size, and litter weight). For gestation, these data include (i) the description of herd profile and performance of sows, and the general strategy of management of sow body reserves, as described in InraPorc® (Dourmad et al., 2008), (ii)
information about each individual sow at mating, especially their age, parity, body weight, and backfat thickness, and their history of performance, and (iii) real time data collected either automatically by different sensors (e.g., body weight, physical activity, feeding activity) or the environment (e.g., ambient temperature and humidity).
Figure 1. Description of the general approach for the development of the precision feeding system for gestating and lactating sows.
3.2 Description of the Decision Support System (DSS)
The general description of the decision support system (DSS) and the associated data is illustrated in Figure 2. The objective of the DSS is to send a command to the automated feeder to proceed with feed distribution. This command informs the feeder about the amount of each of the different diets (differing in nutrient contents) to be fed to a given sow over a given day or period.
Page 7/38
Figure 2. General description of the decision support system for the development of the precision feeding system for sows.
To take that decision, the decision support system (DSS) uses information relative to the individual sow to be fed, the expected performance, housing conditions, and the general feeding strategy in the farm. This information is stored in a herd database. Different types of information are stored in this database: (i) the description of herd profile and performance, and the general strategy of management of sow body reserves as described in the InraPorc® model
(Dourmad et al., 2008), (ii) information about each individual sow at mating (for gestation) or at farrowing (for lactation), especially their age, parity, body weight, backfat thickness, and history of performance, and (iii) real time data collected either automatically by different sensors about the sows (e.g., body weight, physical activity, feeding or drinking activity) or the environment (ambient temperature), or manually by the farmer such as the number of suckling piglets.
From the available information, which may vary according to the equipment available on the farm and the data management system, the DSS makes the "best guess" decision to be transmitted to the automated feeder. This involves two steps: (i) the determination of the energy, amino acid, and mineral requirements and (ii) the determination of the amount and composition of the ration to be fed. This ration is prepared by mixing different (generally two) diets available in the automated feeder.
A mechanistic module adapted from InraPorc® model (Dourmad et al., 2008) is used on a daily
basis to calculate nutrient utilization and predict changes in sow body reserves. The module calculates daily maintenance costs and the requirement for the development of foetuses during gestation or the production of milk during lactation. With this approach, nutrient requirements vary among individual sows and according to the stage of pregnancy or lactation.
Page 8/38
3.3 Description of the models used for the determination of nutrient
requirement during gestation and lactation
The nutritional model used for the determination of energy, amino acid, and mineral requirements is adapted from the InraPorc® model (Dourmad et al, 2008). In this model, the
sow is represented as the sum of different compartments (i.e., body protein, body lipids, body energy, body minerals, and the uterus), which change during the reproductive cycle (Figure 3). The main nutrient flows are energy, amino acids, and minerals. In gestating sows, priority is given to the maintenance requirements, physical activity, thermoregulation, requirements for the foetuses, and the development of the uterus and the mammary gland. If the nutrient allowance exceeds these requirements, nutrients in excess contribute to the constitution of the sow’s body reserves. Conversely, body reserves can be mobilized when the nutrient demand is greater than the nutrient intake, especially in late gestation. In lactating sows, priority is given to maintenance and milk production, and body reserves often contribute to the supply for these priority functions. The different equations describing the utilization of nutrients and energy by gestating and lactating sows were derived from the literature and used to build a computerized simulator (Dourmad et al., 2008). This simulator determines on a daily basis the flow of nutrients and energy from the feed to storage in the body, excretion or dissipation.
Figure 3. Description of nutrient utilisation in the sow model (adapted from Dourmad et al., 2008).
A detailed description of the "requirement" model developed for lactation is given in annex 1, and has been published in the Journal of Animal Science (Gauthier et al., 2019). Similarly, a detailed description of the "requirement" model developed for gestation is given in annex 2, and has been published as a book chapter resulting from the ECPLF meeting (Dourmad et al., 2017) and as a peer-reviewed publication that has been submitted to Journal of Animal Science (Gaillard et al., 2019).
ME
idAA
maintenance activity uterus body protein body lipid milk backfat thickness body weightPage 9/38
4. Databases used for the evaluation of the precision
feeding systems
Lactation database
A database with data from three experimental farms was used to represent the variability in sow and litter performance, and to evaluate the DSS (Table 1). The two datasets contained the same information on sows: parity, body condition at farrowing (i.e., BW and BT), and daily sow feed intake during lactation. Litter size was recorded at birth, after homogenization within two days of lactation, and at weaning. All events that influence litter size during lactation (e.g., piglet cross-fostering or death) were recorded, as were dates of farrowing and weaning.
The first dataset (farm A) was provided by the "Centre de Développement du Porc du Québec" (Québec City, Canada) and contained data from 633 lactations, with an average parity of 3.9 (SD = 2.2) and an average BW of 241 (SD = 33.4) kg (Cloutier et al., unpublished data). The litter size averaged 11.6 (SD = 1.6) suckling piglets, with an average daily weight gain of 2,569 (SD = 343) g. The duration of lactation was 25.2 (SD = 2.7) days.
Table 1. Description of the two datasets used to estimate lactating sows' requirements.
No sows Mean SD 10th percentile 90th percentile Farm A Sow parity 633 3.9 2.2 1.0 7.0
Sow body weight, kg 633 241.2 33.4 193.8 284.6
Sow backfat, mm 633 18.4 4.2 12.9 24.0
Sow feed intake, kg/d 633 6.5 1.2 5.0 8.2
Lactation duration, d 633 25.2 2.7 22.0 27.0
Sucking litter size 633 11.6 1.6 9.5 13.3
Litter weight gain, kg/d 633 2.56 0.34 2.14 2.99
Farm B
Sow parity 817 1.9 0.8 1.0 3.0
Sow body weight, kg 817 218.3 24.7 186.5 250.5
Sow backfat, mm 817 14.5 4.0 9.2 20.3
Sow feed intake, kg/d 817 5.8 1.3 4.2 7.6
Lactation duration, d 817 18.6 2.6 15.0 22.0
Sucking litter size 817 11.9 1.2 10.3 13.3
Litter weight gain, kg/d 817 2.63 0.55 1.91 3.33
Farm C
Sow parity 1077 3.5 2.0 1.0 6.0
Sow body weight, kg 1077 276.5 33.8 231.8 319.8
Sow backfat, mm 1077 16.5 3.6 12.0 20.3
Sow feed intake, kg/d 1077 5.7 1.2 4.1 7.2
Lactation duration, d 1077 22.2 3.2 20.0 27.0
Sucking litter size 1077 12.4 1.5 10.2 14.2
Litter weight gain, kg/d 1077 2.63 0.60 1.54 3.36
The second dataset (farm B) was provided by Laval University (Québec City, Canada) and contained data from 817 lactations, with an average parity of 1.9 (SD = 0.8) and an average BW of 218 (SD = 24.7) kg (Lemay and Guay, 2017). Parity was relatively low, mainly because this farm was used for selection purposes. Litter size averaged 11.9 (SD = 1.2) suckling piglets
Page 10/38
per sow, with an average daily weight gain of 2,633 (SD = 554) g. Lactation was shorter, with an average duration of 18.6 (SD = 2.6) days. The third dataset (farm C), obtained from a commercial farm, contained data from 1077 lactations, with an average parity of 3.5 (SD = 2.0) and an average BW of 276 (SD = 33.8) kg. Litter size averaged 12.4 (SD = 1.5) suckling piglets per sow, with an average daily weight gain of 2,630 (SD = 600) g. Lactation was shorter, with an average duration of 22.2 (SD = 3.26) days.
In the three farms, sows were fed close to ad libitum using an automated feeder (Gestal, JYGA Technologies, Québec, Canada) that recorded daily feed intake and feeding behaviour.
Gestation database
A dataset of 2,511 gestations obtained from an experimental farm (Cloutier et al., 2017) providing sow characteristics at insemination and farrowing performance was used as input for the model to predict the individual dynamics of nutrient requirements during gestation and to evaluate the DSS. The database contained measurements of the body condition of the sows (BW and BT) at insemination and litter performance (Table 2). Average (± SD) litter size at farrowing was 14.1 (± 3.3) with an average BW of 1.48 kg per piglet (± 0.24), and a total litter weight of 20.5 (± 4.4) kg. The average BW of the sows at insemination increased from 163 to 251 kg between the first and eighth gestation, while BT at insemination tended to be higher for first and second parity sows and then remained constant (Table 4).
Table 2. Description of the database used to evaluate the nutrient requirements during gestation.
Insemination Target after farrowing Parity Number of sows Litter size Piglets BW, g Sow BW, kg Sow BT, mm Target BW, kg Target BT, mm 1 392 13.3 1,405 163 16.9 203 18 2 389 13.5 1,557 192 15.9 227 18 3 413 14.1 1,523 211 15.0 243 18 4 384 14.9 1,480 227 14.4 255 18 5 335 15.0 1,472 234 14.1 260 18 6 253 14.8 1,438 241 14.1 263 18 7 187 13.9 1,445 246 14.6 265 18 8 158 13.6 1,455 251 14.9 267 18 All 2511 14.1 1,478 214 15.2 244 18
5. Evaluation of the precision feeding system for lactation
5.1 Variability of nutrient requirement during lactation
Energy requirement
The variability between sows in the energy requirement and energy balance is presented in Figures 4 and 5. The mean daily energy requirement was strongly correlated with litter growth (Figure 4) with a R² of 0.95 (P < 0.001), but varied slightly according to sow BW, which influenced the maintenance energy cost. The ME requirement increased with week of lactation, from 74.0 MJ/d (wk1) to more than 100 MJ/d (wk2 and wk3+, respectively; P < 0.001). The ME requirement was higher for parity 2 and parity 3+ sows (96.6 and 96.7 MJ/d, respectively) than for first parity sows (89.2 MJ/d; P < 0.001). The mean energy balance (Figure 5) was negative
Page 11/38
for both farms and for all weeks and parities. The energy balance varied greatly among sows and was negative for sows consuming less than 7.51 kg/d (P < 0.001; Figure 5). It was also negative when litter growth exceeded 1,960 g/d (P < 0.001). The energy balance was lower on farm B and C than on farm A (-18.1 and -9.6 MJ ME/d, respectively). The largest deficit occurred in wk2 (18.0 MJ ME/d; P < 0.001). The energy deficit was larger for parity 1 sows than for parity 2 and parity 3+ sows (-21.7, -14.7, and 9.0 MJ ME/d, respectively; P < 0.001).
Figure 4. Mean daily metabolisable energy requirement for lactating sows as a function of litter growth (R² = 0.95; blue line). Each point represents the mean requirement of a lactating sow for the lactation period.
Figure 5. Mean metabolisable energy balance for lactating sows as a function of feed intake (R² = 0.52). Each point represents the mean balance of a lactating sow for the lactation period.
Lysine requirement
The variability between sows of the standardized ileal digestible (SID) lysine requirement is presented in Figure 6 according to litter growth. The daily SID lysine requirement is strongly correlated with milk protein output, with a R² of 0.99 (P < 0.001). The SID lysine requirement differed between farms A and B (43.1 and 43.6 g/d, respectively; P < 0.01). The mean SID requirement per kg of feed was strongly correlated with feed intake (R² = 0.51, P < 0.001), and correlated to a smaller extent with litter growth (R² = 0.27, P < 0.001; Figure 6). Week and parity had strong effects on the daily SID lysine requirement (P < 0.001).
Figure 6. Mean SID lysine requirement for lactating sows as a function of litter growth. Each point represents the mean requirement of a lactating sow over the whole lactation period.
Page 12/38
The SID lysine requirement increased with week of lactation, from 30.2 (wk1) to 49.3 (wk2), and 51.7 g/d (wk3+). It was lower for parity 1 sows (41.8 g/d) than for parity 2 and parity 3+ sows (44.8 and 43.7 g/d, respectively). The mean SID lysine requirement per kg of feed was lower on farm A than farm B (6.8 and 7.8 g/kg, respectively; P < 0.001).
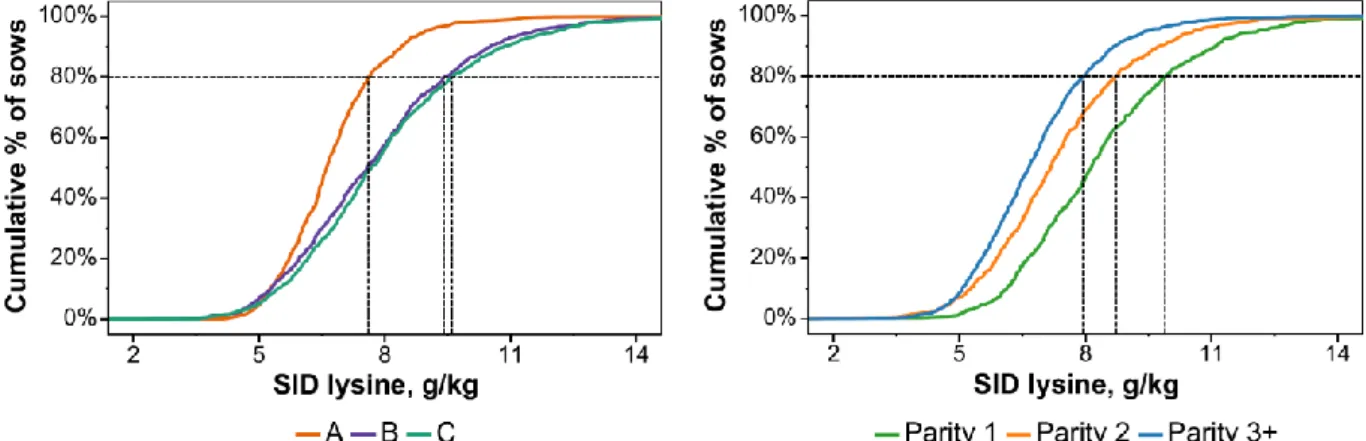
Figure 7. Cumulative distribution of the SID lysine requirement per kg of feed according to farm and parity. Vertical dashed lines represent the dietary concentration of SID lysine needed to meet the requirement for 80% of the sows on each farm.
The dietary SID lysine content needed to meet the requirement of 80% of the sows was 7.6 and 9.4 g/kg on farm A and B, respectively (Figure 7), which is 11.8% and 20.5% higher than the mean requirement, respectively. The mean requirement per kg of feed was lowest in wk1 (7.0 g/kg), highest in wk2 (7.9), and intermediate (7.5 g/kg) in wk3+. On average for the two farms, the SID lysine concentration needed to meet the requirement of 80% of the sows was 8.3, 9.4, and 8.8 g/kg in wk1, wk2, and wk3+, respectively. Parity also influenced the SID lysine requirement, with mean values of 8.3, 7.3, and 6.7 g/kg for parity 1, 2, and 3+ sows, respectively. The SID lysine concentration needed to meet the requirement of 80% of sows was 9.8, 8.6, and 7.6 g/kg for parity 1, 2, and 3+ sows, respectively (Figure 7).
5.2 Evaluation of a precision feeding strategy for lactation
The DSS was used to simulate the nutrient use by each individual sow and the simulated data were used for an in silico evaluation of the interest of precision feeding. A conventional 1-phase feeding strategy (CF) was compared to a precision feeding (PF) strategy consisting in mixing of two diets with either a low (L) or a high (H) nutrient content. The SID lysine content was set at 4.8, 10.54, and 8.5 g/kg feed and the protein content at 12.7, 18.0, and 16.4% in diets L, H, and CF, respectively.
On average, the level of incorporation of diet H in the PF strategy was 47% (Figure 8), the value being lower in farm A (36.8%) than in farms B and C (53.7 and 50.7% respectively). The difference between farms was mainly related to a higher feed intake in farm A. The average level or incorporation of diet H was only slightly affected by the stage of lactation (46.5, 51.3, and 43.4% in week 1, 2, and 3 respectively). This resulted in average reduction of SID lysine of 12.5% with a stronger effect in farm A (19, 8, and 10% reduction in farm A, B and C, respectively; Figure 9).
Page 13/38
Figure 8. Effect of week and farm on the average percentage of a high-nutrient diet fed during lactation in the precision feeding strategy.
Figure 9. Effect of week and farm on the reduction in SID lysine intake in a precision feeding strategy compared to a 1-phase feeding strategy.
With the 1-phase feeding strategy, the proportion of sows that were underfed in lysine reached 50% on average (Figure 10), the value was slightly lower for first parity sows (about 45%; Figure 11). Conversely, the proportion of underfed sow was higher in first parity sows compared to the average (Figures 10 and 11). With the precision feeding strategy, about 85% of sows were fed close their SID lysine requirement (i.e., ± 5% of the requirement; Figure 10, Table 3). However, there were still some underfed sows, especially in the first lactation (Figure 11).
Page 14/38
Figure 10. Effect of the feeding strategy (1-phase vs precision feeding) during lactation on the proportion of sows that received adequate, deficient, or excess lysine supplies.
Figure 11. Effect of the feeding strategy (1-phase vs precision feeding) during lactation on the proportion of primiparous sows that received adequate, deficient or in excess lysine supplies. The effect of the precision feeding strategy, compared to conventional feeding, on the average percentage of sows fed adequately, on nitrogen balance, and on feed cost is given in Table 3 for the three farms.
Table 3. Effect of precision feeding strategy on the percentage of sows fed adequately (± 5% of the requirement), nitrogen balance, and feed cost.
Farm A Farm B Farm C All Sows fed adequately (% of total)
Control 8.2 12.3 10.0 10.2 Precision feeding 89.3 79.4 80.9 83.2 Difference 81.1 67.1 70.9 73.0 N intake, g/d Control 172.7 150.8 154.2 157.4 Precision feeding 156.4 145.9 147.8 149.4 Difference (% of control) -9.4 -3.2 -4.2 -5.1 N excretion Control 108.3 88.1 92.2 94.5 Precision feeding 92.0 83.2 85.7 86.4 Difference (% of control) -15.0 -5.6 -7.0 -8.5 Feed cost ($/t) Control 268 268 268 268 Precision feeding 259 266 265 264 Difference (% of control) -3.2 -0.8 -1.2 -1.5
Page 15/38
With precision feeding, nitrogen/protein intake was reduced by 5.1%, the effect being more marked for farm A (-9.4%) than for farms B and C (-3.7%). The reduction in nitrogen excretion with precision feeding was greater than for the nitrogen intake (-8.5% on average). The effect was also more marked for farm A (-15%) than for farms B and C (-6.3% on average). With precision feeding, feed cost was reduced by 1.5%, the effect being more marked in farm A (-3.2%) compared to farms B and C (-1.0% on average). Differences between farms are mainly related to differences in feed intake, with a higher feed intake in farm A (6.5 kg/d) than in farms B and C (5.8 kg/d on average). With conventional feeding, this resulted in a higher percentage of sows fed at or above their lysine requirements in farm A (about 85%) compared to farms B and C (about 65%) suggesting that the control feed was not rich enough for farms B and C. This indicates that considering feed intake is important when defining the composition of diets L and H to be used in a precision feeding strategy. Moreover, this also indicates that the composition of diets L and H should not be least-cost optimized separately, but in a global optimisation process considering the whole farm lactation feeding cost. This deserves further research with the development of adequate optimization procedures that are not yet available.
6. Evaluation of the precision feeding system during
gestation
6.1 Variability of nutrient requirement during gestation
The variability in energy requirements between sows in relation with their body weight at insemination is given in Figure 12. Sow body weight at insemination explained 15% of the variability in ME requirement, with an average increase of 2.4 MJ ME for 10 kg increase in BW. The average ME requirement during gestation was also affected by BT at mating with an average increase of 1.0 MJ ME for each mm decrease in BT at mating, contributing to 67% of the variability. Litter size contributed to 10% of the variability of ME requirement, with an average increase of 2.9 MJ ME for each additional piglet at farrowing.
Figure 12. Average metabolisable energy requirement of sows as influenced by their body weight at insemination.
Page 16/38
The dynamics of SID lysine requirements, expressed in g/kg feed, according to gestation stage is presented in Figure 13. The average SID lysine requirement increases with gestation stage with important variability among sows, the highest value being 3-fold higher than the lowest. The requirement is also affected by parity, with higher values in primiparous sows than in multiparous sows.
Figure 13. Evolution of the SID lysine requirement (g/kg feed) of primiparous (mean), multiparous (mean) of all sows (mean ± 2 SD) sows, and minimum and maximum requirements according to gestation stage.
The SID lysine per kg feed required to cover the requirement of 90% of the sows is presented in Figure 14 according to the parity of sows (primiparous, multiparous) and period of pregnancy (P1 from 0 to 11 week of gestation, P2 from 12 to 17 week of gestation). This clearly indicates that the requirement is largely affected by parity and stage of pregnancy. The requirement is the highest (5.0 g/kg) for primiparous sows at the end of pregnancy and the lowest (2.85 g/kg) for multiparous sows in the first 2/3 of pregnancy, the other groups being intermediate.
Figure 14. Cumulative distribution of the SID lysine requirement per kg feed according to parity of sows (primiparous, multiparous) and period of pregnancy (P1 from 0 to 11 week of gestation, P2 from 12 to 17 week of gestation). Vertical dashed lines represent the dietary concentration of SID lysine needed to meet the requirement for 90% of the sows in each group.
Page 17/38
6.2 Evaluation of a precision feeding strategy for gestation
An individualized target of BW after farrowing was determined for each sow regarding age and BW at insemination. This target of BW was determined from a generalized Weibull function calibrated according to specific farm data.
BW after farrowing = 275 x (1-exp((-3.824/1000) x (Age at Farrowing) 0.9801))
The objective of BT after farrowing was fixed for all the sows at 18 mm in accordance with the practices of the farm from where the data were collected.
The DSS was then used to calculate the average ME and feed requirements during gestation (Table 4) according to sow BW and BT at insemination and the targets after farrowing. Average ME requirement varied according to parity from 31.0 to 36.8 MJ /d, and was highly variable among sows with a coefficient of variation of about 7%.
Table 4. Calculated ME (MJ/d) and SID lysine requirement (g/kg feed) and supplies per parity, and percentage of a low nutrient density diet (L) and percentage reduction of lysine in precision feeding (PF) compared to conventional feeding (CF) strategy.
Av. lysine req Lysine supply in PF strategy1
Parity ME MJ/d Feed. kg/d 30 d 114 d Average g/kg feed L feed Reduction PF vs CF,% 1 31.0 2.4 3.63 6.23 4.01 67 17% 2 34.0 2.6 3.20 5.80 3.62 78 24% 3 35.5 2.7 2.91 5.41 3.32 85 28% 4 36.4 2.8 2.68 5.14 3.09 89 30% 5 36.8 2.8 2.59 5.09 3.02 89 31% 6 36.6 2.8 2.52 4.92 2.91 91 32% 7 35.9 2.7 2.48 4.79 2.83 92 33% 8 35.7 2.7 2.44 4.72 2.77 93 33% all 35.0 2.7 2.89 5.38 3.28 84 27%
1in CF feeding strategy lysine content was constant and equal to 4.8 g/kg feed.
The model was then used to simulate the nutrient use for each individual sow and the simulated data were used for an in silico evaluation of the interest of precision feeding. A conventional 1-phase feeding strategy (CF) was compared to a precision feeding (PF) strategy consisting in mixing two diets with either a low (L) or a high (H) nutrient content. The SID lysine content was set at 4.8, 3.0, and 6,0 g/kg feed and the protein content to 14, 9, and 16% in diets CF, L, and H, respectively.
On average, the level of incorporation of diet L in the PF strategy was 84%, the value being lower in first parity sows (67%). The level or incorporation of diet L decreased with gestation stage from almost 100% in the first week to less than 30% in the last week (Figure 15).
Page 18/38
Figure 15. Average level of incorporation of L and H feed in the ration of sows according to gestation stage and parity.
Compared to the 1-phase strategy, PF strategy resulted in a 27% decrease in the total SID lysine supply and a 24% decrease in total crude protein supply. Moreover, the proportion of sows that were underfed in the last two weeks of lactation decreased from more than 60% with CF to less than 5% with PF. For first parity sows, the difference was even more marked with almost all primiparous sows receiving deficient diets over the last 10 days of pregnancy with CF, compared to about 10% with PF (Figure 16). Conversely the proportion of sows that were overfed was drastically reduced (Figure 16).
Figure 16. Effect of the feeding strategy (1-phase vs precision feeding) during gestation on the proportion of sows (among all sows or among first-parity sows) that received adequate, deficient, or excessive lysine supplies.
Page 19/38
The effect of precision feeding strategy, compared to conventional feeding, on N balance and feeding cost is presented in Table 5, according to parity. With precision feeding, nitrogen/ intake was reduced by 23.9% on average, the difference between the two feeding strategies increasing with parity. The reduction in N excretion with precision feeding was greater than for N intake (-29.8% on average) and the difference increasing also with parity. With precision feeding the feed cost was reduced by 4.6% on average, the effect being more marked older sows.
Table 5. Effect of precision feeding strategy on N balance, N excretion, and feed cost.
Parity 1 Parity 2 Parity 3 All N intake, g/d Control 50.7 55.6 59.1 57.2 Precision feeding 40.4 42.6 43.7 43.9 Difference (% of control) -20.4 -23.3 -26.2 -23.9 N excretion Control 36.7 41.8 47.4 44.8 Precision feeding 26.3 28.8 31.9 31.5 Difference (% of control) -28.2 -31.0 -32.6 -29.8 Feed cost ($/t) Control 246 246 246 246 Precision feeding 236 234 232 234 Difference (% of control) -3.8 -4.6 -5.5 -4.6
7. General description of the pre-industrial precision
feeder system prototypes for sows
Different automatic feeders are already available on the market for gestating and lactating sows. With this kind of technology, it is possible to adapt the amount of feed delivered to each sow. For example, the quantity of a standard gestation diet can be adjusted on an individual basis to the energy requirement of the sow assessed at the beginning of the gestation. But other developments are required to implement precision feeding in terms of adjusted quality of the diet and the dynamic consideration of daily requirements. Dealing with changes in the quality of the diet delivered on an individual basis requires to mix two or more diets with the device. Dealing with dynamic change in requirements implies that some characteristics of the sows should be measured (or simulated) at different time points and that the model used to assess requirements account for age, stage of gestation or of lactation, feed-intake, body weight, backfat thickness, activity level, and litter development. Tools exist for body weight measurements or activity, but not for automatic measurement of backfat or in utero litter weight.
Three different prototypes were developed based on the adaptation of industrial equipment, one at IFIP for gestation and two at INRA for gestation and lactation.
7.1 Feeding system for gestating sows (device developed at IFIP)
The specifications presented below have been co-designed by IFIP and produced by the French equipment manufacturer ASSERVA. In this part, we describe the characteristics of the prototype and tools currently used in the experimental farm of IFIP.Page 20/38
The experimental room
The room (226 m²) is organized for up to 72 sows, housed on slatted floor in a dynamic group (three batches of 24 sows) in five areas: a living area, a sorting pen, a boar pen, and two feeding-weighing areas (Figure 17). All devices are connected to a computer that centralizes the recorded events, and from which the daily and individual feeding plans is downloaded to the feeding stations.
Figure 17. Design of the room designed for precision feeding of gestating sows.
The living area
In agreement with EU directive 2008/120/CE, the living area is enriched for welfare consideration with a few chains hanging at different places in the room. In addition, the living area is partitioned with concrete walls to create niches where the sows can lie down quietly. Water is provided ad libitum through six connected drinkers, but water intake is not currently measured in the tests carried out.
Sows are equipped with an RFID ear tag. At about 25 days of gestation, the batch of sows is introduced in the room. A few days before, some niches are blocked with a fence so that the resident sows got used not to occupy them. These niches are then available for the new sows when they enter the group. They stay in the room up to the 108th day of gestation, and then
Page 21/38
Photo 1. General view of the room (Photo IFIP).The feeding stations
Based on literature information and the experience of equipment manufacturers, one feeder should be used by no more than 40 sows. Consequently, two automatic feeders were required for 72 sows, to ensure enough access time for daily feed intake for all sows.
Doors are open when the feeding station is empty (Figure 18). When a sow enters the feeder, infra-red cells detect the animal and the gates are closed automatically. The RFID ear tag is detected and identified by an antenna, and if doors are closed and the sow has not consumed already her daily feed allowance, doses of feed are delivered. If a second sow enters immediately after the first one, the doors remain open and no diet is delivered. To avoid having a sow staying too long in the feeding station, the doors are opened 5 minutes after the last delivery to let a new sow enter and chase out the first sow. The countdown of the 5-minute timer restarts with each new dose of feed, so that the sow has 5 minutes to eat a dose of feed. The dose can vary from 50 to 300 g. The time before activating the door opening can be changed as well as the volume of the dose delivered, but 200 g/dose with a countdown of 5 minutes seems to be an efficient compromise.
Page 22/38
Figure 18. Design of the feeding station.The main characteristics of the feeding station are:
- Designed to hold a sow from 150 to 400 kg
- Doors ensure isolation of the sow, avoiding other sows to com and steal the feed delivered - Precision of diet distribution ± 1 g
- 4 hoppers giving the possibility to mix different feeds before delivery, with proportions changing automatically or manually every day for each sow
- Minimum / maximum quantity delivered per dose: 50 to 300 g, with the possibility to deliver larger doses at the beginning of the feeding visit, and reduced amounts when the feed intake gets close to the individual daily maximum feed allowance
- Minimum quantity delivered in a dose for a given feed: 50 g (i.e. 100% of a single diet if minimum quantity delivered per dose is fixed to 50 g)
- Addition of water with the feed in the trough, adjustable by the user (to allow the detection of feed in the trough by sensors)
Four feeds can be dispensed from four hoppers equipped with endless motorized screws (Photo 2). The four feeds can be blended as a dose of 300 g for example. In this situation, the first endless screw rotates to deliver the expected amount of feed A requested in the dose, then the second screw delivers the expected amount of diet B, and so on.
Page 23/38
Photo 2. Motorized micro screws.When the screw is stopped, the quantity of feed A dropped is weighed in a bowl placed under the screw (Photo 3). Then the second endless screw begins to deliver feed B. The amount of feed B delivered is calculated by difference between the total weight (of feeds A and B) in the bowl and the amount of feed A. This procedure is repeated for feeds C and D. If the quantity of each feed delivered differs from the anticipated quantities, the actual quantities are taken into account to determine what remains to be distributed for the day.
Page 24/38
Recorded events:- Weighing the feed at each dose by weighing bowl, with an accuracy of 1 g
- Detection of feed in the trough at the arrival of a new sow in the station (in case feed is left by a previous pig)
- Detection of feed in the trough left by the sow leaving the feeder - Each passage of the animal through the weighing or feeding station - Time of each passage with an accuracy of 1 minute
- Time of presence in the feeding station
- Amount of each feed consumed per passage in the feeding station
Detail of feed management sub-system for four different feeds:
- Able to communicate in real time with the controlling module component through implementation of the high-level agent communication language (ACL) developed in the project (Deliverable 4.2). This capacity is implemented through an interface module
- Manage data communication: inputs and outputs from sensors and actuators - Real-time monitoring of the feeder
- Real-time monitoring for activity sensors - Event notification
- Management of feed formulas
The prototype for sows is fully functional. Present activities are dedicated to the development of the software that will be installed in the DSS with the controlling module to assess nutrient requirement in a dynamic way.
The weighing scale
The sow is identified in the feeding station. When she leaves the station, she enters a corridor that consists of a non-contention weighing scale (Photo 4). The device hangs on two force sensors. Two laser sensors are located at both extremities of the scale. The first one detects the arrival of the animal and the device starts to record the weight at a rate of 0.1 measurements/second. A second laser detects when the sow goes out the scale. An algorithm, developed by ASSERVA, analyses the data collected and sends the resulting BW to the DSS with a 100 g accuracy.
Each time the sow is weighed by the device, the time of the event is recorded as well as the BW, except if the animal moves too much and the load cells do not stabilize. This data can be used in a dynamic way to assess the daily maintenance requirement.
Page 25/38
Photo 4. The weighing station.Other equipment
Accelerometers: An accelerometer can be fixed to an ear tag to detect the time spent in three
postures by the sow (i.e., standing, lying, and walking). Data are sent each day to the DSS and based on BW measured on the same day, the corresponding energy requirement can be calculated and used to modulate the feed allowance on the following day.
Echograph: Every two weeks, the backfat thickness is measured manually with an echograph.
At the beginning of gestation, this information (compared to a target value at farrowing) can be used to evaluate the expected backfat gain during gestation.
Boar detection: An antenna located close to the boar pen detects and identifies the RFID ear
tag of the sow that is returned into oestrus. The number of contacts with the boar are recorded automatically.
7.2 Feeding systems for gestating and lactating sows (devices
developed at INRA)
The specifications presented below have been designed by INRA (Pig experimental unit of Rennes) using the "Gestal" feeding systems for sows produced by JYGA Company from Canada-Quebec, and provided by RV BIOTEC, a company distributing the "Gestal" feeding systems in France. This feeding system was designed to allow mixing two feeds on an individual sow basis during gestation and lactation.
General description
The entire sow experimental unit (126 productive sows) was equipped with the new precision feeding devices allowing the individual distribution of a mixture of two feeds on a daily basis. Six gestation rooms (for about 20 sows in each) and four lactation rooms (two with six farrowing crates and two with 12 farrowing crates).
Page 26/38
Figure 13. General description of the different rooms with the four feeding lines: two for gestation (dark green and red) and two for lactation (light green and blue).
Precision feeding system for gestating sows
Based on experience of the equipment manufacturer, this type of feeder should be used by no more than 15-20 sows. Consequently, two feeding stations were implemented in each room (62 m2) (photo 5) since the number of sows per batch is 20-22 in the farm. The sows are raised
on a concrete floor with straw bedding with a manure area that is cleaned every two days.
Photo 5. General design of a gestation room with two feeding stalls for 18-22 sows on straw bedding.
Doors are open when the feeding station is empty (Photo 6). When a sow enters the feeder, she pushes and raises a barrier that closes the door behind her mechanically. The RFID ear tag is detected and identified by an antenna, and when the sow has not consumed her daily feed allowance, a dose of feed is delivered when the sows asks for it. The dose can be adapted and varies from 50 to 400 g. With the present design, two feeds can be dispensed from two hoppers equipped with endless motorized screws (Photo 2). However, the DSS is planned for four feeds.
Page 27/38
Photo 6. Feeding stalls for gestating sows. The feeding stall operates mechanically. The sow enters the feeding stall and the door behind her is closed.
Communication between the feeder and the computer is performed using a Wi-Fi connection every 15 mn. The feeder is able to process independently the whole procedure of sow identification, feed distribution, and storage of data, even if the connexion with the computer is not operational. The feeder is equipped with a control panel that allows the farmer to modify the feeding program in the room. This can also be performed on the computer. When the connexion is available between the computer the feeder, data are exchanged in two ways for harmonization of feeding programs and data collection. The feeders have the capacity to work alone for about two days, even if the communication is disrupted.
The distribution of feed by the feeder is performed on a volumetric basis with an endless screw. An automated procedure is available for the calibration of feed density which is performed each week.
Sows are moved to the gestation pens one week after insemination. A provisional feeding program is calculated by the DSS at that time according to age, stage of gestation, body weight, and backfat thickness of each sow. This feeding program is then transferred to the controller of the feeding system. It defines the amount of feed to be distributed each day and the percentage of each of the two feeds. The feeding program can be modified during gestation according to the new information available during gestation.
Precision feeding system for lactating sows
The prototype precision feeding system for lactating sows was adapted to conventional lactation crates. The feeding system consists of two feeders connected to two different feeding lines. The controller system was implemented in the "master" feeder and supervises the two feeders (master/slave). The distribution of feed by the feeder is performed on a volumetric basis with an endless screw. An automated procedure is available for the calibration of feed density, which is performed each week.
Page 28/38
As for the gestation feeding systems, communication between the feeder and the computer is performed using a Wi-Fi connection every 15 mn. The feeder is able to process independently the whole procedure of feed distribution and storage of data, even if the connexion with the computer is not operational. The feeder is equipped with a control panel that allows the farmer to modify the feeding program. This can also be performed on the computer. When the connexion is available between the mainframe and the feeder, data are exchanged in two ways for harmonization using the last data entered. The feeders have the capacity to work alone including data storage for about three days even if the communication is disrupted or the computer is not operational.
The distribution of feed by the feeder is performed on a volumetric basis with an endless screw. An automated procedure is available for the calibration of feed density, which is performed each week.
Sows are moved to the farrowing pen about one week before farrowing. A provisional feeding program is calculated by the DSS at that time according for the end of pregnancy. The lactation feeding program starts when the sow has farrowed. The lactation feeding program is calculated each day by the DSS according to number of days in milk, parity of sows, number of suckling piglets, and sow feed intake in the previous days, this data being provided by the feeder. This feeding program is then transferred to the controller of the feeding system. It defines the maximal amount of feed allowed on the next day and the percentage of each of the two feeds. The feeding program is automatically modified each day by the DSS.
Photo 5. General view of one lactation room with two feed dispensers per pen.
8. Conclusion
The aim of this deliverable is to describe a prototype of precision feeding systems for gestating and lactating sows. Two decision support systems (DSS) were developed on the basis of nutritional models for gestation and lactation sows. These DSS allow determining the daily energy, amino acid and mineral requirements of individual sows according to the available information, which may vary from farm to farm. The nutritional models developed for these calculations were adapted from the InraPorc® model with some improvements based on recent
Page 29/38
These DSS were validated in silico using a large number of real farm data. For both gestation and lactation, the conventional 1-phase feeding strategy (CF) was compared to a precision feeding (PF) strategy consisting of the mixing of two diets with either a low (L) or a high (H) nutrient content. Promising results were obtained. With precision feeding during gestation, protein intake was reduced by 24% on average, compared to conventional feeding and N excretion was reduced by almost 30%, whereas the feed cost decreased by 4.6%. Moreover, the proportion of sows that were underfed during the last two weeks of gestation was drastically reduced with precision feeding, whereas in the beginning of gestation, the proportion of overfed sows was reduced. With precision feeding during lactation, on average protein intake was reduced by 5.1%, N excretion by 8.5%, and feed cost by 1.5%. All these effects depended on the farm.
Three different prototypes of precision feeding systems have been implemented on the basis of the adaptation of industrial equipment, one at IFIP for gestation and two at INRA for gestation and lactation, and they are now available for demonstration purposes.
Page 30/38
9. References
Bikker, P., and M. C. Blok. (2017). Phosphorus and calcium requirements of growing pigs and sows. Wageningen Livestock Research (CVB documentation report 59).
https://doi.org/10.18174/424780.
Cloutier, L., C. Pomar, M. P. Létourneau Montminy, J.F. Bernier, and J. Pomar (2015). Evaluation of a method estimating real-time individual lysine requirements in two lines of growing-finishing pigs. Animal 9: 561-568. https://doi.org/10.1017/S1751731114003073. Dourmad, J.-Y., M. Etienne, J. Noblet, and D. Causeur (1997). Prédiction de la composition
chimique des truies reproductrices à partir du poids vif et de l'épaisseur de lard dorsal: application à la définition des besoins énergétiques. Journées Rech. Porcine 29: 255-262. Dourmad, J.-Y. and M. Etienne (1998). Etude des besoins en lysine et en thréonine de la truie
en gestation. Journées Rech. Porcine 30: 201-207.
Dourmad, J.Y., J. Noblet, and M. Etienne (1998). Effect of protein and lysine supply on performance, nitrogen balance, and body composition changes of sows during lactation. J. Anim. Sci. 76: 542-550. https://doi.org/10.2527/1998.762542x.
Dourmad, J.Y., M. Etienne, A. Valancogne, S. Dubois, J. van Milgen, and J. Noblet (2008). InraPorc: a model and decision support tool for the nutrition of sows. Anim. Feed. Sci. Tech. 143: 372-386. https://doi.org/10.1016/j.anifeedsci.2007.05.019.
Dourmad J.Y., Brossard L., Pomar C., Pomar J., Gagnon P., and Cloutier L. (2017). Development of a decision support tool for precision feeding of pregnant sows. In: Precision Livestock Farming ’17. pp. 584-592. Presented at 8th European Conference on Precision
Livestock Farming (ECPLF), Nantes, FRA.
Feyera, T., and P. K. Theil (2017). Energy and lysine requirements and balances of sows during transition and lactation: A factorial approach. Livest. Sci. 201: 50-57.
https://doi.org/10.1016/j.livsci.2017.05.001.
Gaillard C., Gauthier R., Cloutier L., and Dourmad J.Y. (2019). Exploration of individual variability to better predict the nutrient requirements of gestating sows. Submitted to J. Anim. Sci.
Gauthier R., C. Largouët, C. Gaillard, L. Cloutier., F. Guay, and J.Y. Dourmad (2019). Dynamic modeling of nutrient use and individual requirements of lactating sows. J. Anim. Sci. 97: 2822-2836. https://doi.org/10.1093/jas/skz167.
Graves, W.E., J.W. Lauderdale, R.L. Kirkpatrick, N.L., and L.E. Casida (1967). Tissue changes in the involuting uterus of the postpartum sow. J. Anim. Sci. 26: 365-371.
https://doi.org/10.2527/jas1967.262365x.
Guéguen, L., and J.M. Perez (1981). A re-evaluation of recommended dietary allowances of calcium and phosphorus for pigs. Proc. Nutr. Soc. 40: 273-278. doi:10.1079/PNS19810043. Hansen, A. V., A. B. Strathe, E. Kebreab, J. France, and P.K. Theil (2012). Predicting milk yield and composition in lactating sows: A Bayesian approach. J. Anim. Sci. 90: 2285-2298.
https://doi.org/10.2527/jas.2011-4788.
Jondreville, C. and J.Y. Dourmad (2005). Le phosphore dans la nutrition des porcs. INRA Prod. Anim. 18: 183-192.
Jongbloed, A.W., H. Everts, P.A. Kemme, and Z. Mroz (1999). Quantification of absorbability and requirements of macroelements. In: I. Kyriazakis, ed. A quantitative biology of the pig. CABI Publishing, Wallingford, UK. p. 275-298.
King, R.H. and WG. Brown (1993). Interrelationships between dietary protein level, energy intake, and nitrogen retention in pregnant gilts. J. Anim. Sci. 71: 2450–2456.
Page 31/38
Lemay, A., and F. Guay (2017). Étude des facteurs agissant sur la consommation d’aliment de la truie allaitante. Journées Rech. Porcine 49: 57-62.
McPherson, R.L., F. Ji, G. Wu, J.R. Blanton, Jr., and S.W. Kim (2004). Growth and compositional changes of fetal tissues in pigs. J. Anim. Sci. 82: 2534-2540.
https://doi.org/10.2527/2004.8292534x.
Moughan, P. (1999). Protein metabolism in the growing pig. In: I. Kyriazakis, ed. A quantitative biology of the pig. CABI Publishing, Wallingford, UK. p. 299–332.
Noblet, J. and M. Etienne (1986). Effect of energy level in lactating sows on yield and composition of milk and nutrient balance of piglets. J. Anim. Sci. 63: 1888-1896.
https://doi.org/10.2527/jas1986.6361888x.
Noblet, J. and M. Etienne (1987). Metabolic utilization of energy and maintenance requirements in pregnant sows. Livest. Prod. Sci. 16:243-257. https://doi.org/10.1016/0301-6226(87)90042-X.
Noblet, J. 1990. Bases d’estimation du besoin énergétique de la truie au cours du cycle de reproduction. PhD. thesis. University Pierre et Marie Curie Paris VI, Paris, France.
Noblet, J., J.Y. Dourmad, and M. Etienne (1990). Energy utilization in pregnant and lactating sows: modeling of energy requirements. J. Anim. Sci. 68: 562-572.
https://doi.org/10.2527/1990.682562x.
NRC (2012). Nutrient requirements of swine. 11th rev. ed. Natl. Acad. Press, Washington, DC.
https://doi.org/10.17226/13298.
Palmer, W.M., H.S. Teague, and W.G. Venzke (1965). Macroscopic observations on the reproductive tract of the sow during lactation and early weaning. J. Anim. Sci. 24: 541-545.
https://doi.org/10.2527/jas1965.242541x.
Pomar, C., D.L. Harris, and F. Minvielle (1991). Computer simulation model of swine production systems: 1. Modelling the growth of young pigs. J. Anim. Sci. 69:1468-1488.
https://doi.org/10.2527/1991.6941468x.
Pomar, C., D.L. Harris, and F. Minvielle (1991). Computer simulation model of swine production systems: 2. Modeling body composition and weight of female pigs, fetal development, milk production, and growth of suckling pigs. J. Anim. Sci. 69: 1489-1502.
https://doi.org/10.2527/1991.6941489x.
Richert, B.T., M.D. Tokach, R.D. Goodband, J.L. Nelssen, R.G. Campbell, and S.S. Kershaw (1997). The effect of dietary lysine and valine fed during lactation on sow and litter performance. J. Anim. Sci. 75: 1853-1860. https://doi.org/10.2527/1997.7571853x.
Sauvant, D., J.M. Perez, and G. Tran (2004). Tables of composition and nutritional value of feed materials. Pigs, poultry, cattle, sheep, goats, rabbits, horses and fish. Wageningen Academic Publishers, The Netherlands. https://doi.org/10.3920/978-90-8686-668-7. Strathe, A.V., A.B. Strathe, P.K. Theil, C.F. Hansen, and E. Kebreab (2015). Determination of
protein and amino acid requirements of lactating sows using a population-based factorial approach. Animal 9: 1319-1328. https://doi.org/10.1017/S1751731115000488.
Trottier, N.L., L.J. Johnston, and C.F.M. de Lange (2015). Applied amino acid and energy feeding of sows. In: C. Farmer, ed. The gestating and lactating sow. Wageningen Academic Publishers, Wageningen, The Netherlands. p. 117-146. https://doi.org/10.3920/978-90-8686-803-2_6.
van Milgen, J., A. Valancogne, S. Dubois, J. Y. Dourmad, B. Sève, and J. Noblet (2008). InraPorc: A model and decision support tool for the nutrition of growing pigs. Anim. Feed. Sci. Tech. 143: 387-405. https://doi.org/10.1016/j.anifeedsci.2007.05.020.
Wood, P.D.P. (1967). Algebraic model of the lactation curve in cattle. Nature 216: 164-165.
Page 32/38
Annex 1 – Detailed description of the nutritional model used
for lactating sows
Nutrient Use. Energy and amino acids are partitioned between maintenance costs and milk
production costs. As described by Feyera and Theil (2017), the energy and amino acids that sows release during postpartum uterine involution also contribute to milk synthesis (Table A1, Eq. 1 and 6). Body reserves may also provide large amounts of lipids and protein in response to nutritional deficiencies. From Eq. 1 and 6, requirements were estimated without considering maternal energy supplies (ERm) or amino acids (AARm), except those from the involuting
uterus.
Milk Production. In relation to the factorial approach, nutrient requirements of lactating sows
are usually estimated from the quantity of milk components produced (Noblet and Etienne, 1989; NRC, 2012). Determining the lactation curve is therefore essential to describe the amounts of nutrients required each day to produce milk. Wood’s non-linear model (Wood, 1967), firstly developed for dairy cows, has been applied to other species including small ruminants, horses, and sows. The present model used the lactation curve of Hansen et al. (2012) who used meta-analysis to re-parameterize the Wood lactation curve as the natural logarithm of milk production at days 5, 20, and 30 (Eq. 18). The daily change in milk production is represented for each sow with a factor (α (t)) that integrates the effects of litter size and litter growth (Eq. 19).
Metabolizable Energy Requirement. During lactation, the energy requirement for
maintenance was estimated as 460 kJ ME/kg BW0.75/d(Noblet et al., 1990) (Eq. 2) and was
assumed to be unaffected by thermoregulation and activity. According to Noblet and Etienne (1987), the efficiency of metabolizable energy (ME) for milk production (kmilk) of 72%, and that
of energy mobilized from body reserves (krm) of 88%. Energy in milk was calculated for each
sow based on litter average daily gain and litter size (Noblet and Etienne, 1989; NRC, 2012) (Eq. 3). This equation was combined with the daily milk production factor (α(t)) to estimate the daily amount of energy exported in milk. In the present model, energy provided during postpartum uterine involution contributes to the total energy supply with the same efficiency as that from body reserves (krm). Energy content in the uterine wall at 115 days of gestation was
estimated as a function of the number of foetuses (Eq. 4) (Noblet, 1990). The half-life of postpartum uterine involution was 6.2 days (Eq. 17), based on Graves et al. (1967) and Palmer et al. (1965). Daily energy release from the uterus was then calculated according to uterine energy content at parturition and its exponential rate of involution (Eq. 5).
Standardized Ileal Digestible Amino Acid Requirements. Maintenance and milk production
costs were calculated for all essential amino acids considering the contribution of uterine release (Table A1; Eq. 6). The maintenance requirement was estimated as the sum of desquamation, minimum protein turnover, and basal endogenous intestinal losses (NRC, 2012; Eq. 7). Integument losses (skin and hair) were estimated for each amino acid according to sow metabolic weight (AAd; Moughan, 1999). The requirement for minimum protein turnover
(AAturn), also expressed per kg of metabolic weight (Table 2), reflects the minimum amino acid
catabolism (NRC, 2012). Basal endogenous losses (AAe) are composed of protein secreted in
the intestinal tract and not reabsorbed by the sow. They depend on feed dry matter intake (Eq. 7; Sauvant et al., 2004). The requirement for milk production was estimated for each amino acid, on a daily basis, from the amount of protein exported in the milk (Eq. 8), the amino acid