HAL Id: cea-02434526
https://hal-cea.archives-ouvertes.fr/cea-02434526
Submitted on 10 Jan 2020
HAL is a multi-disciplinary open access
archive for the deposit and dissemination of
sci-entific research documents, whether they are
pub-lished or not. The documents may come from
teaching and research institutions in France or
abroad, or from public or private research centers.
L’archive ouverte pluridisciplinaire HAL, est
destinée au dépôt et à la diffusion de documents
scientifiques de niveau recherche, publiés ou non,
émanant des établissements d’enseignement et de
recherche français ou étrangers, des laboratoires
publics ou privés.
Calculation Benchmark for JHR Core Configurations
A. Chambon, P. Vinai, C. Demaziere, L. Gaubert, J. Politello, F. Jeury
To cite this version:
A. Chambon, P. Vinai, C. Demaziere, L. Gaubert, J. Politello, et al.. A Deterministic against
Monte-Carlo Depletion Calculation Benchmark for JHR Core Configurations. M&C - 2017 International
Conference on Mathematics and Computational Methods Applied to Nuclear Science and Engineering,
Apr 2017, Jeju, South Korea. �cea-02434526�
A Deterministic against Monte-Carlo Depletion Calculation Benchmark for JHR Core Configurations
A. Chambon, P. Vinai, C. Demazière
Chalmers University of Technology, Department of Physics, SE-412 96 Gothenburg, Sweden [email protected]
[email protected] [email protected]
L. Gaubert, J. Politello, F. Jeury
CEA, DEN, DER, SPRC, Cadarache research center, F-13108 Saint-Paul-lez-Durance, France [email protected]
Abstract - The Jules Horowitz Reactor (JHR) is the next international Material-Testing Reactor (MTR)
under construction in the south of France at CEA Cadarache research center. Its first criticality is foreseen by the end of the decade. The innovative character of the JHR led to the development of a specific neutronic calculation scheme called HORUS3D/N for performing design and safety studies. HORUS3D/N is based on the deterministic codes APOLLO2 and CRONOS2 and on the European nuclear data library JEFF-3.1.1. Up to now, the biases and uncertainties due to the HORUS3D/N calculation scheme in depletion have been assessed by comparing HORUS3D/N deterministic calculations with 2D APOLLO2-MOC reference route calculations. The recent development of the Monte-Carlo code TRIPOLI-4® in its depletion mode (TRIPOLI-4®D) offers the opportunity to study the JHR 3D core configurations under fuel depletion conditions. This paper presents the first CRONOS2/TRIPOLI-4®D benchmark results obtained for 3 core configurations of interest including control rods and experimental devices up to a burnup value of 60 GWd/tHM. The main parameters of interest are the reactivity and the isotopic concentrations as functions of
burnup. This first study of actual JHR configurations in depletion demonstrates that CRONOS2 underestimates the reactivity for burnups lower than 8 GWd/tHM and overestimates it for higher burnups,
with respect to the TRIPOLI-4®D predictions. A good agreement between the two codes is observed concerning the 235U consumption with discrepancies values less than -0.5% at 60 GWd/tHM. Nevertheless, a
global CRONOS2 overestimation of the plutonium inventory can be noticed. Compared with 3D assembly calculation in an infinite lattice, this overestimation was tracked down to the condensation of the nuclear constants provided by APOLLO2, showing the limits of a two steps calculation.
I. INTRODUCTION
The JHR is a new Material Testing Reactor (MTR) under construction at CEA Cadarache research center in southern France aimed to replace the French MTR OSIRIS by the end of the decade [1]. It will support the operation of the existing fleet of power reactors, qualify technologies for future systems and produce short-lived radioisotopes for medical imaging or therapeutic purposes. In the context of life-time extensions and the progressive deployment of Generation III reactors, the JHR will be a major tool for research and industry-driven investigations. In order to perform JHR design and safety studies, a specific neutronic calculation tool, HORUS3D/N (Horowitz Reactor simulation Unified System), based on the APOLLO2 and CRONOS2 deterministic codes and on the European nuclear data library JEFF3.1.1, was developed to predict neutronic parameters of the JHR (reactivity, power distribution, control rod reactivity worth, etc) [2] [3] [4] [5].
Up to now, the HORUS3D/N validation process in depletion only relied on 2D APOLLO2-MOC deterministic
transport calculations [2]. The recent development of the new CEA’s Monte-Carlo Burnup code, TRIPOLI-4®D, and its adaptation for the JHR offers the first opportunity to study 3D configurations in depletion [6]. A first benchmark was set up in order to compare APOLLO2 and CRONOS2 with TRIPOLI-4®D for the case of assemblies in an infinite lattice in 2D [7]. The actual work is a further step, where the complexity of 3D core configurations of the JHR is considered, and it represents the first effort of its kind.
In this paper, three different 3D core configurations of interest to the JHR were selected for benchmark calculations. After a presentation of the JHR, the paper will describe the TRIPOLI-4®D Monte-Carlo Burnup code and the benchmark hypotheses. Then, the results of the CRONOS2/TRIPOLI-4®D comparison obtained for the three core configurations, will be discussed. This benchmark will offer a common basis for the evaluation of the performances of the HORUS3D/N scheme in 3D.
II. DESCRIPTION OF THE ACTUAL WORK
The benchmark for 3D calculations in JHR was established after selecting three core configurations. The first configuration only considered standard assemblies without any perturbation (test configuration), whereas the other two configurations also included control rods (starting configuration), and control rods and experimental devices (experimental configuration).
1. The Jules Horowitz Reactor
The JHR is a 100 MW pool-type light water reactor. The core can be loaded with 34 to 37 assemblies containing U3Si2 fuel with a 4.8 gU/cm3 density [1]. In order to reach a
high fast neutron flux level (~5×10¹⁴ n/cm2/s) necessary for experiments dealing with material and fuel behavior under irradiation, the fuel elements consist of 3 sets of curved plates maintained by aluminum stiffeners as presented in Fig 1. The fuel active height is 60 cm.
Fig. 1. JHR fuel assembly top view
They are loaded in an aluminum rack surrounded by a beryllium reflector designed to optimize the core cycle length and provide intense thermal fluxes (~5×10¹⁴ n/cm2/s) (see Fig. 2). Their central hole can host a control rod, an aluminum rod or an experimental device.
Fig. 2. Schematic of the JHR core
Up to 20 experimental devices can be loaded in the core or in the reflector, and irradiated at the same time.
In order to avoid boiling crisis in the upper part of the core, small boron plates are placed at the top of each fuel element.
2. Monte-Carlo Burnup calculation with TRIPOLI-4®D
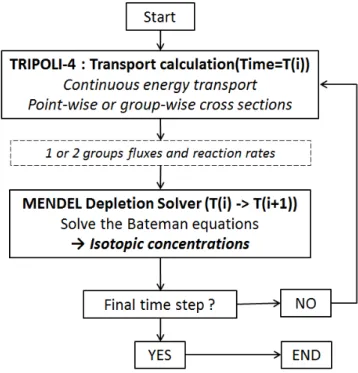
The Monte-Carlo depletion core calculations are performed with the TRIPOLI-4®D code coupling the TRIPOLI-4® probabilistic transport code and the MENDEL depletion solver (Fig. 3) [6]. Both interfaces are linked to the C++ interpreter CINT belonging to the ROOT libraries developed at CERN. The TRIPOLI-4® transport calculations are performed using continuous energy, providing 1 or 2 groups fluxes and microscopic reaction rates to MENDEL for solving the Bateman equations with the 4th order Runge-Kutta method.
Two different methods are available for the time discretization: an explicit Euler method and a second-order predictor-corrector one.
Fig. 3. TRIPOLI-4®D Monte-Carlo Burnup Calculation Based on the APOLLO2 standard depletion chain, the MENDEL chain considers 26 actinides and 126 fission products.
MENDEL does not allow the statistical error propagation during the burnup step. One way to provide confidence intervals on isotopic concentrations is to use independent simulations according to an ‘independent replicas’ approach to compute a probability distribution of
each tally [8]. This is the method implemented in TRIPOLI-4®D and illustrated in Fig. 4.
Fig. 4. Independent replicas approach
3. 3D JHR core calculations benchmark
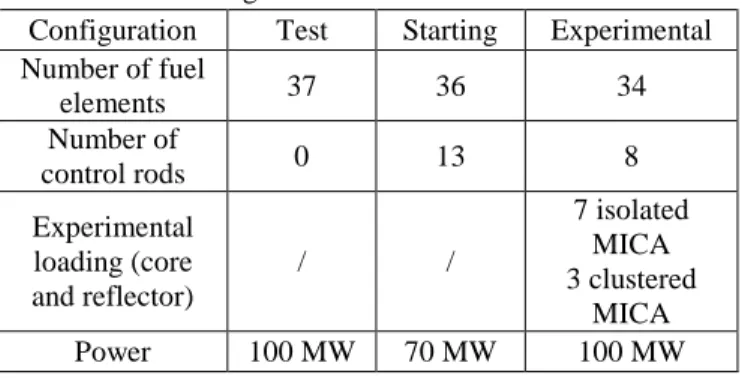
Table I describes the three studied core configurations in which perturbations are progressively introduced. Table I. Core configurations for the benchmark
Configuration Test Starting Experimental Number of fuel elements 37 36 34 Number of control rods 0 13 8 Experimental loading (core and reflector) / / 7 isolated MICA 3 clustered MICA Power 100 MW 70 MW 100 MW A 10 meshes axial discretization is considered in the fuel. Each discretized fuel plate is considered as a different medium in depletion. The depletion of the boron plates was also modelled. Experimental MICA devices are modelled by a homogeneous mixture of NaK and stainless steel.
The TRIPOLI-4®D calculations are performed using the massively parallel CEA clusters because of the requirements in memory and number of processors. The time scheme based on the Euler explicit method was selected because of the calculation time constraint on the cluster. 238U and 235U reaction rates are directly computed by TRIPOLI-4® using point-wise cross sections in order to treat correctly self-shielding phenomenon. The reaction rates of the other nuclides are built from 11514 groups flux calculated at each calculation step and GENDF cross sections generated in advance by NJOY. The Euler approach consists in calculating for a given time t, the flux φt and reaction rates
corresponding to the isotopic vector at this time. Then, a depletion calculation using this flux φt provides the isotopic
vector at the end of the time step. 300 batches of 5000 neutrons per simulation and 8 independent replicas of the calculation are used. These simulation parameters allow
obtaining standard deviations on the effective multiplication factor of less than 90 pcm which could be acceptable in this context because of the calculation time limitations.
Deterministic 3D calculations are performed on a hexagonal spatial meshing with the CRONOS2 diffusion code using 6 energy groups [2]. Transport-diffusion equivalence factors are defined and used in order to correct the impact of the diffusion approximation and the impact due to the following simplifications: collapsing, homogenization, and approximations in the CRONOS2 calculations [2]. The CRONOS2 depletion calculations are performed using one energy group and the depletion chain only considers a restricted number of isotopes. In CRONOS2, the heavy nuclide content in each cell is estimated by data interpolation from an APOLLO2 infinite lattice calculation for the corresponding burnup value of the considered mesh cell. Only the 10B, 135Xe and the 149Sm isotopic contents are calculated by CRONOS2. As for the TRIPOLI-4®D calculation, nuclear data come from the European nuclear data library JEFF3.1.1 [5].
The parameters of interest are the loss of reactivity and the isotopic concentration of the main fuel isotopes: 235,238U,
239,240,241
Pu, 135Xe and 149Sm and power distribution. Calculations are performed for average burnups of the core up to 60 GWd/tHM, using a 20% enriched fuel at 20°C
(start up like core). In both TRIPOLI-4®D and CRONOS2 calculations, the flux and reaction rates are normalized to the total power cumulated on all depleted compositions.
III. RESULTS
Table II summarizes the main TRIPOLI-4®D simulations characteristics. Concerning the calculation time, 4 days are required to reach the burnup value of 60 GWd/tHM using 29 burnup steps. Each of the 8 independent
simulations is performed on one CPU.
Table II. TRIPOLI-4®D simulation characteristics Configuration Test Starting Experimental No of media in
depletion 9768 9504 8976 No of independent
simulations 8 No of particles 1.5x10⁶ Final keff standard
deviation (2σ) 63 pcm 62 pcm 60 pcm Calculation time
(up to 60 GWd/tHM)
4 days
To give an order of magnitude, the use of 334 independent replicas of the TRIPOLI-4®D calculation allows reaching a final standard deviation of 10 pcm at 2σ on the keff value.
The depletion calculations are performed with CRONOS2 and TRIPOLI-4®D at constant power. Fluxes and reaction rates are normalized to the source intensity. A flux level is fixed calculating a renormalization factor. In TRIPOLI-4®D, this renormalization factor is calculated using the cumulated energy from fission and capture reactions taking place only in the depleted regions and normalized to the source intensity. The cumulated energy is calculated from fission and capture reactions rate and from energy release from these reactions. The comparison of the energy per fission and capture values used by the two codes confirms that the normalization of the fluxes and reaction rates to the total power is coherent (see Table III). The two codes take capture reactions into account.
Table III. Energy per fission and capture values used in TRIPOLI-4®D and CRONOS2 (MeV/fission)
Isotope TRIPOLI-4®D CRONOS2
235 U 193.7201 193.7204 238U 197.3138 197.3139 239Pu 199.0730 199.0735 240Pu 203.0036 203.0029 241 Pu 201.9801 201.9808 In the following, the TRIPOLI-4®D calculations are considered as reference results. Discrepancies with respect to such calculations are then given. The depletion data used by TRIPOLI-4®D and CRONOS2 are consistent and are both based on the CEA2005 standard depletion chains from the APOLLO2 code. Fig. 5 presents the comparison of the CRONOS2-TRIPOLI-4®D reactivity discrepancies as a function of the burnup for each of the three core configurations.
Fig. 5. CRONOS2-TRIPOLI-4®D reactivity discrepancy in
depletion for the three 3D core configurations of interest
In the three study cases, the CRONOS2 calculations tend to underestimate the reactivity for low burnup values and to overestimate it for a global burnup value above 8 GWd/tHM.
A conservative bias on the initial reactivity is highlighted. It reaches the value of -312 pcm for the test configuration and a maximum value of -645 pcm in the case of the starting configuration. These values are consistent with the trend observed in a previous validation study at time zero [9]. An increase of the CRONOS2/TRIPOLI-4®D discrepancy in depletion is identified when controls rods and experimental loadings are taken into account in the configuration. At the end of the irradiation period, the impact of the introduced perturbation is around 400 pcm in comparison with the test configuration. The cross-sections of these sub-critical media used in CRONOS2 are calculated by APOLLO2 using a B1 homogeneous leakage model. This bias confirms that this model is not well-adapted to describe this kind of media.
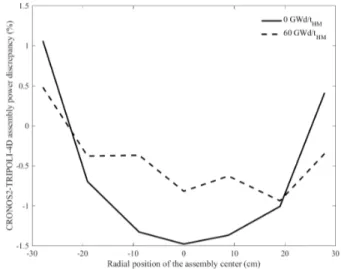
The comparison of the normalized assembly power distributions calculated by CRONOS2 and TRIPOLI-4®D at 0 GWd/tHM and at the end of the irradiation period leads to
an interpretation of the reactivity results behavior. Fig. 6 presents the results obtained on a traverse in the test configuration case.
Fig. 6. CRONOS2-TRIPOLI-4®D assembly power discrepancy on a traverse for the test configuration at 0 GWd/tHM and 60 GWd/tHM
The central assemblies are the major contributors to the power but their importance is decreasing as a function of burnup. CRONOS2 underestimates the power of the central assemblies so the fuel depletion is slower in this part of the core. The overall CRONOS2-TRIPOLI-4®D discrepancy is decreasing as a function of burnup as illustrated by the dotted curve. It confirms that slope of the reactivity curve progressively decreases during the depletion period. The
graph also highlights an overestimation of the power in the peripheral assemblies.
The next parameter of interest is the evolution of the isotopic inventory in depletion. All the comparisons are performed taking the total mass of the considered isotope contained in the whole core into account. Concerning the consumption of 235U in depletion, a good agreement between the two modellings is observed with a slight underestimation trend (Fig. 7). The maximum CRONOS2-TRIPOLI-4®D discrepancy lies between -0.5% and -0.2% at 60 GWd/tHM.
To give an order of magnitude, the standard deviation on the calculated masses does not exceed 0.2% (2σ) at 60 GWd/tHM.
Fig. 7. CRONOS2-TRIPOLI-4®D 235U mass discrepancy in depletion for the three 3D core configurations of interest
Table IV gives the CRONOS2-TRIPOLI-4®D discrepancy values on total masses of the main isotopes produced in depletion at the end of the irradiation period. A global over-prediction trend of the isotopic inventory is observed with CRONOS2. A reasonable consistency of the results even for the two fission products studied can be noticed.
Table IV. CRONOS2-TRIPOLI-4®D total mass discrepancy at 60 GWd/tHM
Configuration Test Starting Experimental
239Pu 6.2 % 6.0 % 9.2% 240 Pu 7.7 % 6.3 % 8.4% 241Pu 13.6 % 12.9% 16.9% 135Xe -3.6 % -4.9% -4.7% 149Sm 3.0 % -0.7% 3.3%
The maximum bias is observed for 241Pu, its value reaches 17% in the case of the experimental configuration.
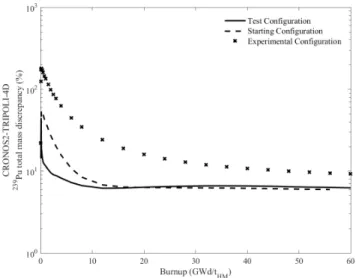
Such a high value however corresponds to a small amount of this isotope in the fuel. For each isotope of interest created under irradiation, a high discrepancy is first observed at low burnup values and vanishes for increasing burnup values as illustrated in Fig.8 with the case of 239Pu.
Fig. 8. CRONOS2-TRIPOLI-4®D 239Pu mass discrepancy in depletion for the three 3D core configurations of interest
The global overestimation of the plutonium content indicates that the ratio of 235U fission to 238U capture is not well evaluated using CRONOS2. This overestimation is coherent with the results obtained studying a 3D standard assembly in an infinite lattice with a CRONOS2-TRIPOLI-4®D discrepancy of 6.4% at 60GWd/HM. In order to
investigate this point, 235U fission and 238U capture microscopic cross sections were evaluated from the fluxes and reaction rates calculated respectively by CRONOS2 and TRIPOLI-4®D in the center and at the top of a single 3D assembly in an infinite lattice at 0 and 60GWd/tHM. The 6
energy group mesh used is specified in Table V. Table V. The 6 energy groups mesh
Energy group number Esup (eV)
1 1.964E+07 2 9.511E+05 3 7.466E+03 4 4.000E+00 5 6.250E-01 6 1.380E-01
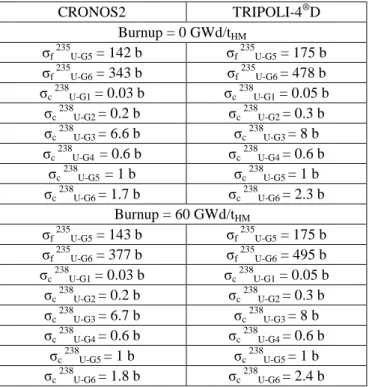
The results are detailed in Table VI for the central fuel mesh. For 235U, only the two thermal groups were considered. Higher 235U fission cross sections values are calculated with TRIPOLI-4®D data. Concerning 238U, the discrepancy observed in the third energy group has the most
important impact because the largest number of 238U capture reactions occurs in this group.
Table VI. Recalculated 235U fission and 238U capture microscopic cross-sections at 0 and 60 GWd/tHM in the
central fuelmesh
CRONOS2 TRIPOLI-4®D Burnup = 0 GWd/tHM σf 235U-G5 = 142 b σf 235U-G5 = 175 b σf 235U-G6 = 343 b σf 235U-G6 = 478 b σc 238 U-G1 = 0.03 b σc 238 U-G1 = 0.05 b σc 238U-G2 = 0.2 b σc 238U-G2 = 0.3 b σc 238U-G3 = 6.6 b σc 238U-G3 = 8 b σc 238U-G4 = 0.6 b σc 238U-G4 = 0.6 b σc 238 U-G5 = 1 b σc 238 U-G5 = 1 b σc 238U-G6 = 1.7 b σc 238U-G6 = 2.3 b Burnup = 60 GWd/tHM σf 235U-G5 = 143 b σf 235U-G5 = 175 b σf 235 U-G6 = 377 b σf 235 U-G6 = 495 b σc 238U-G1 = 0.03 b σc 238U-G1 = 0.05 b σc 238U-G2 = 0.2 b σc 238U-G2 = 0.3 b σc 238U-G3 = 6.7 b σc 238U-G3 = 8 b σc 238 U-G4 = 0.6 b σc 238 U-G4 = 0.6 b σc 238U-G5 = 1 b σc 238U-G5 = 1 b σc 238U-G6 = 1.8 b σc 238U-G6 = 2.4 b
The observed discrepancies have an impact on the same energy groups even when the fuel spatial discretization is refined. The observed discrepancies are thus not due to the axial reflector modelling used in CRONOS2 but linked to a global phenomenon. As the trend is the same irrespective of burnup, the depletion process cannot be held accountable for the observed discrepancies. The comparison of the spectral indices determined from the 238U microscopic capture cross sections confirms that the TRIPOLI-4®D spectrum is more thermal than the APOLLO2 one. Nuclear data are consistent so the discrepancy appears to be linked to the APOLLO2 condensation flux used to provide CRONOS2 neutronic constants condensed and homogenized and calculated for an assembly in an infinite lattice configuration.
It is also interesting to evaluate the impact of the reflector proximity on the results. The 235U, 239Pu, 135Xe and
149
Sm masses calculated in the first sector of the central assembly and in the first sector of a peripheral one were thus compared in the case of the test configuration to avoid the influence of the perturbations. These two sectors are identified in Fig. 9. The results are presented as function of each assembly local burnup that reaches 80 GWd/tHM for the
central assembly and 50 GWd/tHM for the peripheral one.
Fig. 9. Reflector impact in the Test Configuration - studied assembly sectors
As can be seen in Fig. 10, the reflector proximity has a very slight impact on the order of magnitude of the observed CRONOS2-TRIPOLI-4®D 235U mass discrepancy. In fact the discrepancies are less than -0.2% at the local burnup of 80 GWd/tHM in the central assembly, and less than -0.5% at
the local burnup of 50 GWd/tHM in the peripheral one.
Fig. 10. CRONOS2-TRIPOLI-4®D 235U mass discrepancy in depletion between a central and a peripheral assembly The results from the two codes are in agreement on the 235U consumption evaluation in the whole core. By contrast, the CRONOS2-TRIPOLI-4®D discrepancy on the 239Pu mass is higher in the peripheral area for high burn-up values, as can be seen in Fig. 11. In the central assembly, a reasonable discrepancy of 1.8% at 80 GWd/tHM is obtained. The 239Pu
production seems thus to be well calculated. On the other hand, in sectors facing the reflector, the discrepancy reaches the value of 7.2% at 50 GWd/tHM, highlighting the impact of
the reflector modelling calculation. As the fuel depletion is slower in the central part of the core, the 239Pu amount is
smaller in this area, so it explains the larger discrepancy observed for low burnup values.
Fig. 11. CRONOS2-TRIPOLI-4®D 239Pu mass discrepancy in depletion between a central and a peripheral assembly This CRONOS2 overestimation is also seen near the reflector for the two fission products studied. Even if the peripheral assemblies produce less power and have a lower effect on the total core reactivity, they represent almost 50% of the total assembly loading in the three cases. The trend observed in this area thus has a direct impact on the total mass discrepancy calculated considering the whole core case.
IV. CONCLUSIONS
Up to now, the validation of the HORUS3D/N neutronic scheme dedicated to the design and safety studies of the future Jules Horowitz Reactor was based on 2D APOLLO2 deterministic calculations. Henceforth, the adaptation of the recent TRIPOLI-4®D burnup Monte-Carlo code to the complex geometry of the JHR allows studying 3D core configurations in depletion using probabilistic transport methods. Three configurations of interest were considered introducing perturbations like control rods and experimental devices. For each configuration, 8 independent replicas of the TRIPOLI-4®D calculation were obtained using the Euler method to solve the transport-depletion coupling up to 60 GWd/tHM using 29 burnup steps. 4 days
were required to perform such a depletion calculation using 1.5x10⁶ simulated particles.
The parameters of interest in this benchmark are the reactivity and the isotopic concentrations of the main fuel isotopes as functions of burnup: 235,238U, 239,240,241Pu, 135Xe and 149Sm and power distribution.
Concerning the reactivity, a conservative initial bias is observed. The CRONOS2 calculations tend to
underestimate the reactivity loss for low burnup values and to overestimate it at the end of the irradiation period.
An increase of the CRONOS2/TRIPOLI-4®D discrepancy in depletion is observed when controls rods and experimental loadings are introduced in the configuration. At the end of the irradiation period, the impact of the perturbation reaches around 400 pcm.
The comparison of the normalized assembly power distributions calculated by the two codes at 0 GWd/tHM and
60 GWd/tHM highlights the overestimation of the peripheral
assembly power in the CRONOS2 calculation.
Concerning the isotopic content, a good agreement between CRONOS2 and TRIPOLI-4®D is found about the
235U consumption, where the discrepancies values are less
than -0.5% at 60 GWd/tHM. By contrast, a global
overestimation of the plutonium inventory calculated by CRONOS2 is identified. The comparison of the results obtained for the central assembly and for a peripheral one in the configuration without perturbation, shows that the overestimation is located in the peripheral area. This overestimation is also confirmed by the study of a 3D standard assembly in an infinite lattice. The comparison on such a configuration indicates that this trend is a global phenomenon not linked to the depletion process. As nuclear data are consistent between the two calculations, the erroneous evaluation of the 235U fission to 238U capture ratios by CRONOS2 appears to be due to the APOLLO2 condensation flux used to provide the condensed and homogenized data for the diffusion calculation. This conclusion highlights the limits of a two steps calculation. The main results of the study are summarized in Table VII. Table VII. Summary of the CRONOS2-TRIPOLI-4®D benchmark
Configuration Test Starting Experimental Initial reactivity -312 pcm -645 pcm -445 pcm
Final reactivity 360 pcm 665 pcm 728 pcm Perturbation
impact / 400 pcm
Isotopic content CRONOS2-TRIPOLI-4®D discrepancies
235U -0.5 % -0.4% -0.2% 239Pu 6.2 % 6.0 % 9.2% 135
Xe -3.6 % -4.9% -4.7%
149Sm 3.0 % -0.7% 3.3%
As a complement to this work, these first TRIPOLI-4®D results are planned to be compared to MCNP-ORIGEN (MONTEBURNS) calculations. The forthcoming MONTEBURNS calculations using the same nuclear data library will permit to assess the performance of the TRIPOLI-4®D depletion solver against a different
Monte-Carlo burnup tool. In the context of the planned work, 3D core calculations will be performed using the second order Predictor-Corrector temporal scheme.
ACKNOWLEDGEMENTS
The Swedish Research Council is acknowledged for financially supporting this work (research grant ID B0774701).
REFERENCES
1. G. BIGNAN, “The Jules Horowitz Reactor: a new high performances European Material Testing Reactor (MTR) as an International Center of Excellence-Update status and focus on the modern Safety approach,” Proc. IAEA Conference on Research Reactors, Rabat, Morocco, November, 14–18, (2011).
2. C. VAGLIO-GAUDARD et al., “HORUS-3D/N neutronics calculation tool dedicated to JHR design and safety studies – Development, Validation, biases and uncertainties quantification,” Proc. RRFM 2015, Bucharest, Romania, April 19–23, 2016, European Nuclear Society (2015) (CD-ROM).
3. R. SANCHEZ et al., “APOLLO2 Year 2010,” Nucl. Eng. Tech., 42, 5, 474-499, (2010).
4. J.J LAUTARD, S. LOUBIERE, C. MAGNAUD, “CRONOS, a modular computational system for neutronic core calculations,” Proc. IAEA Topical Meeting, Cadarache, France, (1990).
5. A. SANTAMARINA et al., “The JEFF-3.1.1 nuclear data library”, NEA, JEFF Report 22, (2009).
6. E. BRUN, F. MALVAGI, E. DUMONTEIL, “Challenges des simulations Monte-Carlo en évolution : TRIPOLI-4®D”, GEDEPEON (Groupement de recherche CEA – CNRS – EDF – AREVA NP), 11-12 July, Aix-en-Provence, France, (2011).
7. A. CHAMBON et al., “Validation of HORUS3D/N against TRIPOLI-4®D for Core Depletion Calculation of the Jules Horowitz Reactor” Proc. PHYSOR 2016, Sun Valley, Idaho, May 1–5, 2016, American Nuclear Society (2016) (USB).
8. E. BRUN et al., “Systematic Uncertainty Due to Statistics in Monte Carlo Burnup Codes: Application to a Simple Benchmark with TRIPOLI-4®-D,” Nucl. Sci. Techn., 2, 879-885 (2011).
9. J.M VIDAL et al., “Validation du formulaire HORUS3D/N v4.2 et détermination des biais et incertitudes sur les paramètres neutroniques calculés à temps 0 et en évolution”, NT DEN/CAD/DER/SPRC/LPN/14-1680 Indice C, CEA (2016).