HAL Id: hal-01577127
https://hal.archives-ouvertes.fr/hal-01577127
Submitted on 24 Aug 2017
HAL is a multi-disciplinary open access archive for the deposit and dissemination of sci-entific research documents, whether they are pub-lished or not. The documents may come from teaching and research institutions in France or abroad, or from public or private research centers.
L’archive ouverte pluridisciplinaire HAL, est destinée au dépôt et à la diffusion de documents scientifiques de niveau recherche, publiés ou non, émanant des établissements d’enseignement et de recherche français ou étrangers, des laboratoires publics ou privés.
Schneider
To cite this version:
Santiago F. Elena, Guillaume Beslon, Otmane Lamrabet, Dominique Schneider. EvoEvo Deliverable 1.3 : Analysis of evolvability (part 1). [Research Report] INRIA Grenoble - Rhône-Alpes. 2016. �hal-01577127�
Page 1 of 10
EvoEvo Deliverable 1.3
Analysis of evolvability (part 1)
Due date: M22 (September 2015)
Person in charge: S. Elena Partner in charge: CSIC
Workpackage: WP1 (Experimental observation of EvoEvo in action)
Deliverable description: Analysis of evolvability (part 1): evolvability: correlation between viral evolvability and robustness; correlation between rates of virus evolution and genome architecture; correlation between bacterial evolvability and restructuration of regulatory networks.
Revisions:
Revision no. Revision description Date Person in charge
1.0 First version; TEV part 25/11/15 S. Elena (CSIC)
1.1 E. coli part 30/11/15 D. Schneider (UJF) 1.2 Formatting and corrections by G. Beslon 01/12/15 G. Beslon (INRIA) 1.3 Adding intro and conclusions to TEV part 16/03/16 S. Elena (CSIC)
1.4 Update by UJF 24/03/16 O. Lamrabet (UJF)
Page 2 of 10
Table of Contents
1. INTRODUCTION 3
2. TASK 1.2 EVOLVABILITY AT THE POPULATION AND REGULATORY NETWORK LEVELS 3 2.1. SECTION 1: EVOLVABILITY AT THE POPULATION LEVEL IN THE TEV EXPERIMENTAL MODEL 3
2.2. SECTION 2: EVOLVABILITY AT THE REGULATORY NETWORK LEVEL IN THE E. COLI EXPERIMENTAL MODEL 6 2.2.1.
EVOLUTION EXPERIMENTS TO RECOVER FITNESS (D1.3 AND D1.4, DUE AT M20 AND M22, AND FINISHED AT M18) 7
2.2.2.
IDENTIFICATION OF COMPENSATORY MUTATIONS (D1.5, DUE AT M36 AND STARTED DURING THE LAST SIX MONTHS) 8
3. CONCLUSION 9
Page 3 of 10
1. Introduction
A system is said to be evolvable if it can be modified through genetic change in a way that enhances survival and reproduction. For natural selection to act, the system must show heritable phenotypic variation. Yet genetic robustness implies that the system produces little phenotypic variation in response to genetic variation. Therefore, robustness might limit evolutionary optimization and innovation (Lenski et al. 2006). In this vein, theoretical work has postulated that buffering mechanisms can lead to maladaptation compared to what would be achieved in their absence (Frank 2007). Also, the analysis of gene expression noise in yeast suggests that noise control may indirectly increase mutational robustness, which might in turn hamper evolvability at the level of gene expression (Lehner 2008). On the other hand, genetic robustness facilitates the accumulation of neutral or nearly neutral variation by relaxing the intensity of natural selection. This accumulated diversity can become visible to selection upon changes in the environment or genetic background, and thus be the source of evolutionary innovation. Computer simulations on simple population genetic models predict that genetic robustness can sometimes facilitate access to new adaptive peaks provided that occasional failures of robustness may occur (Kim 2007). The view that robustness can foster evolvability has also been supported by lattice protein models and PCR-based mutagenesis experiments showing that protein variants with increased thermostability have increased genetic robustness and are more likely to evolve new catalytic capabilities (Bloom
et al. 2006).
This Task builds on the preliminary results of Task 1.1 to study evolvability and its interactions with robustness. It is divided in two section that will address evolvability at two different levels using the most appropriate experimental model: evolvability at the population level in the TEV model, and at the regulatory network level in the E. coli model.
2. Task 1.2 Evolvability at the population and regulatory network levels
2.1. Section 1: Evolvability at the population level in the TEV experimental
model
The evolvability of the different TEV genotypes constructed for Task 1.1 (Deliverable 1.1) was evaluated. To do so, we have quantified the relative rate of fitness change during experimental evolution on the natural host N. tabacum and on alternative hosts (Nicotiana benthamiana, Datura
stramonium, Helianthus annuus, and Spinacea oleracea). Here we will describe only the results
obtained for the natural host, tobacco. Results for the alternative hosts will be described in part 2, expected for future deliverables.
Ten lineages of each of the eight viral genome organizations engineered were maintained by undiluted serial passages in tobacco. Infectious dosages were equivalent in all transmission events and the impact of genetic drift was minimized to make mutation and selection become the dominant evolutionary forces operating in these experiments. This was achieved by using highly concentrated virus preparations and maximizing the number of infection foci per plant by mechanical inoculation thus minimizing transmission bottlenecks (Zwart et al. 2011). Three 9-weeks passages were performed in all cases. These demographic conditions have been shown to optimize the effect of selection in fixing beneficial alleles and improve the fitness of reengineered genomes (Zwart et al. 2014). The fitness of the ancestral and resulting evolved lineages was
Page 4 of 10
evaluated by means of competition experiments against a common competitor (TEV-mCherry) as follows. All ancestral and evolved viral lineages were again normalized to the sample with the lowest concentration, and 1:1 mixtures of engineered genome equivalents was made with TEV-mCherry. The mixtures were mechanically inoculated on N. tabacum plants, using three independent plant replicates per viral lineage. The plant leaves were collected at 7 dpi, and stored at −80 ºC. RNA was extracted from 100 mg homogenized tissue as described above. RT-qPCR for the CP gene was used to determine total viral accumulation, and independent RT-qPCR reactions were also performed for the mCherry sequence using specific primers. The ratio of the evolved and ancestral lineages to TEV-mCherry (R) is then 𝑅 = 𝑛!"− 𝑛!"!!""# 𝑛!"!!""#, where 𝑛!" and 𝑛!"!!""# are the RT-qPCR measured copy numbers of CP en mCherry, respectively. Then we can estimate the within-host competitive fitness as 𝑊 = 𝑅! ! 𝑅!
, where R0 is the ratio at
the start of the experiment and Rt the ratio after t days of competition.
Figure 1 shows the results from these experiments. Each bar represents the grand mean of the 10 independent evolution lineages. Figure 1A shows the fitness values of ancestral and evolved viruses; Figure 1B shows the relative change in fitness, a measure of evolvability. Differences exist among genetic backgrounds in their evolvability (1-way ANOVA, P < 0.01), with TEV-eGFP being the most evolvable and TEV-NIb2, TEV-NIb1 and TEV-2b not showing significant changes in fitness relative to the ancestral. Interestingly, TEV-eGFP and TEV-2NIaPro are more evolvable than the wildtype TEV, whereas the genomes of TEV-2NIb2 and TEV-2NIb1 are as evolvable as the wildtype genome.
We can conclude from these experiments that alternative genomic organizations differ in their evolvability, some being more and some less evolvable than the wildtype TEV genome.
Page 5 of 10
Figure 1 – Evolvability of TEV strains with different genomic architectures. (A) Differences in fitness of
ancestral and evolved genomes. (B) Relative change in fitness (evolvability) for each genome. Error bars represent the standard deviation computed from 10 independent evolution lineages.
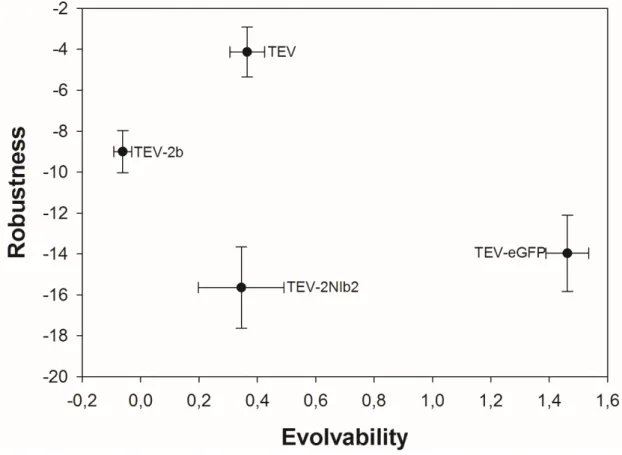
Finally, we sought for the association between the robustness of these genotypes (evaluated in Task 1.1 Section 3) and their evolvability (evaluated here). It has been suggested that evolvability and robustness shall be negatively correlated in the short evolutionary time (because robustness mechanism will buffer the effect of beneficial mutations) but positively correlated in the long run
Page 6 of 10
(because robustness allows accumulation of variation and exploration of distant regions of genotypic spaces) (Elena & Sanjuán, 2008). Figure 2 illustrates the relationship between these values. No significant association between these two traits has been observed for the four genotypes so far fully analyzed (Spearman rS test, P > 0.05). Interestingly, the wildtype TEV
genome is the most robust one but occupies an intermediate location in the ranking of evolvability. There are two possible explanations for this lack of association. Firstly, it is a simple statistical problem, owed to the very small sample size. This may fix as we add more data to the analysis. Secondly, may be observing the composed effect of short- and long-term effects, flatting off any significant trend.
Figure 2 – Lack of correlation between evolvability and robustness for the four engineered TEV genomes
analyzed.
2.2. Section 2: Evolvability at the regulatory network level in the E. coli
experimental model
This deliverable included evolution experiments by evolving crp-deleted strains in environments, determined during task 1.1, in which they have large fitness defects (D1.3 due at M20). The objective will be to select evolved clones with restored fitness and to sequence their genome to investigate the underlying molecular mechanisms (D1.5, due at M36). These experiments will allow us to understand how regulatory networks can be rewired after perturbation to provide new adaptive abilities to bacterial cells.
Page 7 of 10
2.2.1. Evolution experiments to recover fitness (D1.3 and D1.4, due at M20 and M22,
and finished at M18)
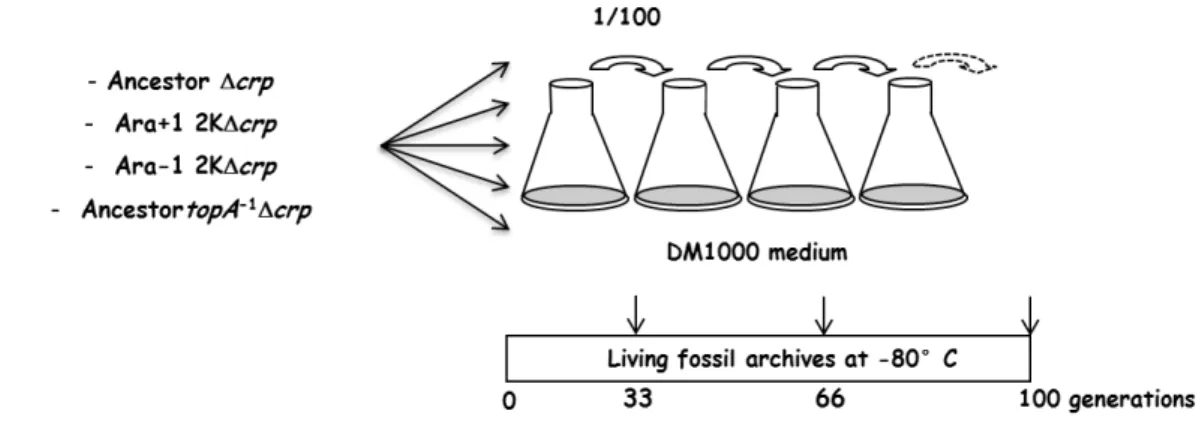
We initiated evolution experiments using crp-deleted strains as ancestors. They were propagated in a constant glucose-limited environment (DM1000) where we previously showed (task 1.1) that they had strong growth defects. The aim of these evolution experiments is to address whether and how they will recover their growth abilities. Four crp-deleted strains were propagated by daily transfers for 100 generations in DM1000 (Figure 3). The results that we gathered in Deliverable D1.2 targeted the choice of the four strains in which crp was deleted: the ancestor clone, one 2000-generation evolved clone from each of the Ara-1 and Ara+1 populations, and the ancestral clone in which we moved the Ara-1 topA allele that interferes with the crp deletion (see Deliverable 1.2 section 2.2.3). Five replicate populations were propagated for each of the four strains. Mixed populations were sampled after 33, 66 and 100 generations and frozen at -80°C. Moreover, 3 individual clones were isolated from the 100-generation mixed population and also frozen at -80°C.
Figure 3 – Evolution experiments using four crp-deleted strains as ancestors (K: x1000 generations).
We then measured the growth rate of each of the evolved clones isolated from each
population after 100 generations and compared it to the one of their direct ancestor
(Figure. 4). Most evolved clones were able to increase or restore their growth rates.
Page 8 of 10 Figure 4 – Growth rates of evolved crp-deleted clones compared to their relevant ancestors (K: x1000 generations). A) ancestor Δcrp, B) ancestor topA-1Δcrp, C) Ara+1 2KΔcrp and D) Ara-1 2KΔcrp. In this last case, the growth rates of evolved clones from only 3 of the 5 replicates are shown (2 replicates were contaminated).
2.2.2. Identification of compensatory mutations (D1.5, due at M36 and started during
the last six months)
We selected the clones: ancestor topA-1
Δcrp1A, ancestor topA-1Δcrp4A, ancestor topA-1Δcrp5C, Ara+1 2KΔcrp1A, Ara+1 2KΔcrp2B and Ara+1 2KΔcrp5A (Figure 4) for further genomic analyses. We extracted genomic DNA from each of these 6 clones. Their genome sequences were determined and analyzed using the Breseq pipeline (Deatherage & Barrick. 2014). Based on these genome sequences, we identified the mutations that were substituted during evolution and that may be involved in the restoration of the growth rate defects associated with the crp deletion in each of the four genetic backgrounds (Table 1). A high level of parallelism was observed with mutations identified in identical genes in several independently evolved clones from different ancestral strains. A high level of parallelism has been frequently observed associated with positive selection (Crozat et al. 2005, Pelosi et al. 2006, Barrick et al. 2009), thereby suggesting that the mutations we identified may confer higher fitness. In particular, mutations in the ptsG gene, involved in glucose transport, were selected for in 5 of the 6 analyzed evolved clones. Candidate mutations in ptsG from the five evolved clones ancestor topA-1
Δcrp1A, ancestor topA-1Δcrp5C, Ara+1 2KΔcrp1A, Ara+1 2KΔcrp2B and Ara+1 2KΔcrp5A are currently being moved in the relevant ancestral chromosome together with the crp deletion to demonstrate that they are involved in growth restoration. These results should allow us to understand how evolvable regulatory networks are and to determine the molecular mechanisms underlying changes in epistatic interactions within
Page 9 of 10
regulatory networks. Indeed, the mutations in ptsG occurred in its promoter region in sites known to be bound by transcription factors. To investigate the changes in molecular mechanisms associated with these mutations, we are now planning to analyse their effects on the transcription level of ptsG, the glucose transport rate inside the cells, and the binding of transcription factors in that regulatory region. Therefore, we will have a complete understanding, at the evolutionary, physiological, molecular and biochemical levels, of the rewiring of this regulatory network. This deliverable, which is due at M36 is therefore well advanced and no particular problem is foreseen here.
Table 1 – Mutations identified by genome sequencing in evolved clones derived from crp-deleted strains Ancestral strain Evolved clone Gene Type Change* Gene function
Ara+1 2K Δcrp
Ara+1 2K Δcrp1A ptsG Deletion 15 bp glucose PTS permease
Ara+1 2K Δcrp2B ptsG Deletion 15 bp
Ara+1 2K Δcrp5A
ptsG Deletion 15 bp
yihS IS_insertion IS150 sulfoquinovose
isomerase
Ancestor topA-‐1
Δcrp
Ancestor topA-‐1
Δcrp1A ptsG Mutation C-‐>T glucose PTS permease Ancestor topA-‐1
Δcrp4A manX Mutation C-‐>T mannose PTS permease Ancestor topA-‐1
Δcrp5C ptsG Mutation C-‐>T glucose PTS permease
* All mutations are in the transcriptional regulatory regions of each gene.
3. Conclusion
Evolvability has been studied at two different levels using the most appropriate biological model. At the genomic level, experiments with the TEV model have shown that:
• Different genomic organizations affect the evolvability of TEV, with some organizations being more evolvable than the wildtype and other less so.
• No significant association has been observed between robustness and evolvability, although this may be due to the reduced sample size of these experiments.
Page 10 of 10
At the regulatory level, experiments with E. coli have shown that:
• Perturbing the crp regulatory network had a drastic growth defects in a glucose-limited environment. We showed that this defect can be restored after only 100 generations of propagation in that environment. Therefore, regulatory networks are highly evolvable. • We identified the mutations allowing growth restoration and evolvability of the network.
They affect ptsG, a gene involved in glucose transport across bacterial membranes. These mutations are currently investigated to investigate their molecular effects.
4. References
Barrick JE, Yu D., Yoon SH, Jeong H, Oh TK, Schneider D, Lenski RE, Kim JF. 2009. Genome evolution and adaptation in a long-term experiment with Escherichia coli. Nature 461:1243– 1249.
Bloom JD, Labthavikul ST, Otey CR, Arnold FH. 2006. Protein stability promotes evolvability. Proc.
Natl. Acad. Sci. USA 103: 5869-5874.
Crozat E, Philippe N, Lenski RE, Geiselmann J, Schneider D. 2005. Long-Term Experimental Evolution in Escherichia coli. XII. DNA Topology as a Key Target of Selection. Genetics 169: 523–532.
Deatherage DE, Barrick JE. 2014. Identification of mutations in laboratory-evolved microbes from next-generation sequencing data using breseq. Methods Mol Biol. 1151: 165-88.
Elena SF, Sanjuán R. 2008. The effect of genetic robustness on evolvability in digital organisms.
BMC Evol. Biol. 8: 284.
Frank SA. 2007. Maladaptation and the paradox of robustness in evolution. PLoS ONE 2: e1021. Kim Y. 2007. Rate of adaptive peak shifts with partial genetic robustness. Evolution 61: 1847-1856. Lehner B. 2008. Selection to minimize noise in living systems and its implications for the evolution
of gene expression. Mol. Syst. Biol. 4: 170.
Lenski RE, Barrick JE, Ofria C. 2006. Balancing robustness and evolvability. PLoS Biol 4: e428. Pelosi L, Kuhn L, Guetta D, Garin J, Geiselmann J, Lenski RE, Schneider D. 2006. Parallel
changes in global protein profiles during long-term experimental evolution in Escherichia coli.
Genetics 173: 1851–1869.
Zwart MP, Daròs JA, Elena SF. 2011. One is enough: In vivo effective population size is dose-dependent for a plant RNA virus. PLoS Pathog. 7: e1002122.
Zwart MP, Willemsen A, Daròs JA, Elena SF. 2014. Experimental evolution of pseudogenization and gene loss in a plant RNA virus. Mol. Biol. Evol. 31: 121-134.