Publisher’s version / Version de l'éditeur:
Vous avez des questions? Nous pouvons vous aider. Pour communiquer directement avec un auteur, consultez la Questions? Contact the NRC Publications Archive team at
PublicationsArchive-ArchivesPublications@nrc-cnrc.gc.ca. If you wish to email the authors directly, please see the first page of the publication for their contact information.
https://publications-cnrc.canada.ca/fra/droits
L’accès à ce site Web et l’utilisation de son contenu sont assujettis aux conditions présentées dans le site LISEZ CES CONDITIONS ATTENTIVEMENT AVANT D’UTILISER CE SITE WEB.
Research Report (National Research Council of Canada. Institute for Research in
Construction), 2002-11-01
READ THESE TERMS AND CONDITIONS CAREFULLY BEFORE USING THIS WEBSITE.
https://nrc-publications.canada.ca/eng/copyright
NRC Publications Archive Record / Notice des Archives des publications du CNRC : https://nrc-publications.canada.ca/eng/view/object/?id=b6cd5f60-d4f4-4292-a964-2d33eaa3439c https://publications-cnrc.canada.ca/fra/voir/objet/?id=b6cd5f60-d4f4-4292-a964-2d33eaa3439c
Archives des publications du CNRC
For the publisher’s version, please access the DOI link below./ Pour consulter la version de l’éditeur, utilisez le lien DOI ci-dessous.
https://doi.org/10.4224/20386165
Access and use of this website and the material on it are subject to the Terms and Conditions set forth at
Final Report from Task 8 of MEWS Project (T8-03) - Hygrothermal
Response of Exterior Wall Systems to Climate Loading: Methodology
and Interpretation of Results for Stucco, EIFS, Masonry and
Siding-Clad Wood-Frame Walls
Beaulieu, P.; Bomberg, M. T.; Cornick, S. M.; Dalgliesh, W. A.; Desmarais,
G.; Djebbar, R.; Kumaran, M. K.; Lacasse, M. A.; Lackey, J. C.; Maref, W.;
Mukhopadhyaya, P.; Nofal, M.; Normandin, N.; Nicholls, M.; O'Connor, T.;
Quirt, J. D.; Rousseau, M. Z.; Said, M. N.; Swinton, M. C.; Tariku, F.; van
Reenen, D.
Climate Loading: Methodology and Interpretation of
Results for Stucco, EIFS, Masonry and Siding Clad
Wood-Frame Walls
Beaulieu, P.; Bomberg, M.; Cornick, S.; Dalgliesh,
A.; Desmarais, G.; Djebbar, R.; Kumaran, K.;
Lacasse, M.; Lackey, J.; Maref, W.;
Mukhopadhyaya, P.; Nofal, M.; Normandin, N.;
Nicholls, M.; O'Connor, T.; Quirt, D.; Rousseau,
M.; Said, N.; Swinton, M.; Tariku, F.; van Reenen,
D.
www.nrc.ca/irc/ircpubs
Final Report from Task 8 of MEWS
Project (T8-03)
Hygrothermal Response of
Exterior Wall Systems to Climate
Loading: Methodology and
Interpretation of Results for
Stucco, EIFS, Masonry and
Siding-clad Wood-frame Walls
Research report 118
Date of Issue: November 2002
Authors:
Peter Beaulieu, Mark Bomberg, Steve Cornick,Alan Dalgliesh, Guylaine Desmarais
,
Reda Djebbar,Kumar Kumaran Michael Lacasse, John Lackey, Wahid Maref, Phalguni Mukhopadhyaya, Mostafa Nofal, Nicole Normandin, Mike Nicholls, Tim O’Connor, David Quirt, Madeleine Rousseau, Nady Said, Mike Swinton, Fitsum Tariku, David van Reenen
Published by
Institute for Research in Construction National Research Council Canada Ottawa, Canada
TASK 8 – Outputs
Hygrothermal Response of Exterior Wall Systems to Climate Loading:
Methodology and Interpretation of Results for Stucco, EIFS, Masonry
and Siding-Clad Wood-Frame Walls
IRC Research Team
Peter Beaulieu Mostafa Nofal
Mark Bomberg Nicole Normandin
Steve Cornick Mike Nicholls
Alan Dalgliesh Tim O’Connor
Guylaine Desmarais David Quirt
Reda Djebbar Madeleine Rousseau
Kumar Kumaran Nady Said
Michael Lacasse Mike Swinton
John Lackey Fitsum Tariku
Wahid Maref David van Reenen
Phalguni Mukhopadhyaya
MEWS Steering Committee
David Ritter, Louisiana Pacific Corporation Eric Jones, Canadian Wood Council
Fred Baker, Fortifiber Corporation Gary Sturgeon, Masonry Canada
Michael Bryner, EI DuPont de Nemours & Co Sylvio Plescia, CMHC
Gilles Landry, Fiberboard Manufacturers Association of Canada
Fadi Nabhan, IRC, NRC Canada
Stephane Baffier, CPIA David Quirt, IRC, NRC Canada
Paul Morris, Forintek Canada Corporation Kumar Kumaran, IRC NRC Canada
Greg McManus, Marriott International Inc. Michael Lacasse, IRC NRC Canada
Table of Contents
Executive Summary Introduction
Chapter 1. An Integrated Research Approach to Moisture Management 1.1 Summary
1.2 The overall approach
1.3 Assessment of the outdoor climate 1.4 Wall assemblies for investigation 1.5 Estimation of moisture loads
1.6 Prediction of wall hygrothermal wall response to moisture loading 1.7 Evaluation of wall response to moisture loads
References
Chapter 2. Application to Stucco-clad Walls 2.1 Summary
2.2 Selection of materials and design of the wall assemblies 2.3 Assessment of moisture loads
2.4 Prediction of wall hygrothermal response to moisture loading Appendix 2.1 Table of All hygIRC Simulation Results
Chapter 3. Application to EIFS-clad walls 3.1 Summary
3.2 Selection of materials and design of the wall assemblies 3.3 Estimations of moisture loads
3.4 Prediction of wall hygrothermal response to moisture loading Appendix 3.1 Table of All hygIRC Simulation Results
Chapter 4. Application to masonry-clad walls 4.1 Summary
4.2 Selection of materials and design of the wall assemblies 4.3 Estimations of moisture loads
4.4 Prediction of wall hygrothermal response of masonry-clad assemblies Appendix 4.1 Table of All hygIRC Simulation Results
Chapter 5. Application to siding-clad walls 5.1 Summary
5.2 Selection of materials and design of the wall assemblies 5.3 Estimations of moisture loads
5.4 Prediction of hygrothermal response of hardboard siding assemblies 5.5 Prediction of hygrothermal response of vinyl siding assemblies
Appendix 5.1 Table of all hygIRC Simulation results for hardboard siding-clad walls Appendix 5.2 Table of all hygIRC Simulation results for vinyl siding-clad walls Chapter 6. Trends in the hygrothermal response to moisture loading
Executive Summary
By 1997, several field surveys in North America had indicated that rain penetration in exterior walls and poor construction detailing contributed to the shortening of the service life of recently built exterior walls of low-rise buildings in climates with high exterior moisture loads. There was a movement in industry to rethink the ways that exterior walls had been put together in recent years, as well as a renewed appreciation that exterior climates vary in severity from one location to another.
In 1998, IRC/NRC initiated a research consortium with industry partners to develop guidelines for moisture management for exterior wall systems (MEWS) in low-rise residential buildings of North America. Partners represented the wood industry, manufacturers of cladding systems, insulation materials and water resistive barriers as well as building owners and managers. The project was broken down into several tasks, from a review of literature on current construction practice to experimental work in the laboratory and mathematical modelling. The following four types of cladding systems were included in the project: Portland cement plaster (stucco), Exterior Insulation and Finish Systems (EIFS), masonry and siding, over wood-frame construction.
This TG8 report is a research document. The objectives of the report are three-fold: to describe the research approach in some detail (chapter 1), to summarize its application to the four types of wall assemblies (chapters 2 - 5) and to draw general conclusions (chapter 6), based on the observations in chapters 2 - 5. The reader is strongly advised to consult the research team before the information presented in this report is used for building design considerations.
Hygrothermal Response of the Wall Assembly
2-D computer simulations (using IRC's program "hygIRC") and laboratory experiments were used to predict the hygrothermal response of walls subjected to climate inputs recorded for seven locations covering a wide range of climate severity. Each wall/location combination was re-run several times with different selections of material properties and assemblies to explore their relative effectiveness in dealing with different levels of moisture loads. The parameters studied thus included climate severity, material properties and configurations of wall components. The quantities of main interest from a durability standpoint were the hourly temperatures and relative humidities prevailing in moisture-susceptible regions of the wall assemblies, over a two-year period.
Chapters 2 - 5 illustrate the insights offered by hygIRC simulations and highlight important design considerations. Comparative performances of cladding systems using different moisture management strategies and different materials are the focus of discussion. Comparisons are based on the two-year histories of predicted RH and temperature for a target region in the wall, captured by a single-number indicator called RHT (defined below). The results of the parametric study discussed in Chapters 2 - 5 reveal the sensitivity of the integrated MEWS approach to variations in the characteristics of representative wall assemblies exposed to different climatic conditions found in North America.
Except for one "base case" for each wall/climate combination, all hygIRC simulations included a water leakage path to the stud cavity. The latter simulations demonstrated forensic applications for the MEWS method, as well as the vulnerability of a design to a particular breach in its defenses against water entry.
Although the leakage path was chosen to be plausible and not overly severe (removal of a short length of sealant around a wall penetration), it is not claimed to be the most common deficiency found in practice. Given the necessarily limited scope of the parametric study, it cannot be expected to address the concerns of specific design or analysis situations.
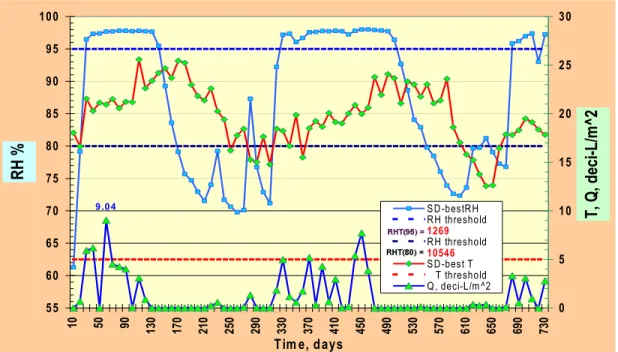
quantify and compare the localised hygrothermal response in a critical region of focus of the wall assembly. This index captures the duration of moisture and thermal conditions coexisting above a pair of threshold levels, say X and Y respectively, during an exposure of two years. RHT is defined as the summation of values at 10-day intervals, of (RH, % - X) multiplied by (Temperature, ˚ C – Y), only when both terms are positive. The resulting cumulative RHT value serves as a single-valued index of the hygrothermal response within the region of focus in the given wall over the two-year period of the simulation runs. Two insights from the RHT index are that two different walls with similar cumulative RHT values can still have very different hygrothermal responses over time and that climates or conditions that seem intuitively to be quite different can produce similar cumulative exposure to temperature and RH conditions.
Moisture index (MI), an Indicator of External Moisture Loading Severity
Within the scope of the MEWS project, the main environmental load is, of course, moisture, and for the majority of North American sites, rain plays the leading role, assisted by wind to get it onto the wall surface. The other side of the coin as far as external environment is concerned, is the potential for drying through evaporation. So in addition to rainfall and wind (strength and direction), climate data provides input on temperature and relative humidity as well as solar radiation and cloud cover. The wall system is the environmental separator used to maintain an even and comfortable climate indoors regardless of what happens outside. Two different types of environmental loadings need to be considered, outdoor and indoor, with the wall system in between. Wall performance depends partly on how indoor humidity (RH) and temperature are controlled, and the two loads are analogous to the external and internal wind pressures that determine the net air pressure load on the building envelope.
The basic approach developed in MEWS was to use a Moisture Index to describe the climate. The MI permitted a better comparison of moisture loads at various geographic locations than can be gained from the simple distribution of rainfall amounts. The Moisture Index is a function of two terms, the potential for wetting, the Wetting Index (WI) and the potential for drying, the Drying Index (DI). The higher the value of the MI, the more severe is the moisture loading. For this study the WI was based on annual rainfall while the DI was based on annual potential evaporation. A provisional climatic zoning map of North America based on MI was devised, as a byproduct of MEWS research. MI was calculated for 383 North American locations to produce five climate zones varying in moisture load severity.
The Parametric Study
The parametric study investigated the hygrothermal response of different wall assemblies when subjected to exterior moisture loads on the cladding, as well as into the stud cavity when a specific deficiency in the wall assembly provided a water leakage path to the stud cavity. Functions for estimating hourly amounts of water leaking into the stud cavity (referred to as “1Q set of hourly moisture loads”) were derived from laboratory experiments on several large-scale wall specimens with and without deficiencies, subjected to simultaneous water spray and air pressure differential simulating wind-driven rain. Specifying a representative deficiency was a challenge, given the many possible variations in the field, as well as a lack of information about them. A length of missing sealant (i.e. 45-50 mm) at the junction between a cover plate for a through-the-wall penetration (duct or electrical receptacle) and the cladding was used for establishing the water driving functions. Most of the parametric study predicting the effect of changes on the wall hygrothermal response was done using a 1Q set of moisture loads in the stud cavity. As trends in RHT(95) wall response started to emerge, it became apparent that a 1Q set of moisture loads tended to oversaturate the wall in climates other than warm and dry. At this level of Qs, several parameters made little difference in the net drying of the wall, and hence in the RHT(95) response of walls exposed to climates with higher MI. To reflect this finding, the last part of the parametric study on vinyl-siding clad wall systems was slightly redesigned to reduce the moisture loads to a quarter of the original 1Q set of moisture loads in the stud cavity. At such reduced moisture loads in the stud cavity, changing the characteristics of some of the parameters started to have a net effect on the drying of the wall assembly and on the RHT(95) hygrothermal response of the wall.
The hundreds of simulations with hygIRC revealed the effects of each input condition and material property, on the predictions of hygrothermal response, giving considerable confidence in the efficacy of the MEWS method. Although the input conditions and properties represented the best attempts of researchers (with input from MEWS partners) to deal with practical situations, the primary objective was to develop the prediction method, not to cover all practical cases, and not to present definite guidelines for design. Despite the large number of simulations done, of which Chapters 2 -5 give a summary appreciation, they merely scratched the surface of the situations of interest to the industry and to the owners and occupants of buildings. Chapter 6 provides highlights of the trends observed for the hygrothermal response to moisture loading of the four types of wall systems investigated.
As is often the case with research, the results brought into focus further questions about its application to the original objectives. Certain tasks proved more difficult and time-consuming than anticipated and are still ongoing. Until they are completed, it would be premature to suggest that a comprehensive guide to moisture management of walls has been achieved.
Introduction
Water is the single factor that most affects the durability of building materials and components. Sources of water that can end up in walls include rain, snowmelt, condensation of water vapour in the outside and inside air, and migration of soil moisture (not to mention leaky pipes or roofs). Building materials can also take up water if exposed to the weather during construction. How effectively moisture is managed by exterior walls is therefore of prime importance in assuring their long-term performance. As the severity of the climate increases, so should the margin of safety (or redundancy) in the building envelope system. An integrated research approach to moisture management recognises that the performance of the wall assembly will be affected by:
- the characteristics of outdoor and indoor climates
- the heat and moisture storage and transmission capacities of the materials making up the assembly, as well as the level of redundancy in the moisture management strategy selected for it
-
the moisture management strategy applied in other parts of the building envelope (e.g. windows, roof, horizontal projections, soffits). This will affect the moisture loading of the wall.In 1998, IRC/NRC initiated a research consortium with industry partners to develop guidelines for moisture management for exterior wall systems (MEWS) in low-rise residential buildings of North America. Partners represented the wood industry, manufacturers of cladding systems, insulation materials and water resistive barriers as well as building owners and managers. The project was broken down into several tasks, from a review of literature on current construction practice to experimental work in the laboratory and mathematical modelling. The following four types of cladding systems were included in the project: stucco, Exterior Insulation and Finish Systems (EIFS), masonry and siding, over wood-frame construction.
This TG81 report is a research document. The objectives of the report are three-fold: to describe the research approach in some detail (chapter 1), to summarize its application to the four types of wall assemblies (chapters 2 - 5) and to draw general conclusions (chapter 6), based on the observations in chapters 2 - 5. The reader is strongly advised to consult the research team before the information presented in this report is used for building design considerations.
Chapters 2 - 6 illustrate the insights offered by hygIRC simulations and highlight important design considerations. Hygrothermal wall responses for each cladding system using different moisture management strategies and different materials are the focus of discussion. The comparisons were based on two-year histories of predicted RH and temperature for a target region in the wall, summarised by a single-number indicator called RHT. The results of the parametric study discussed in Chapters 2 - 5 reveal the sensitivity of the integrated MEWS approach to variations in the characteristics of representative wall assemblies exposed to different climatic conditions found in North America.
Except for one "base case" for each wall/climate combination, all hygIRC simulations included a water leakage path to the stud cavity. The latter simulations demonstrated forensic applications for the MEWS method, as well as the vulnerability of a design to a particular breach in its defenses against water entry. Although the leakage path was chosen to be plausible and not overly severe (removal of a short length of sealant around a wall penetration), it is not claimed to be the most common deficiency found in practice. Given the necessarily limited scope of the parametric study, it cannot be expected to zero in on the concerns of specific design or analysis situations.
.
Chapter 1. An Integrated Research Approach to Moisture Management
1.1 Summary
A method was developed to predict the relative hygrothermal response of exterior walls to moisture loads in various climates. This method includes the following steps:
- characterize exterior moisture loads through analysis of climate records
- ascertain how materials work together in wall assemblies, through laboratory testing and literature review
- establish hygrothermal properties of common wall materials by laboratory testing
- estimate water leakage rates into wall systems under simulated wind-driven rain conditions using IRC's Dynamic Wall Testing Facility
- based on reliable input from the first four steps, undertake a parametric study of the moisture and temperature balances in walls, using IRC's 2D computer model, hygIRC. This includes i) selecting years of climate records for three years of simulation runs ii) developing an indicator of the hygrothermal response of the wall iii) estimating moisture loads on a vertical wall of a certain height iv) selecting wall materials and combinations of interest to the industry.
Exterior Climate Loads
A climate index called Moisture Index (MI) has been developed based on the wetting and drying potentials offered by local climates. The MI comprises a Wetting Index based on annual rainfall and a Drying Index based on the vapour pressure of the outside air. The MI values vary from 0 to 1.4. A provisional contour map based on MI values for about 400 North American locations proposes five zones of varying severity (from the standpoint of moisture management).
Wall Assemblies
Wood frame walls with four commonly used cladding systems and different moisture management strategies were selected for lab testing and parametric study. These cladding systems were: Portland cement plaster (stucco), Exterior Insulation and Finish System (EIFS), masonry and siding (vinyl and hardboard). A literature review highlighted the significance of water leakage paths that can show up in service, circumventing the intended moisture management strategy. A water leakage path (called a deficiency, since this is a deviation from the design intent) was introduced in each wall assembly. Imperfections in the wall assembly allowing water to enter the stud cavity is an important feature of the application of the method in the MEWS project.
Hygrothermal properties (e.g. liquid diffusivity and water vapour permeability) unavailable for certain materials making up the wall assemblies were measured using established experimental and analytical procedures and were added to a database for the MEWS project. It is intended that this database be made public.
Wetting of Cladding
A procedure was developed to estimate on an hourly basis the exterior moisture loads deposited on a vertical flat wall of a given height and orientation, based on three different years of historical climate records (called “climate years”) for a given location. The selection of climate years used in this parametric study was based on a variant of the MI calculation procedure mentioned above, which takes into account
Water Leakage into the Stud Cavity
Rain entry through deficiencies providing a path to the stud cavity imposed increased moisture loads on sensitive internal elements of wall cladding systems. Large-scale wall specimens with and without a deficiency providing such path were subjected to air pressure loadings (simulating wind) and spray rates (simulating rain) to measure the quantity and destination of water flowing in. The deficiency consisted of a missing portion of a filet bead of sealant at the joints between the cover plate of a through-the-wall penetration such as an electrical outlet or a vent duct and the face of the cladding.
Hygrothermal Response of the Wall Assembly
2-D computer simulations served as the basis for the prediction of the hygrothermal response of a particular wall subjected to two years of climate inputs recorded for seven locations covering a large range of climate severities. Each wall/location combination was re-run several times with different selections of material properties and assemblies to explore their relative effectiveness in dealing with different levels of moisture loads. The parameters studied thus included climate severity, material properties and configurations of wall components. The quantities of main interest from a durability standpoint were the hourly temperatures and relative humidities prevailing in moisture-susceptible regions of the wall assemblies, over the two-year period.
Attention was focussed on temperature and moisture conditions in a small region of a moisture-sensitive material, deemed to have the greatest chance of showing damage first. Although research has not yet been completed to determine precisely what levels and duration of moisture and temperature are necessary for the onset of damage, two levels were used for the simulations documented in chapters 2 - 5. A one-number indicator for summarizing the moisture/temperature/duration state of the region of focus (ROF) for each two-year simulation was developed: the RHT index.
The RHT Index was computed from the following equation, in which the temperatures, T (ºC), and relative humidities, RH (%) predicted within the grid area making up the ROF, were sampled at 10-day intervals and averaged. Two years of a simulation run provided 73 sets of such computations that were summed up to become the single-digit RHT index:
RHT(X) = Σ (RH - X)•(T - 5) (1)
An essential feature of equation 1 was that each of the bracketed terms was taken as 0 when it was not positive. Unless RH exceeded the value X, and T exceeded 5 º C, at the end of a 10-day period, this period did not contribute to the summation. Values of X for the two levels used in MEWS were 80% for corrosion (e.g. of metal fasteners), and 95% for the growth of wood decay fungi. A temperature threshold of 5 ºC was considered appropriate for both damage processes.
Tables of RHT(80) and RHT(95) results for more than 100 simulations per wall type appear in appendices in chapters 2 - 5, and subsets of RHT(95) relating to particular parameter variations formed the basis of observations in the main body of each chapter. Wood decay seemed the better target for these discussions because of the relevance to materials being modeled, but some MEWS partners also showed keen interest in a detailed discussion of RHT(80) as well.
RHT(80) and RHT(95) are just two of many possible indicators of the relative hygrothermal response of different wall assemblies in various climates. Varying the RH threshold restricts attention to moisture conditions appropriate for different damage processes, but at the same time, alters the scale of the RHT indicator. RHT(80) values were generally about 6 times larger than the corresponding RHT(95) values. This suggested that relative differences may be more useful for comparisons among simulation results than the values themselves.
1.2 The Overall Approach
At the time the MEWS project was developed in 1997, several field surveys in North America indicated that rain penetration in exterior walls and poor construction detailing contributed to the shortening of the service life of recently built exterior walls of low-rise buildings in climates with high exterior moisture loads. There was a movement in industry to rethink the ways that exterior walls had been put together in recent years, as well as a renewed appreciation that exterior climates vary in severity from one location to another.
Effective moisture control in the building envelope is essential if acceptable service life is to be achieved for the built environment. Effective moisture control implies both minimizing moisture entry into the system, and maximizing the exit of moisture that does enter, so that no component in the system stays “too wet” for “too long”. But what is “too wet” and “too long”? The MEWS research project provided an integrated approach for the prediction of the hygrothermal performance of four types of cladding over wood-frame walls of residential buildings. This approach was used to gain insight into the comparative benefits of changes to the material properties and to the design of the wall assembly on the hygrothermal response of the wall, for a variety of levels of severity in climates as well as in the deficiencies allowing water to bypass the cladding system. This approach is depicted schematically in Figure 1.1 and will be explained in this chapter.
Q Ideal Wall Climate characterisation
Model Simulation
hygIRC
Output Full-scale tests DWTF Material properties BenchmarkingResponse curve
--Climate Severity-->
--W
a
ll Re
s
pons
e
-->
Building practice Q Ideal Wall Q Ideal Wall Climate characterisationModel Simulation
hygIRC
Output Full-scale tests DWTF Material properties BenchmarkingResponse curve
--Climate Severity-->
--W
a
ll Re
s
pons
e
-->
Building practiceWith leakage in stud cavity Without leakage in
Prediction of the hygrothermal response of a wall required an understanding and characterization of the three major components involved: the outdoor climate, the indoor climate and the wall assembly that acts as an environmental separator between them (Figure 1.2).
Wall
Outdoor climate
Indoor climate
•Temperature
•Water vapour (RH)
•Air pressure
•Temperature
•Wind pressure
•Rain
•Water vapour (RH)
•Solar radiation
Materials, assembly and deficiencies
?
Wall
Outdoor climate
Indoor climate
•Temperature
•Water vapour (RH)
•Air pressure
•Temperature
•Water vapour (RH)
•Air pressure
•Temperature
•Water vapour (RH)
•Air pressure
•Temperature
•Wind pressure
•Rain
•Water vapour (RH)
•Solar radiation
•Temperature
•Wind pressure
•Rain
•Water vapour (RH)
•Solar radiation
Materials, assembly and deficiencies
?
?
Figure 1.2 An exterior wall as an environmental separator between outdoor and indoor climates
The development of an integrated research method for moisture management for exterior wall systems included these tasks:
o definition of wall types,
o determination of material properties,
o assessment of exterior (and interior) climate loads,
o assessment of the moisture loads leaking into a wall assembly,
o description of moisture and temperature conditions heralding the onset of damage, o parametric study of simulations to predict hygrothermal response of the four walls.
Each of the following sections describes briefly how each task was tackled and how it fed into the MEWS approach. Research reports describing in detail the methodology and the results for each of these tasks were published under separate covers.
1.3 Assessment of the Outdoor Climate
1.3.1 Characteristics of Outdoor Climates
The consideration of moisture sources and strategies for managing these really amount to designing the wall for durability, so that it remains serviceable for its desired service life. Designing for durability has some things in common with designing for strength to resist wind loads. Like wind, rain is an environmental load defined by the climate of a particular region. In fact, the real concern is rain in the presence of wind, without which very little rain would reach the wall surface. Raindrop trajectories depend on wind flow around the building, and to some extent on flow over structures and topographical features upwind. And like wind pressure, intensity of rain capture varies with position on the windward wall.
Because of their random variations over time and space, both wind and rain loads require statistical treatment of many years of climate records to derive design loads. Structural design is based on a single extreme wind load, with a suitably low risk of being exceeded during the life of the structure. This is achieved in the National Building Code Canada for cladding as follows: the minimum allowable basic design pressure is listed in Appendix C, Climate Information for over 650 municipalities as the hourly wind pressure with 1 chance in 10 of being equaled or exceeded in any year.
Durable design, on the other hand, requires estimation of the whole history of rain loading over the service life of the wall in question, and not just a single wind pressure. The required statistical treatment still must be based on many years of climate records, and in addition, must take account of the coincidence of wind and rain, and possibly wind direction as well. Clearly, the need for statistical assessment of rain loading is even greater than in the case for wind alone, and the questions to be answered are more complex. The implication for design is that statistical variations of outdoor climate parameters, including wind driven rain, are a major part of the unavoidable variability, or uncertainty, in the predicted performance of a wall system, no matter what guidelines or methods are used in making the prediction.
1.3.2 MI, an Indicator of External Moisture Loading Severity
Within the scope of the MEWS project, the main environmental load is, of course, moisture, and for the majority of North American sites, rain plays the leading role, assisted by wind to get it onto the wall surface. The other side of the coin as far as external environment is concerned, is the potential for drying through evaporation. So in addition to rainfall and wind (strength and direction), climate data provides input on temperature and relative humidity as well as solar radiation and cloud cover. The wall system is the environmental separator used to maintain an even and comfortable climate indoors regardless of what happens outside. Two different types of environmental loadings need to be considered, outdoor and indoor, with the wall system in between. Wall performance depends partly on how indoor humidity (RH) and temperature are controlled, and the two loads are analogous to the external and internal wind pressures that determine the net air pressure load on the building envelope.
Climate loads vary from hour to hour, season to season and year to year. Climates also vary within North America from region to region. Russoi partitioned the U.S. into 6 different climate types for the construction industry according to temperature (hot, >-1.1°C, mild, and cold, <-9.4°C) and precipitation (wet, >508-mm/yr, or dry). Russo’s classification gives an interesting historical perspective on MEWS TG 4 work to select representative climates for TG 7 predictions of the wall hygrothermal response. TG 4 looked for additional climate characteristics relating to wall performance, but the decision was taken to do this independently of the characteristics of the wall (see below).
The basic approach developed in MEWS was to use a Moisture Index (MI) to describe the climate. The MI permitted a better comparison of potential moisture loads than the simple distribution of rainfall amountsii. The Moisture Index is a function of two terms, the potential for wetting, the Wetting Index (WI)
in performance of any wall system when exposed to different climates. For wide applicability, MI was deliberately made independent of wall characteristics and design strategies that might be used to manage moisture loading. At the outset, only wetting and drying were considered. If other damage mechanisms, such as freeze-thaw damage, are to be considered, additional statistical treatment of the climate data will be needed for wall components. The combined Moisture Index was used to classify North America into zones, and also to choose specific locations in these zones. To assign rankings on the basis of climate analysis for several locations in North America, the following definition was used (details available in Task 4 final report): 2 normalized 2 normalized (1 DI ) WI MI= + − (1)
Table 1.1 lists the MI for 41 North American locations, calculated with hourly historical weather records, using equation (1).
Table 1.1 : Moisture Index calculated with hourly weather records for 41 North American locations
Location MI Location MI
Mobile AB 1.22 Tampa FL 0.95
New Orleans LA 1.21 Madison WI 0.95
St Johns NF 1.17 Windsor ON 0.94
Shearwater NS 1.15 Montreal QC 0.94
Wilmington NC 1.13 Ottawa ON 0.93
Vancouver BC 1.09 Kansas City MO 0.93
Miami FL 1.08 St. Louis MO 0.92
Atlanta GA 1.06 Toronto ON 0.92
Orlando FL 1.03 Minneapolis MN 0.90
Boston MA 1.01 Edmonton AB 0.89
Houston TX 1.01 Winnipeg MB 0.86
Victoria BC 1.00 San Francisco CA 0.86
Fredericton NB 0.99 Fargo ND 0.85
Seattle WA 0.99 Calgary AB 0.81
Wilmington DE 0.98 Fort Worth TX 0.79
Raleigh NC 0.97 San Diego CA 0.74
Iqaluit NU 0.97 Colorado Springs CO 0.70
Charlotte NC 0.96 Fresno CA 0.49
Baltimore MD 0.96 Phoenix AZ 0.13
Chicago IL 0.95 Las Vegas NV 0.11
Pittsburgh PA 0.95
Out of these forty-one locations, seven were selected for the parametric study. Two cities from the top third of the ranked list, two from the middle third and three from the bottom third of the list were selected for more in-depth analysis (see shaded locations in Table 1.1). Table 1.2 provides the range of climate types covered by this selection of locations.
Table 1.2 : Location and Climate Characteristics for seven selected locations Location Main Driving-Rain
Direction
Climate Type (Russo)
Rank, MI hourly
Wilmington NC North Warm, Wet 1.13
Seattle WA South Mild, Wet 0.99
Ottawa ON East Cold, Wet 0.93
Winnipeg MB North Cold, Dry 0.86
San Diego South Hot, Dry 0.74
Fresno East Hot, Dry 0.49
Phoenix AZ East Hot, Dry 0.13
1.3.3 Provisional Climate Zoning for North America
The provisional climatic zoning of North America based on MI was a byproduct of MEWS research. MI was calculated for 383 North American locations (using annual climate normals instead of hourly records) to produce the five climate zones shown in Figure 1.3. Annual records were used because of the large number of locations to process, but this does result in minor differences in MI from those based on hourly data (Tables 1.1, 1.2). The red zones see the most severe moisture load, followed by the orange zones, the yellow zones and then the green zone. The blue zone exhibits the lowest external moisture load (Table 1.3). The current zone boundaries are arbitrary; further research relating the performance of various wall systems within and between climate zones should provide useful insights for improvements.
Legend Zone 1 Zone 2 Zone 3 Zone 4 Zone 5 Phoenix San Diego Fresno Seattle Wilmington NC Ottawa Winnipeg
Table 1.3: Moisture Loading Limits Corresponding to Figure 1.3 Division Classification based on Moisture
Loading
Colour
MI greater or equal to 1.0 Zone 1 Red
MI greater or equal to 0.9 but less than 1.0 Zone 2 Orange
MI greater or equal to 0.8 but less than 0.9 Zone 3 Yellow
MI greater or equal to 0.7 but less than .0.8 Zone 4 Green
MI less than 0.70 Zone 5 Blue
To calculate the MI of hundreds of locations required for mapping North America, it was more practical and less time-consuming to use climate normals (averaged annual data based on three or more decades of data) as opposed to using hourly climate records, as previously done for a smaller number of locations. Please note that a different normalization scheme was used to generate the map (Task 4 Final report). Consequently there are differences between the MInormals used to build the map and the MI hourly
used in the parametric study. For example Wilmington NC has a MI of 1.13 calculated using hourly climate records and an MI of 0.96 based in climate normals. This difference does not affect the results or interpretation of the parametric study presented in Chapters 2-5.
1.3.4 Selecting Annual Sets of Climate Records for the Parametric Study
Once the seven representative locations were selected from the original 41 candidate locations, representative annual sets of historical climate records (called “reference years”) were chosen for each location. The MEWS parametric study spanned three years of predicted wall hygrothermal response, and it was decided that three different reference years would be used: a Wet, a Dry and an Average year. The hourly data from each chosen reference year would then be used as input to hygIRC. Because the mathematical model can take into account wind direction, the Wetting Index (WI) was redefined to rank the years according to how much rain would be deposited on a vertical one-storey high wall (not just rainfall on a horizontal surface, as before). The Wetting Index was defined as the total amount of wind-driven rain impinging on a wall in the predominant direction of wind-wind-driven rain for a year. Note that climate records distinguish between rain and snow (all forms of moisture are reported as precipitation, not rainfall), and WI was based on records of rain only. The year with the highest ranking was defined as the wet year (e.g. Wilmington NC 1984), the year with lowest ranking was defined as the dry year (e.g. Wilmington NC 1990), and the year with the ranking closest to the mean was defined as the average year (e.g. Wilmington NC 1988). The predominant direction of rainfall was determined by calculating the total amount of rain over 30 years or more impinging on a wall rotated through the four cardinal orientations. The orientation with the highest total amount of rain was selected as the predominant direction. Table 1.4 shows how the predominate direction was determined in the case of Wilmington NC. Six different methods were tried and were all in general agreement. Straube's method was selected as the final definition of the Wetting Index for selecting moisture reference years. The definition of the Drying Index remained unchanged.
Table 1.4: Determination of the Predominate Direction of Wind-Driven Rain Location: Wilmington NC Years = 22 Orientation
Method North East South West
Total Straube mm/m2 9369 8472 9251 2784
Total Lacy mm/m2 9871 8987 9862 2821
Total LIF mm/m2 6846 6260 6911 1913
Total UK method mm/m2 5422 5000 5568 1438
Total AHM mm/m2 3525 3220 3547 988
Hourly climate records with seven weather characteristics for each of the seven locations for three selected years (Wet, Average or Dry) were inputs for MEWS parametric study using hygIRC computer model (see example in Table 1.5).
Table 1.5 : Typical Exterior Climate Data Format
Radiation (W/m2) Time (hr) Temp-erature (°C) Relative humidity (%) Wind velocity (km/hr) Wind direction
(° ) Direct Diffused Reflective
Rain (mm/hr) Cloud Index 104 5.6 83 11.16 280 9 0 9 0.254 10 105 5 89 9.36 270 37 24 32 0.762 10 ….. …….. ………. ……. ……..
1.3.5 The Indoor Climate
The interior room climate was represented by two parameters: temperature (T) and relative humidity (RH). Interior room T and RH were switched from winter values of 22ºC, 25% (when mean monthly outdoor temperature was less than 11ºC) to summer values of 25ºC, 55% for the warmer months, following the ASHRAE criterion iiiiv. A few more cases with increased RH values during winter and summer (up to 40 and 75% respectively) were also investigated.
1.4 Wall Assemblies for Investigation
The MEWS project focused on wood-frame wall systems for low-rise residential buildings (up to four storeys high). The selection of the generic types of walls (defined by their cladding systems) was made early on in the project and was based on the common interest of all parties participating in the consortium. Walls with the following cladding systems were included: stucco, masonry, Exterior Insulation and Finish Systems (EIFS) and siding (hardboard and vinyl).
1.4.1 Full-Scale Wall Specimens Built for Laboratory Investigation of Water Penetration
A review of the literature and discussion with industry specialists of the consortium contributed to the definition of several moisture management strategies used in exterior wall assemblies of interest (TG2). The review of current practice was used to determine the composition and detailing of full-scale wall specimens for laboratory investigation of water penetration under simulated wind-driven rain conditions in the IRC Dynamic Wall Testing facility (TG6). Also the materials making up these wall assemblies of interest were subjected to a battery of tests that determined their hygrothermal properties (TG3), as these constituted another input file for the parametric study (see section 1.4.2).
Seventeen (17) full-scale wall specimens were included in the water entry evaluation testing: 5 stucco-clad, 5 EIFS, 4 masonry and three siding (2 hardboard and one vinyl) specimens. The specimens within a generic cladding group were different in either their design, the selection of materials or detailing at interfaces. Examples of the composition and detailing of the specimens are given in Figures 1.4 and 1.5. The description of the as-built test specimens (with deficiencies) was presented in the T2-02 MEWS report entitled: “Description of the 17 Large-scale Wall Specimens Built for Water Entry Investigation in IRC Dynamic Wall Testing Facility”, August 2002.
A recent field survey of failures stressed the importance of the design and construction of the interfaces between walls and other components (i.e. windows, ducts and decks) for the control of rain ingress v. Imperfections in the wall assembly providing a water leakage path to the stud cavity became an important
A water leakage path (called a deficiency, since this is a deviation from the design intent) was introduced in each wall specimen at the interfacing joint between the wall and a window frame, a vent duct or an electrical outlet inserted in the specimen (See examples in Figures 1.6 and 1.7). The TG2 review had highlighted the significance of water leakage paths that can show up in service, circumventing the intended moisture management strategy, exposing the moisture-sensitive materials located further into the wall to moisture loads these materials are not designed to sustain for long periods. Deficiencies2 within a wall assembly can develop at the design stage (material selection, detailing of assemblies), during construction (material abuse, substitution, detailing & sequence of construction) and during service life (maintenance, exposure). Certain deficiencies present in wall materials and assemblies can have a significant effect on the amount of water that enters the assembly, the amount of water that drains out and the amount of water that remains within the assembly, as well as the locations of accumulation.
1.4.2 Material Properties
The following material properties were measured or derived in the laboratory: water vapour permeability, air permeability, liquid diffusivity, sorption characteristics and suction pressure, dry density, heat capacity and thermal conductivity. Manufacturers supplied the materials; as for site-applied materials (such as stucco and EIFS), they were either fabricated along with the large-scale specimens, or pieces were cut out from these specimens months after rain entry testing was completed. All materials included in the mathematical simulations work (TG7) were analysed for the characterisation of their properties (see MEWS report T3-23 entitled: Hygrothermal Properties of Several Building materials”, March 2002.
a l Re se ar ch Council 4 /2 6/00 2:2 9 PM Eifs_9_ iv.d wg 38 mm Expanded polystyrene (with vertical grooves @ 300 mm o.c.)
Basecoat Reinforcing fibreglass mesh
WRB coating (continous)
Decorative finish
12 mm Glass mat gypsum board
Adhesive coating
39 mm x 89 mm (2" x 4") Wood studs
Figure 1.4 Composition of an EIFS-clad wall specimen used for DWTF investigation
2
For the purpose of the MEWS project, a deficiency in a wall assembly was defined as a characteristic of a material or of an assembly of materials that prevents the material or the assembly from fulfilling its function in the context of a given moisture management strategy for the walls. Most likely, a deficiency will provide a water entry path towards the inside of the wall. This in itself may or may not lead to the deterioration of building materials; the outcome will depend on the drying potential of the wall (that in turn is a
Acrylic sheet acting as air barrier
Deficiency:
50 mm of sealant length missing at top of protective plate
38 mm EPS insulation
12 mm gap between edge of sheathing and perimeter of duct 150 mm diameter
ventilation duct Sheathing
Opening of duct closed with a sheet of acrylic sealed at perimeter
Deficiency:
6 mm gap between WRB1
and edge of opening in sheathing
3 mm gap between edge of insulation and perimeter of duct
Water resistive barrier1
PB lamina
Note 1: -none for wall #6 -membrane for wall #7 -coating for walls #8, #9 &10
Backer rod and sealant at perimeter of ventilation duct Deficiency: 50 mm of sealant length missing at bottom of ventilation duct
Figure 1.5 Example of the detailing at the duct/wall interface for an EIFS-clad specimen – Vertical section
50 mm. missing bead
Figure 1.6 Examples of a missing length of a bead of sealant (deficiency) at the cladding/duct cover plate joint in a masonry wall specimen
op plate
Openings in acrylic sheet to simulate leakage of air barrier system
Acrylic sheet acting as air barrier
12 mm gap between edge of OSB and perimeter of duct 150 mm diameter
ventilation duct Opening of duct closed
with a sheet of acrylic sealed at perimeter
gap between edge of brick and perimeter of duct
Clay brick OSB, 11 mm Paper-based water resistive barrier Cavity, 25 mm 6 mm gap between WRB and edge of OSB
Vertical section Missing 90 mm of sealant length at t of cover Missing 50 mm of sealant length at top of cover plate
Figure 1.7 Example of a water leakage path from the external deficiency at the face of the cladding to the various cavities of the wall assembly
1.5 Estimation of Moisture Loads
Since the MEWS interest was in the hygrothermal response of wall cladding systems to moisture loading, the first task was to define the moisture loads as a function of climatic conditions at various North American locations. This was a three-step process:
1) determine the moisture load imposed by a given climate,
2) determine the proportion of that load that can reach the face of the wall and
3) for each cladding system, characterise the additional water loading directly into the stud cavity due to a given water leakage path at any through-the-wall penetration, including the known deficiency.
1.5.1 Climate Moisture Load
The moisture load was determined from the climate data provided by Task Group 4: Environmental Conditions. The important parameters were: 1) horizontal rainfall and 2) wind speed and direction. Section 1.3 covers the characterization of the outdoor climate and the selection of climate reference years.
1.5.2 Rain Loads on a Wall
The next step in assessing the moisture load was to relate the horizontal rainfall intensity to the wetting of the wall. External walls receive very little rain in the absence of wind (unless water from the roof is directed onto the wall because of faulty flashings or downspouts, or splashing on horizontal projections). Wind-driven rain, however, is another matter. The basic way of assessing the rain falling through a vertical plane is to calculate the driving-rain index (DRI). The DRI is simply the product of horizontal rain intensity and wind speed. Lacyvi proposed a method for evaluating the intensity of wind-driven rain on vertical walls based on many years of observation. His method is a simple modification of the Driving-Rain Index and is given below.
WDR = 0.222 * V(h) * rh0.88 (2)
where: WDR is the wind driven rain passing through a vertical plane (l/m2-h) 0.222 is a proportionality and units conversion constant.
rh is the horizontal rainfall intensity (mm/m2-h)
V(h) is the wind speed at the height of interest (m/sec) 0.88 is a raindrop size factor.
The rain passing through a vertical plane is not the same thing as rain falling onto the wall of a solid building. As the wind approaches the building, the streamlines are diverted upwards to pass over the roof, and to either side. Depending on the building shape, the size of rain droplets, the strength of the wind and the angle of incidence, rain intensity can vary over the windward wall from light near the bottom and middle to heavy along the top and sides.
One method of deriving wind-driven rain, knowing wind speed and direction as well as horizontal rainfall, was that proposed by Straubevii. His method is an elaboration of Lacy’s equationvi. For walls partitioned into a grid of zones, intensity factors for each zone have been obtained from rain gauges on real buildingsvi, and from computer studies of wind-driven rain on isolated building modelsviii. The UK standard uses a series of factors to account for terrain roughness and topographical effects, and nearby obstructions, in addition to a zone factor for the effect of the building ix. As these extra factors would unduly complicate the simulation process, Straube’s simpler approach was adopted, using a “Rain Admittance Factor” of 0.4. This is consistent both with Straube’s field measurements, and with the BRI zone factor, for the central zone at mid-height of a one-storey building, i.e. 1.8-m. It should be noted that the various methods for computing the rain load on walls are all in general agreement. This is shown in
Straube's method as used in the MEWS project is summarised below.
Rainload on a wall, Rw (L/m2) = RAF * DRF(Rh) * cos (Θ) * V(h) * Rh, (3)
RAF is the rain admittance factor
DRF(Rh) is the driving rain factor (akin to Lacey’s 0.222, depending on rain drop size and its terminal
velocity)
Rh is the horizontal rainfall intensity (mm/h = L/m2-h)
V(h) is the wind speed at the height of interest, i.e. 1.8 m (m/s) Θ is the angle of the wind to the wall normal
1.5.3 Moisture Ingress into the Wall Assembly
The final step in assessing the moisture loading was to characterise the ingress of water into each of the wall systems through nominal deficiencies. Full-scale and small-scale laboratory tests were conducted to determine the path of water from an external deficiency to the stud cavity. Contrary to the expectations of MEWS consortium partners who had examined failures in the field, these experiments suggested a rather direct route to the bottom of the stud cavity. For the purposes of the parameter study, in most of the simulations, water was placed at the bottom of the stud cavity. In a few supplementary simulations the leaked water was placed midway up the wall, representing leakage under a window. The indications from the supplementary simulations will be discussed in Section 1.7 Evaluation of Wall Response to Moisture loads.
The dynamic wall test facility (DWTF) was used to subject the specific wall systems, stucco, EIFS, siding, and masonry, without and with the specified deficiencies, to the simultaneous effects of water spray and pressure differential. For each cladding system several representative wall specimens were constructed in accordance with information from Task Group 2, including deliberately introduced deficiencies (see 1.4.1). The deficiencies included a missing length of sealant at the interface between the wall and an electrical outlet receptacle and a ventilation duct. Figure 1.8 shows the elevation of the wall specimens tested in the DWTF indicating the general location of the window, the ventilation duct, the electrical outlet and the studs.
2400 mm
Electrical outlet box
Location of wood studs
Vent duct 2400 mm
Window
The DWTF test results for each wall system were used to calculate the rate of water entry (L/h) through a deficiency into the stud space, as a function of spray rate and pressure difference across the entire assembly. The spray rate represented the rain intensity on the wall, as computed from the hourly horizontal rainfall of the climate records (see 1.5.2). The pressure difference across the whole wall was more readily calculated for simulations, using hourly wind speed and direction from the climate records. However the actual pressure differential driving water into the stud space was likely lower than the total pressure differential acting across the wall assembly unless the cladding, sheathing membrane, and sheathing board were much tighter than the interior wall layers, as would be the case for a face-sealed wall system. Full-scale experimental results for each wall system were fitted to equations for computing water entry from the pressure difference across the walls and the water spray rates. These equations were used to determine the hourly quantity of water to inject into the stud cavity of the hygIRC model. The general form is shown by equation (4).
Hourly water entry rate in the stud cavity (Q) = Hourly rainload on the wall (Rw) (from Eq. (3)) * f (∆Pwall) (4)
Rw did not vary from wall to wall, but rather varied with the weather records selected for the location of interest (e.g. Ottawa, wet year, hour No. 104 of the year, rainfall of 0.25 mm with an average wind speed of 11 km/hr). The pressure differential factor (called proportionality factor or dQ/dRw) in the following
equations captured the specific features of each wall system, as the empirical function varied for each wall system investigated. The four functions developed are presented below.
Stucco-clad walls: dQ/dRw= 0.0314 + 7.74 x 10⁻⁵ • ∆Pwall - 8.14 x 10⁻⁸ • (∆Pwall)2 (5a)
EIFS-clad walls: dQ/dRw= 0.0418 + 0.0243•∆Pwall / (110.3359 + ∆Pwall) (5b)
Masonry-clad walls: dQ/dRw= 0.0115 + 1.722 x 10⁻⁴ • ∆Pwall - 1.47 1x 10⁻⁷ • (∆Pwall)2 (5c)
Hardboard and vinyl siding-clad walls:
dQ/dRw= 0.0422 + 1.618E-5•∆Pwall – 3.88E-8(∆Pwall)2 + 1.115E-10(∆Pwall)3 (5d)
These equations are represented graphically in Figure 1.9. This figure shows that the proportionality factor between the spray rate (L/m2-hr) and the rate of water entry into the stud space (L/hr) increased with the pressure difference for all four wall systems. At a zero pressure difference water entry through a deficiency was due to gravity and surface tension effects, accounting for more than half of the maximum water entry -or about 3 to 4 percent of the water deposited on the cladding- for all but masonry cladding (about 1 percent of the water deposited on the cladding).
0.00 0.01 0.02 0.03 0.04 0.05 0.06 0.07 0 50 100 150 200 250 300 = F n(P) , L/ (L/ m ^2 ) stucco EIFS masonry siding dQ /d Rp d Q /dRw
For every hour of simulation, the moisture load that was injected into the reference wall of the parametric study was calculated in the following manner:
• The rate of water deposited on the cladding, Rw, was estimated as described in section 1.5.2. • The proportionality factor was calculated as follows:
1- Convert wind speed into static pressure.
Wind speed from hourly weather records for the location and year of interest was obtained and converted to a corresponding static pressure difference. The following equation was used for the conversion:
∆P = 1/2 ρ v2 where ρ is the density of air and v is the velocity of the wind at the point of
interest. For example a wind speed of 52 km/hr translated into a static pressure of about 47 Pa.
2- Calculate dQ/dRw, using the appropriate equation (5) derived from DWTF experiments.
• The hourly moisture load, in L per hour, to be injected into the stud cavity was obtained by multiplying the rate of water deposition on the cladding, Rw, by the proportionality factor, which was a function of the average wind speed for that hour.
These calculations were carried out every hour of the simulation period, as the moisture loads injected into the stud cavity varied for every hour. The whole set is referred to in Chapter 2-5 as a 1Q set of hourly moisture loads in the stud cavity. A ½ Q set of moisture loads is simply half the 1Q set of loads. Figure 1.10 provides an example of the hourly moisture loads injected in the stud cavity of a masonry-clad walls in Wilmington NC over two years of simulation.
Figure 1.10 Hourly rates of water entry “injected” in the stud cavity (referred to as “1Q”) of masonry-clad reference wall for Wilmington NC for two years of hygIRC simulation. Note that 732 hours is equivalent to 30.5 days
1.6 Prediction of Wall Hygrothermal Response to Moisture Loading
The next step in the MEWS method was to predict the hygrothermal response of a wall subjected to moisture loading. This was done using IRC’s hygIRC mathematical model.
1.6.1 Using IRC hygIRC Mathematical Model
The ideal method for evaluating the long-term response of walls to moisture loading would be to build test specimens and monitor their long-term performance in-situ. For a project with the scope of MEWS this was not a practical approach. The approach chosen was to design a parametric study with reliable input data and an experimentally validated mathematical modelling to simulate the moisture response of the selected wall systems.
There are a number of mathematical models that numerically solve the combined heat, air and moisture transport equations. The model used in the MEWS project is hygIRC. Several publications are now availablex,xi,xii that document, in detail, the formulation of the combined heat, air and moisture transport equations used in hygIRC and the techniques used to solve those equations. The model was validated through a series of mid-scale, and large scale drying experiments which formed part of Task Group 6xiii. The model accommodates many advanced features, to name a few:
- transient heat, air and moisture (liquid and vapour) transport through building assemblies,
- 2 -dimensional spatial formulation,
- material properties that vary with moisture content and temperature,
- air flow through building materials and openings,
- effect of solar radiation,
- presence of moisture source inside the material,
- freeze-thaw effect.
The effective use of advanced numerical tools demands the proper physical understanding of the problem, reliable input data and the ability to judiciously interpret the results. Some features of the wall system lie outside the current capabilities of hygIRC:
- flow of “free water” on materials surfaces and between components is not simulated, e.g. water draining down the face of a material
- water flow path through a deficiency will vary among constructions, and as already explained, they are not modelled, i.e. water needs to be “injected” at a selected location
- variations in vertical cross-section, e.g. through studs, are not modelled (hygIRC is a 2-dimensional model).
Other features could have been modelled, but were not, in general to keep the complexity of the simulations within practical limits for both execution and analysis. The scope of the project did not allow the investigation of everything of interest, or to pursue specific investigations. The main objective was to
determine the effects on temperature and moisture distributions with time and position within the wall, in response to systematic variations in the parameters selected for study:
- Air leakage was not one of the parameters chosen for systematic study. Air leakage through
accidental openings (in joints between materials such as in the air barrier as well as at deficiencies leading from the exterior into the stud space) was not, in general, modelled. Only two simulation runs ("reference" walls for Ottawa and Seattle) were done for certain wall systems, to get some sense of the magnitude of the effect.
1.6.2 A Parametric Study
Wall cladding systems and materials, and the moisture loadings they experience, can be described by a set of variables, or parameters. The hygIRC parametric study required these variables as inputs for the set of simulations for the prediction of the wall hygrothermal response to environmental loading. As mentioned in the previous paragraphs, the point of the study was to gain insight into the effects of varying the parameters on the wall response. Then, as part of the MEWS method, simulations by hygIRC permitted users to get the relative responses of specific wall systems to the moisture loads characteristic of different locations in North America. The ultimate goal was to assist in the development of guidelines that will help designers and builders to improve wall performance and durability.
Unless otherwise indicated, the basic assumptions for the MEWS parametric study are given below. The chapters on the specific wall cladding systems document any changes to or additional assumptions.
- The duration of the simulation was two years, after a year of “conditioning” to a wet year. The first year of the simulation was a “wet” year, and the second year of the simulation was an “average” year as defined by Task Group 4.
- The initial moisture contents in all porous materials were determined by assuming 50% RH in the adjacent air layers.
- Water entry through deficiencies occurred in the first and second years for all the simulations but the "base-case" simulations, which had no deficiency in the walls.
- The interior climate conditions used are described in section 1.2.6.
- The hygrothermal response of the wall assembly was sampled every ten days at a selected region of the wall.
The general approach used in the MEWS parametric study was to vary four basic parameters: the climate, the wall cladding systems, the materials used in the assembly and the amount of accidental water entry into the wall assembly.
Climate
Exterior climate was one of the more influential parameters in the study. The seven locations (Wilmington NC, Seattle, Ottawa, Winnipeg, Phoenix, Fresno and San Diego) represented a sampling of the full range of climate variation throughout North America, and they were selected from a candidate list of more than 40 locations ranked according to a Moisture Index, MI. Recall from Section 1.3.4 that, unlike the version of MI used to prepare the provisional map, the MI used to select locations for parametric study took into account that each location usually had a predominant direction for wind-driven rain.
Reference years were selected for each of the seven locations on the basis of predominant wind-driven rain direction and wall orientation was set accordingly. Amounts of wind-driven rain from directions not at right angles to the wall were reduced in proportion to the cosine of the angle between the wind and the wall, eliminating wetting completely for angles from 90 to 270 degrees.
For the calculation of water entry through deficiencies into the stud cavity (Q), however, the wall was assumed to be always normal to the wind direction. This tended to result in higher moisture loads into the stud cavity than in the case where only moisture loads from certain wind directions were injected into the stud cavity. Q was then used as a variable parameter and was varied from 1Q to ¼ Q and ½ Q for locations of moderate and high external moisture loads and to 2Q and 4Q for locations with low moisture loads. Supplementary simulations (not reported on in detail) were done with the lower directional driving rain amounts and these closely agreed with the extended simulations at Q/2 and Q/4 (see section 1.7.4 for further details).
Wall Cladding Systems and Materials
Four wall systems were simulated: stucco-clad, EIFS-clad, siding-clad and brick veneer-clad. For each of the wall types the materials used in construction were varied. Details for each of the specific wall systems are given in the chapter dealing with the respective wall type.