Publisher’s version / Version de l'éditeur:
Vous avez des questions? Nous pouvons vous aider. Pour communiquer directement avec un auteur, consultez la première page de la revue dans laquelle son article a été publié afin de trouver ses coordonnées. Si vous n’arrivez Questions? Contact the NRC Publications Archive team at
[email protected]. If you wish to email the authors directly, please see the first page of the publication for their contact information.
https://publications-cnrc.canada.ca/fra/droits
L’accès à ce site Web et l’utilisation de son contenu sont assujettis aux conditions présentées dans le site LISEZ CES CONDITIONS ATTENTIVEMENT AVANT D’UTILISER CE SITE WEB.
Journal of the Acoustical Society of America, 83, 6, pp. 2255-2260, 1988-06
READ THESE TERMS AND CONDITIONS CAREFULLY BEFORE USING THIS WEBSITE.
https://nrc-publications.canada.ca/eng/copyright
NRC Publications Archive Record / Notice des Archives des publications du CNRC :
https://nrc-publications.canada.ca/eng/view/object/?id=6540a731-dcca-4bd1-b829-041e62f89874 https://publications-cnrc.canada.ca/fra/voir/objet/?id=6540a731-dcca-4bd1-b829-041e62f89874
NRC Publications Archive
Archives des publications du CNRC
This publication could be one of several versions: author’s original, accepted manuscript or the publisher’s version. / La version de cette publication peut être l’une des suivantes : la version prépublication de l’auteur, la version acceptée du manuscrit ou la version de l’éditeur.
Access and use of this website and the material on it are subject to the Terms and Conditions set forth at
Further experimental studies on the transfer-function technique for
impedance tube measurements
Ser
TH1
M2
1dNational Research
Conseil national
no. 1561
*I
Council Canada
de recherches Canada
c. 2 I
BLDG
Institute for
lnstitut de
Research in
recherche en
Construction
construction
Further Experimental Studies on the
Transfer- Function Technique for
Impedance Tube Measurements
by
W.T.
Chu
Reprinted from
The Journal of the Acoustical Society of America
Vol. 83, No. 6, June 1988
B ~ Z A ~ V Z
:rS'p. 2255
-
2260
(IRC Paper No. 1561)
NRC
-
ClSTIL I B R A R Y
Des mesures plus perfectionnees des coefficients de rtflexion complexes prise B l'aide d'une excitation monofrtquence et d'un amplificateur de blocage pour l'analyse des donnCes ont peimis de deceler une faiblesse de la technique de fonction de transfert il deux microphones pour les mesures par tube B impkdance. Une position unique des microphones pour toutes les Mauences, c o m e le recommande la norme actuelle ASTM
~1050-86, cobpromet la prkision des mesures. Pour obtenir des mesures exactes, l'un des microphones doit se trouver B un noeud de pression du diagramme d'ondes stationnaires, de prkfkrence au premier noeud. La position de I'autre microphone ne semble pas constituer un facteur critique tant que l'intervalle entre les deux positions ne s'approche pas de la demi-longueur d'onde. La mCthode retenue pour cette ttude utilise l'khantillonnage dquentiel avec un seul microphone plut6t que l'kchantillonnage simultank avec deux microphones. Cette mtthode est plus avantageuse que les mtthodes standard
Further experimental studies on the transfer-function technique for
impedance tube measurements
W.T. Chu
AcousticsSection, Institutefor Research in Construction, National Research Councilof Canada, Ottawa, Ontario KIA OR6. Canada
(Received 12 March 1987; accepted for publication 8 February 1988 )
More refined measurements of the complex reflection coefficients using single-frequency excitation and a lock-in amplifier for data analysis have revealed a limitation in the two- microphone transfer function technique for impedance tube measurements. A fixed choice of microphone positions for all frequencies as suggested by the current standard ASTM E1050-86 will compromise the accuracy of measurements. For accurate measurements, one of the microphone positions has to be close to a minimum pressure point of the standing-wave pattern, preferably the first minimum point. The choice of the other microphone position does not seem to be critical as long as the separation of the two positions is not close to a half- wavelength. The procedure employed in this study uses sequential sampling with one microphone instead of simultaneous sampling with two microphones. It presents a technique that is better than the existing standard methods for impedance tube measurements.
PACS numbers: 43.55.Ev, 43.85.Bh
INTRODUCTION also, the necessity of using different microphone positions
The two-microphone transfer function method for ab- sorption and impedance measurements, introduced by Sey- bert and Ross' and further developed by Chung and Blaser,* has now been standardized by the American Society for Testing Materials E1050-86.3 Recently, Fahy? Chu,' and Pope6 have demonstrated the possibility of implementing the method with a single microphone, thereby eliminating any error associated with the phase mismatch problem. Al- though this technique is much faster than the conventional standing wave ratio (SWR) method, results presented by Fahy4 and ChuS showed that it is not as precise as the SWR method and that a single choice of the microphone positions is not sufficient to cover a broad frequency range. Using numerical simulation, Boden and Abom7 have shown that the two-microphone transfer function method will have its lowest sensitivity to errors in input data if the microphones are separated by about a quarter wavelength, indicating,
for different frequencies. In order to establish some guide- lines for the proper choice of the microphone positions and to determine the precision that can be obtained by the two- microphone transfer function method, some refined mea- surements have been performed using single-frequency exci- tation and a lock-in amplifier for the determination of the transfer function. The procedure and results are reported in this article.
I. APPARATUS AND TEST PROCEDURE
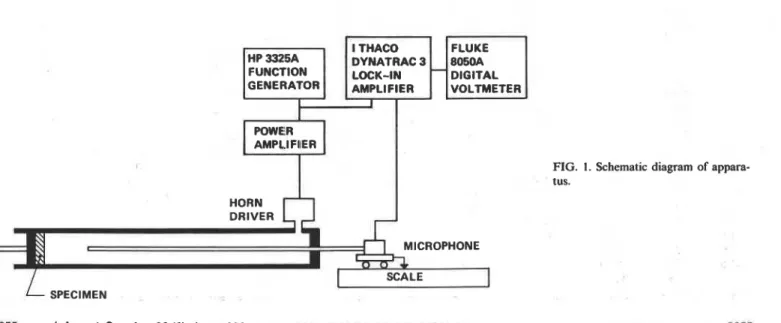
Figure 1 shows a schematic diagram of the apparatus used in this investigation. The impedance tube is a 107-cm- long brass tube with an internal diameter of 5.72 cm. The tube was driven by a horn driver mounted on the side to allow a probe-tube microphone to traverse the center line. The microphone used was a 6.4-mm (1/4-in.) model MK
601R pendant microphone supplied by Metrosonic Inc. An
FIG. 1. Schematic diagram of appara- tus.
L !
- SPECIMEN
I I
phone locations,
f
is the frequency, k is the wavenumber, a is the attenuation constant, s is the microphone separation, and L is the distance bf microphone No. 1 from the suface of the specimen. The attenuation constant a and the acoustical cen- ter of the probe-tube microphone were also determined ac- cording to the procedures in Ref. 8. The wavenumber k was computed from the speed of sound that was calculated using the room temperature measured during the experiment.Four different absorptive specimens were used in this investigation. These were chosen to represent typically the material often tested in an impedance tube. For each sample, the transfer function between the driving signal and the mi-
FIG. 2. Approximate locations of microph&e No. l along the standing-
wave pattern. crophone signal was measured for about 20 microphone po-
sitions at a few chosen frequencies. From these results, dif-
HP 3325A function generator was used to provide a very stable sine wave for the experiment.
The procedure used is similar to the single microphone technique of Ref. 5 except that the transfer function between the driving signal and the individual microphone signal was measured with an Ithaco Dynatrac 3 lock-in amplifier that has very good output stability. Using a four-digit digital volt- meter to measure the output of the lock-in amplifier, the system can provide an 80-dB dynamic range for the ampli- tude and 0.1-deg resolution for the phase measurements. The complex reflection coefficient R of a specimen located at one end of the impedance tube is computed from the follow- ing equation5:
ferent pairs of microphone positions could be selected for the computation of the complex reflection coefficients of each specimen at the chosen frequencies using Eq. ( 1 ) to show the effect of the choice of the microphone positions.
For comparison purposes, the complex reflection coeffi- cients of these specimens were also measured by an im- proved version of the standard SWR method9 under identi- cal conditions and using the same apparatus. Although there are also uncertainty and measurement errors associated with the SWR method,'' it is still considered to be a simple meth- od that can provide results with great precision. The im- proved procedure is essentially an iterating scheme based on the exact plane-wave analysis of the standing-wave pattern in the tube including the tube attenuation (see the Appen- dix).
II. SPECIMEN DESCRIPTION
[ & i k + a )
-
H ( f, ] ) e Z L ( i k+
a )1 2 , ( 1 The first specimen used was the hard reflecting surface
where HI, is the acoustic transfer function for the two micro- surface of a 1.27-cm-thick Bakelite disk. It was chosen as a
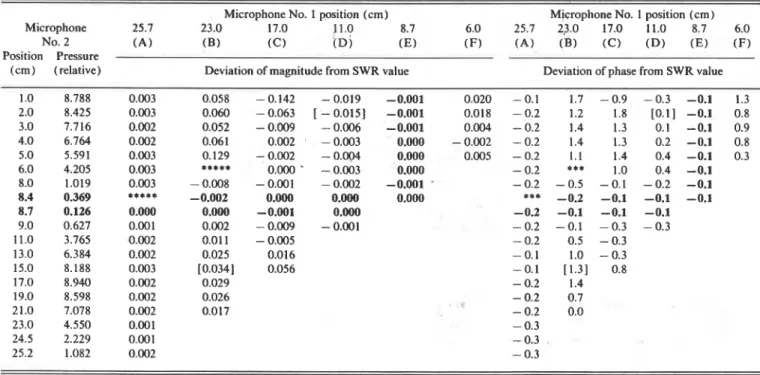
TABLE I. Deviation from SWR results for magnitude and phase of the complex reflection coefficient of a hard reflecting surface. SWR magnitude
IR I = 1.001 and phase #(deg) = 0.4; frequency = 1000 Hz. Values in bold type indicate microphone near pressure minimum.
Microphone No. 1 position (cm) Microphone No. 1 position (cm)
Microphone 25.7 23.0 17.0 11.0 8.7 6.0 25.7 23.0 17.0 11.0 8.7 6.0
NO. 2 ( A ) ( B ) ( c )
r ~ i
( E ) ( F ) ( A ) ( B ) (c) ( D ) ( E ) ( F ) Position PressureTABLE 11. Deviation from SWR results for magnitude and phase of the complex reflection coeficient of a hard reflecting surface. SWR magnitude
IR I = 1.002 and phase #(deg) = 0.2; frequency = 500 Hz. Values in bold type indicate microphone near pressure minimum.
Microphone No. 1 position (cm) Microphone No. 1 position (cm) Microphone 51.3 47.5 35.0 25.0 17.5 10.0 51.3 47.5 35.0 25.0 17.5 10.0
No. 2 ( A ) (B) (C) ( D ) (E) ( F ) ( A ) (B) ( 0 ( D ) (El ( F ) Position Pressure
(cm) (relative) Deviation of magnitude from SWR value Deviation of phase from SWR value
3.0 8.769 - 0.001 0.013 0.180 0.036 -0.001 0.044 0.2 1.8 - 0.6 0.1 0.0 2.7 5.0 8.211 - 0.001 0.009 0.118 0.038 0.000 0.042 0.2 1.8 0.8 0.4 0.0 2.8 7.5 7.141 - 0.002 - 0.001 0.094 [0.041] 0.000 0.029 0.2 1.6 1.5 [0.8] 0.1 3.0 10.0 5.708 - 0.002 - 0.011 0.069 0.039 0.001 0.1 1.0 2.1 1.2 0.1 12.5 3.892 - 0.002 ***** 0.039 0.028 0.000 0.1 *** 1.2 0.9 0.1 15.0 1.866 - 0.002 0.000 0.014 0.014 0.000 0.1 - 0.7 0.4 0.4 0.1 17.0 0.179 ***** -0.001 0.000 0.000 -0.001 *** -0.1 0.0 0.0 0.0 17.5 0.235 0.000 0.000 -0.002 -0.002 0.1 0.1 0.0 0.0 20.0 2.317 0.000 0.006 - 0.007 - 0.016 0.2 0.4 - 0.3 - 0.6 25.0 5.931 0.001 0.022 0.01 1 0.2 1.1 0.2 30.0 8.296 0.001 [0.033] 0.058 0.3 [1.7] 2.3 35.0 9.094 0.000 0.028 0.2 1.6 40.0 8.093 - 0.001 0.014 0.1 1 .O 42.5 6.852 - 0.001 0.014 0.1 1.2 45.0 5.279 - 0.001 0.013 0.1 1.5 47.5 3.458 - 0.001 0.1 50.0 1.385 - 0.001 0.1
calibrating device for the experiment since its reflection coef- ficient is known to be real and equal to 1. The second speci- men used was a 4.9-cm-thick open cell plastic foam with a fairl) uniform surface. The third specimen used was a modi- fication of the second sample. The modification involved taping the first and third quadrant of the circular surface with masking tape to provide a nonuniform absorptive sur- face. The fourth specimen used was a resonant absorber con- sisting of a 0.8-mm-thick perforated plate backed by a 3.5- cm air space. The plate has three 0.32-cm-diam holes giving the system a resonant frequency of about 500 Hz.
Ill. RESULTS AND DISCUSSIONS
From each set of the results taken for about 20 micro- phone positions, six were picked for the No. 1 microphone position to give a fair representation of locations along the standing-wave pattern ( A to F in Fig. 2). For each chosen position of microphone No. 1, the complex reflection coeffi- cients were computed for all the possible choices of the No. 2 microphone position from the set. Some typical results are presented in Table I-V for the different specimens.
In these tables, the positions of microphone No. 2 are shown in the first column. The magnitudes of the corre-
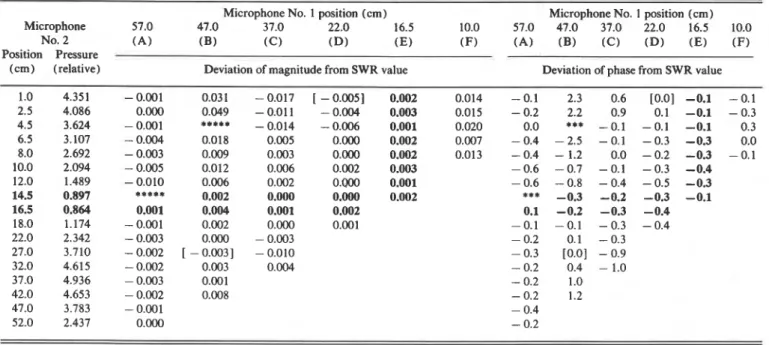
TABLE 111. Deviation from SWR results for magnitude and phase of the complex reflection coefficient of a 4.9-cm-thick plastic foam. SWR magnitude IR
1
= 0.724 and phase #(deg) = - 49.2; frequency = 400 Hz. Values in bold type indicate microphone near pressure minimum.Microphone No. 1 position (an) Microphone No. 1 position (cm) Microphone 57.0 47.0 37.0 22.0 16.5 10.0 57.0 47.0 37.0 22.0 16.5 10.0
No. 2 ( A ) (B) (C) ( D l (E) (F) ( A ) (B) (C) ( D l (El (F) Position Pressure
(cm) (relative) Deviation of magnitude from SWR value Deviation of phase from SWR value
1.0 4.351 - 0.001 0.031 - 0.017 [ - 0.005] 0.002 0.014 - 0.1 2.3 0.6 [O.O] -0.1 - 0.1 2.5 4.086 0.000 0.049 - 0.01 1 - 0.004 0.003 0.015 - 0.2 2.2 0.9 0.1 -0.1 - 0.3 4.5 3.624 - 0,001 ***** - 0.014 - 0.006 0.001 0.020 0.0 *** - 0.1 - 0.1 -0.1 0.3 6.5 3.107 - 0.004 0.018 0.005 0.000 0.002 0.007 -0.4 - 2.5 - 0.1 -0.3 -0.3 0.0 8.0 2.692 - 0.003 0.009 0.003 0.000 0.002 0.013 - 0.4 - 1.2 0.0 - 0.2 -0.3 - 0.1 10.0 2.094 - 0.005 0.012 0.006 0.002 0.003 -0.6 -0.7 -0.1 -0.3 -0.4 12.0 1.489 - 0.010 0.006 0.002 0.000 0.001 - 0.6 - 0.8 - 0.4 - 0.5 -0.3 14.5 0.897 ***** 0.002 0.000 0.000 0.002 *** -0.3 -0.2 -0.3 -0.1 16.5 0.864 0.001 0.004 0.001 0.002 0.1 -0.2 -0.3 -0.4 18.0 1.174 -0.001 0.002 0.000 0.001 -0.1 -0.1 -0.3 -0.4 22.0 2.342 - 0.003 0.000 - 0.003 -0.2 0.1 -0.3 27.0 3.710 - 0.002 [ - 0.0031 - 0.010 - 0.3 [O.O] - 0.9 32.0 4.615 - 0.002 0.003 0.004 - 0.2 0.4 - 1.0 37.0 4.936 - 0.003 0.001 -0.2 1.0 42.0 4.653 - 0.002 0.008 -0.2 1.2 47.0 3.783 - 0.001 - 0.4 52.0 2.437 0.000 - 0.2
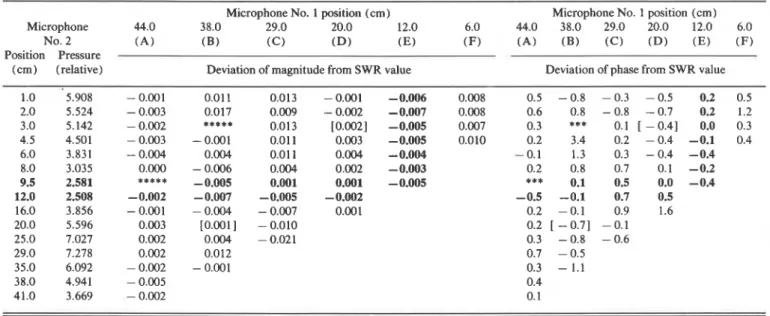
TABLE IV. Deviation from SWR results for magnitude and phase of the complex reflection coefficient of a 4.9-cm-thick plastic foam with taped surface. SWR magnitude IR
I
= 0.506 and phase d(deg) = - 65.3; frequency = 500 Hz. Values in bold type indicate microphone near pressure minimum.Microphone No. 1 position (cm) Microphone No. 1 position (cm) Microphone 44.0 38.0 29.0 20.0 12.0 6.0 44.0 38.0 29.0 20.0 12.0 6.0
No. 2 ( A ) ( B ) (C) ( D ) ( E ) (F) ( A ) ( B ) ((2) ( D ) ( E ) ( F ) Position Pressure
(cm) (relative) Deviation of magnitude from SWR value Deviation of phase from SWR value
sponding acoustical pressures at these positions are recorded in the second column to indicate the relative locations of the microphone with respect to the standing-wave pattern. Re- sults for the six chosen locations of microphone No. 1 are tabulated in columns 3 to 8 for the magnitude IR
I
and in columns 9 to 14 for the phase q5 of the reflection coefficients, omitting those cases (marked****
) where the separation of the microphone positions was approximately equal to one- half wavelength. They are presented as differences from the SWR results which are also shown in these tables. In co- lumns 4, 6, 10, and 12, values presented with the square brackets are for those cases where the microphone separa-tion was close to one-quarter wavelength. Data presented in these tables show a fairly consistent picture from which one can make the following observations.
First, when microphone No. 1 is located close to the first minimum pressure point (position E ) , both magnitude and phase of the measured reflection coefficients show little de- pendence on the position of microphone No. 2 as indicated by the results shown in columns 7 and 13 of these tables. The consistency of the results for position E shown in Tables I and I1 for the hard reflecting surface indicates that the pres- ent experimental setup is capable of resolving the magnitude and phase of the reflection coefficient to 0.001 and 0.1 deg,
TABLE V. Deviation from SWR results for magnitude and phaseof the complex reflection coefficient of a resonant absorber. SWR magnitude IR I = 0.812
and phase #(deg) = - 68.5; frequency = 400 Hz. Values in bold type indicate microphone near pressure minimum.
Microphone No. 1 position (cm) Microphone No. 1 position (cm) Microphone 54.0 44.0 34.0 24.0 15.0 9.0 54.0 44.0 34.0 24.0 15.0 9.0
No. 2 ( A ) ( B ) ( C ) ( D ) (E) ( F ) ( A ) ( B ) ( C ) ( D ) ( E ) (F)
Position Pressure
(cm) (relative) Deviation of magnitude from SWR value Deviation of phase from SWR value
1.0 1.612 - 0.006 ***** 0.006 - 0.005 -0.002 0.003 - 0.6 *** - 2.2 0.7 -0.2 0.4 2.0 1.530 - 0.004 0.084 0.006 [ - 0.0031 0.000 0.006 - 0.9 1.6 -- 0.9 [ - 0.11 -0.1 - 0.1 3.0 1.435 - 0.001 0.008 -0.001 [ -0.0061 0.000 0.011 -0.9 3.7 -0.1 [0.3] 0.0 -0.3 4.5 1.259 - 0.002 0.010 0.001 - 0.004 0.000 0.010 - 0.9 1.1 - 0.4 0.0 -0.1 - 0.2 6.0 1.075 0.000 - 0.004 - 0.003 - 0.007 -0.001 0.019 -0.9 0.5 - 0.4 0.0 0.0 0.0 7.5 0.875 -0.001 -0.002 -0.002 -0.006 -0.002 0.028 -0.9 -0.1 -0.6 -0.2 -0.1 0.9 9.0 0.674 - 0.005 0.009 0.007 0.001 0.001 -1.8 0.1 -0.3 -0.1 -0.2 10.5 0.471 ***** 0.007 0.006 0.002 0.001 *** - 0.1 - 0.3 - 0.2 -0.3 12.0 0.290 0.009 0.005 0.005 0.002 0.000 0.7 -0.3 -0.4 -0.4 -0.4 15.0 0.336 -0.005 -0.002 0.000 0.000 -0.3 -0.1 0.0 -0.2 19.0 0.860 - 0.005 - 0.005 - 0.003 0.001 - 0.5 - 0.2 0.3 - 0.3 24.0 1.465 - 0.005 [ - 0.009] - 0.010 - 0.6 [ -0.21 0.8 29.0 1.888 - 0.005 - 0.012 - 0.022 - 0.7 - 0.3 2.2 34.0 2.083 - 0.002 - 0.005 -0.8 - 1.3 \ 39.0 1.989 - 0.002 - 0.003 -0.8 -1.7 44.0 1.631 - 0.002 - 0.7 49.0 1.082 - 0.001 - 0.9
respectively. For the majority of cases mentioned here, de- viations from the SWR results are less than 1% for the mag- nitudes and less than 0.5 deg for the phase angles. Similar findings applied to the case when microphone No. 1 is locat- ed close to the second minimum pressure point (position A ) except for a slight decrease in accuracy. Results are not as accurate when microphone No. 1 is located at other posi- tions, except for the special situations when the position of microphone No. 2 is near a minimum pressure point (see corresponding rows in bold type of these tables). Thus, one can conclude that, for each particular frequency, one of the microphone positions has to be close to a minimum pressure point, preferably the first minimum point. The choice of the microphone separation is not critical as long as it is not close to one-half wavelength. These results also show that the po- sition of microphone No. 2 can be as close as l cm from the specimen for the four different types of absorptive materials tested.
Second, if the minimum pressure point criterion is not followed, the suggestion of using one-quarter wavelength for the microphone separation7 seems to be the best alternative for specimens with low and medium reflection coefficients as indicated by the results shown with square brackets in co- lumns 4, 6 , 10, and 12 of Tables I11 to V. Corresponding results shown in Tables I and I1 suggest that it does not work well for the specimen with high reflection coefficient.
Finally, the procedure used in this investigation pre- sents a good alternative approach to the transfer function technique for impedance tube measurements. Even though a longer time is required in using single frequency excitation instead of broadband excitation, the procedure used in the present experiment was about three times faster than the conventional SWR method since it eliminated the tedious work of searching for the maximum and a few minima of the standing-wave pattern. Yet, it is as accurate as the SWR method. Further improvement in speed could be achieved by interfacing the signal generator and the lock-in amplifier with a microcomputer. It is estimated that a single frequency result could be obtained in about 30 s.
IV. CONCLUSION
A set of refined measurements using single frequency excitation and a lock-in amplifier for the determination of the equivalent transfer function between microphone signals at two positions has been made. Results obtained for four representative specimens indicate that, for precise measure- ments of the reflection coefficient for the determination of the absorption and impedance by the two-microphone trans- fer function technique, one of the microphone positions has to be close to a minimum pressure point, preferably the first minimum point. No such limitation has been discussed by Boden and Abom7 and further theoretical investigation is required for its explanation. However, this is beyond the scope of the present article. The choice of the other micro- phone position is not critical as long as the microphone sepa- ration is not close to one-half wavelength. The position of microphone No. 2 can be closer than one tube diameter from the specimen.
It is conceivable that one can use a few geometries to cover the whole frequency range using broadband excitation and a digital frequency analysis system to achieve equally accurate results. However, for the extra time involved in selecting the geometries and sorting answers after the mea- surements, one might as well use single frequency excitation and pick the particular frequencies of interest.
The procedure used in this study presents a method for absorption and impedance measurements of acoustical ma- terials that is definitely better than the conventional SWR method and the two-microphone transfer function tech- nique using fixed microphone separation and broadband ex- citation.
ACKNOWLEDGMENTS
The author would like to thank Pierre Aubrey, a sum- mer student from the University of Ottawa, for his help in the experiment. This article is a contribution from the Insti- tute for Research in Construction, National Research Coun- cil of Canada.
APPENDIX: IMPROVED SWR METHOD
Consider a plane wave of pressure p i , incident on the absorptive material. The combination of the incident wave pi and the reflected wave p, produces a standing-wave pat- tern inside the tube. The magnitude of the total acoustic pressure at a distance x from the sample surface can be ex- pressed by the following equation:
IpxI = Ip+I[eZax+ IR 12e-2ax
+
21RI
cos (2kx -4)
] 'I2, (‘41)where Ip,
I
is the amplitude of the incident pressure wave, a is the attenuation coefficient whose value depends on the side wall of the tube and the gas inside it, k = 2r/A is the wavenumber, and R =I
R1
ei @ is the complex reflection coef- ficient of the sample at x = 0.The basis of the improved method is an iterating process performed on Eq. (A1 ) where the attenuation coefficient a is assumed known. The wavenumber or wavelength can be ob- tained from the frequency and the speed of sound, the latter to be determined from the room temperature. In principle, Eq. (A1 ) can be solved for the three unknowns Ip+ 1,
I
R I, and q5 if pressures at three locations are measured. This has been tried by Gatley and Cohen" with little success because of the interdependence of qb andI
RI
in their iteration proce- dure. It is recognized, however, that q5 can be estimated from the positions of any one of the pressure minima or maxima. The method is based on this fact. The relationship for the position of the pressure minimum or maximum can be ob- tained by differentiating Eq. ( A l ) and setting the results equal to zero to givesin(2kx - q5) = (a/2k IR l)(ezaX - 1R 12e-2ax). (A2) Thus, for the first pressure minimum, we have
+=
- - ~ + 2 k d + s i n - ' [ ( a / 2 k I R I)(e2ad- (R 12e-2ad)], (A31 where d is the distance from the surface of the sample to the first pressure minimum. To complete the iteration scheme,we need only one more pressure point in addition to the first minimum pressure point. The following ratio is obtained from Eq. ( A l ) :
The next step is to find values for
I
RI
and4
that satisfy Eq. (A3) and Eq. (A4) simultaneously. Since a/k is usually very small, the arcsin term in Eq. (A3) does not contribute significantly to q5 except when q5 approaches zero, and drop- ping this term provides a good first approximation for4.
Then, Eq. (A4) is solved as a quadratic equation for IR I. Only the positive root ofI
RI,
which is< 1, is used. A new
4
is then computed using the full Eq. (A3) and another value of IRI
is obtained by solving Eq. (A4) again. The iteration process is continued until IRI
and4
reach their limiting val- ues. In general, only three iterations are required to reach final results. This method will eliminate the extra process of locating the maximum pressure point.'A. F. Seybert and D. F. Ross, "Experimental determination of acoustic
properties using a two-microphone random-excitation technique," .I.
Acoust. Soc. Am. 61, 1362-1370 (1977).
'J. Y. Chung and D. A. Blaser, "Transfer function method of measuring in-
duct acoustic properties: I. Theory, 11. Experiment," J. Acoust. Soc. Am.
68,907-92 1 ( 1980).
'ASTM E1050-86, "Standard test method for impedance and absorption of acoustical materials using a tube, two microphones, and a digital frequen- cy analysis system," American Society for Testing Materials, Philadel- phia, PA, 1986.
4F. J. Fahy, "Rapid method for the measurement of sample acoustic im-
pedance in a standard wave tube," J. Sound Vib. 97, 168-170 (1984).
'W. T. Chu, "Single-microphone transfer function method for measuring
impedance and absorption in an impedance tube," Proc. 12th ICA, Tor-
onto, Canada, paper M3-4 (1986). Expanded version published in J.
Acoust. Soc. Am. 80,555-560 (1986).
Pope, "Rapid measurement of acoustic impedance using a single micro- phone in a standing wave tube," Proc. 12th ICA, Toronto, Canada, paper M3-3 (1986).
'H. Boden and M. Abom, "Influence of errors on the two-microphone
method for measuring acoustic properties in ducts," J. Acoust. Soc. Am. 79,541-549 (1986).
'ASTM C384-85, "Standard test method for impedance and absorption of acoustical materials by the impedance tube method," American Society for Testing Materials, Philadelphia, PA, 1985.
9W. T. Chu, "An improved tube method for acoustic impedance measure-
ment," Building Research Note 1 13, National Research Council of Can- ada, Division of Building Research (recently renamed Institute for Re- search in Construction) (March 1977).
'9L. Parrot and C. D. Smith, "Random and systematic measurement .
errors in acoustic impedance as determined by the transmission line meth- od," NASA Technical Note T N D-8520, December 1977.
"W. G. Gatley and R. Cohen, "Methods for evaluating the performance of small acoustic filters," J. Acoust. Soc. Am. 4 6 , 6 1 6 (1969).
T h i s p a p e r