HAL Id: hal-03157982
https://hal.archives-ouvertes.fr/hal-03157982
Submitted on 3 Mar 2021
HAL is a multi-disciplinary open access
archive for the deposit and dissemination of
sci-entific research documents, whether they are
pub-lished or not. The documents may come from
teaching and research institutions in France or
abroad, or from public or private research centers.
L’archive ouverte pluridisciplinaire HAL, est
destinée au dépôt et à la diffusion de documents
scientifiques de niveau recherche, publiés ou non,
émanant des établissements d’enseignement et de
recherche français ou étrangers, des laboratoires
publics ou privés.
management and physiological responses unveiled by 3D
subcellular imaging
Clarisse Uwizeye, Johan Decelle, Pierre-Henri Jouneau, Serena Flori, Benoit
Gallet, Jean-Baptiste Keck, Davide Dal Bo, Christine Moriscot, Claire
Seydoux, Fabien Chevalier, et al.
To cite this version:
Clarisse Uwizeye, Johan Decelle, Pierre-Henri Jouneau, Serena Flori, Benoit Gallet, et al..
Morpholog-ical bases of phytoplankton energy management and physiologMorpholog-ical responses unveiled by 3D subcellular
imaging. Nature Communications, Nature Publishing Group, 2021, 12 (1), pp.1049.
�10.1038/s41467-021-21314-0�. �hal-03157982�
Morphological bases of phytoplankton energy
management and physiological responses unveiled
by 3D subcellular imaging
Clarisse Uwizeye
1
, Johan Decelle
1
✉
, Pierre-Henri Jouneau
2
, Serena Flori
1,3
, Benoit Gallet
4
,
Jean-Baptiste Keck
5
, Davide Dal Bo
1
, Christine Moriscot
4,6
, Claire Seydoux
1
, Fabien Chevalier
1
,
Nicole L. Schieber
7
, Rachel Templin
7
, Guillaume Allorent
1
, Florence Courtois
1
, Gilles Curien
1
,
Yannick Schwab
7,8
, Guy Schoehn
4
, Samuel C. Zeeman
9
, Denis Falconet
1
✉
& Giovanni Finazzi
1
✉
Eukaryotic phytoplankton have a small global biomass but play major roles in primary
pro-duction and climate. Despite improved understanding of phytoplankton diversity and
evo-lution, we largely ignore the cellular bases of their environmental plasticity. By comparative
3D morphometric analysis across seven distant phytoplankton taxa, we observe constant
volume occupancy by the main organelles and preserved volumetric ratios between plastids
and mitochondria. We hypothesise that phytoplankton subcellular topology is modulated by
energy-management constraints. Consistent with this, shifting the diatom Phaeodactylum
from low to high light enhances photosynthesis and respiration, increases cell-volume
occupancy by mitochondria and the plastid CO
2-
fixing pyrenoid, and boosts
plastid-mitochondria contacts. Changes in organelle architectures and interactions also accompany
Nannochloropsis acclimation to different trophic lifestyles, along with respiratory and
photo-synthetic responses. By revealing evolutionarily-conserved topologies of energy-managing
organelles, and their role in phytoplankton acclimation, this work deciphers phytoplankton
responses at subcellular scales.
https://doi.org/10.1038/s41467-021-21314-0
OPEN
1Univ. Grenoble Alpes, CNRS, CEA, INRAe, IRIG-LPCV, Grenoble, France.2Univ. Grenoble Alpes, CEA, IRIG-MEM, Grenoble, France.3The Marine
Biological Association, The Laboratory, Citadel Hill Plymouth, Devon, UK.4Univ. Grenoble Alpes, CNRS, CEA, IRIG-IBS, Grenoble, France.5Univ. Grenoble Alpes, Laboratoire Jean Kuntzmann, Grenoble, France.6Univ. Grenoble Alpes, CNRS, CEA, EMBL, Integrated Structural Biology Grenoble (ISBG),
Grenoble, France.7Cell Biology and Biophysics Unit, European Molecular Biology Laboratory, Heidelberg, Germany.8Electron Microscopy Core Facility,
European Molecular Biology Laboratory, Heidelberg, Germany.9Institute of Molecular Plant Biology, Department of Biology, ETH Zurich, Zurich, Switzerland.
✉email:johan.decelle@univ-grenoble-alpes.fr;denis.falconet@cea.fr;giovanni.finazzi@cea.fr
123456789
P
hytoplankton play a critical role in supporting life on Earth.
By converting CO
2, sunlight and nutrients into biomass and
oxygen, unicellular phototrophs are responsible for about
50% of primary productivity
1. They also contribute to food webs
and to the biological CO
2pump in the oceans. Phytoplankton
members are ubiquitous in marine and freshwater ecosystems and
include prokaryotes and eukaryotes, the latter having acquired
photosynthesis capacity up to 1.5 billion years ago through
endosymbiotic events
2. Eukaryotic phytoplankton encompasses a
great diversity of lineages (e.g. diatoms, dinoflagellates,
hapto-phytes, chlorohapto-phytes, rhodophytes) with different morphologies
and sizes (from 0.8 to a few tens of microns)
3. Although our
knowledge on phytoplankton biodiversity and ecological relevance
in aquatic ecosystems has greatly improved in the recent years
(e.g. ref.
4), the cellular bases of ecological responses of these
unicellular organisms remain undetermined. Moreover, we do not
know how
flexible the phytoplankton cellular and organellar
architecture is when facing environmental changes. This is a
cri-tical aspect, as recent works have proposed that phytoplankton
physiological responses may rely on specific subcellular features
5,6.
So far, phytoplankton morphological features have been mainly
visualized by light microscopy and two-dimensional (2D) electron
microscopy studies
7–11, often associated with the assessment of
photosynthetic activity
10,12. High-throughput confocal
fluorescence
three-dimensional (3D) imaging has been developed to scan,
clas-sify and quantify phytoplankton cells collected in different oceanic
regions
13. However, optical microscopy studies have insufficient
resolution to reveal cellular ultrastructure, and 2D electron
micro-scopy by definition cannot provide a comprehensive volumetric
description of phytoplankton cells and their organelles.
Thanks to the recent development of 3D electron microscopy
methods
14–16, 3D reconstructions have been obtained to analyse
plant cell division
17, chloroplast biogenesis
18, with emphasis on
thylakoids organization
19–23and algal cell structures
24–28. Serial
block-face electron microscopy (SBEM) has been used to analyse
plant subcellular architectures
29–31. Ion-beam milling was used to
prepare thin lamella for imaging by cryo-EM
32, revealing the native
architecture of the Chlamydomonas reinhardtii chloroplast
6,33,34.
Focused ion beam scanning electron microscopy (FIB-SEM) has
been used to reveal the 3D structure of photosynthetic cells with
enough resolution (4–10 nm) to investigate their subcellular
architecture. This technique has been applied to chemically
fixed
samples in rice
35,36, Chlamydomonas
37,38, in the diatom
Phaeo-dactylum tricornutum
39,40, and to cryo-fixed and freeze
sub-stituted Phaeocystis cordata cells
41. Cryo-FIB-SEM of
high-pressure frozen marine algae such as coccolithophores
42and
dinoflagellates
43,44has also been used to study biomineralization
pathways. However, we still miss comparative studies to reveal
evolutionarily conserved topologies in eukaryotic phytoplankton
and to highlight possible links between acclimation responses and
changes in subcellular architectures.
Here, we applied a FIB-SEM-based workflow to seven
mono-clonal cultures of different eukaryotic microalgae representing
major oceanic phytoplankton lineages and/or model-laboratory
microalgae. We generate 3D reconstructions, suitable for
quanti-tative morphometric analysis (surfaces and volumes) of organelles
and subcellular structures. Comparative analysis of the different
lineages reveals preserved structural characteristics between the
different species: conserved cell-volume occupancy by the different
organelles and constant volumetric ratios in energy-producing
organelles (plastids, mitochondria). These relationships between
subcellular compartments related to energy management may
represent evolutionarily conserved features responsible for specific
physiological responses in phytoplankton. Consistent with this
idea, physiological responses of microalgae acclimated to either
different light regimes or trophic lifestyles are accompanied by
commensurate modifications in the structural features of plastids
and mitochondria, as well as in their interactions.
Results and discussion
Cellular architectures of phytoplankton. We reconstructed the
3D cellular architecture of different eukaryotic phytoplankton
representatives of ubiquitous taxa and laboratory model
organ-isms: Mammiellophyceae (Micromonas RCC 827),
Prymnesio-phyceae (Emiliania RCC 909), PelagoPrymnesio-phyceae (Pelagomonas RCC
100), Dinophyceae (Symbiodinium RCC 4014 clade A),
Cyani-diophyceae (Galdieria SAG 21.92), Bacillariophyceae
(Phaeo-dactylum Pt1 8.6), and Eustigmatophyceae (Nannochloropsis
CCMP 526) (Supplementary Table 1). Prior to FIB-SEM imaging,
culture aliquots were tested for photosynthetic capacity
(Supple-mentary Table 1) to verify their physiological status. Cells were
cryo-fixed using high-pressure freezing (to maximize preservation
of native structures) followed by slow freeze substitution and
resin embedding. FIB-SEM datasets were processed to 3D models
using open-access software (see Supplementary Fig. 1 and
methods for details). This imaging approach allows a wide range
of cell volumes to be quantified, from ca. 2 µm
3in the
mamiel-lophyceae Micromonas, to more than 200 µm
3in the
dino-flagellate Symbiodinium.
We observed both external features of microalgae (e.g. the
raphe in Phaeodactylum, the
flagellum in Micromonas, the
coccosphere in Emiliania, Fig.
1
), and the main organelles (Fig.
2
:
nucleus—blue, plastid—green and mitochondria—red). Other
cellular features were observed (grey): storage bodies in
Emiliania
42,45, carbon-rich structures in Pelagomonas
46, large
oil bodies in Nannochloropsis
47, starch sheaths surrounding the
pyrenoids in Micromonas
48and Symbiodinium, and vacuoles of
different sizes in Phaeodactylum
49, Galdieria and Micromonas
48.
Different shapes were observed for the main organelles.
Plastids were cup-shaped in Galdieria, Pelagomonas, Emiliania,
lobed in Symbiodinium, globular in Micromonas and
Nanno-chloropsis and elongated in Phaeodactylum (Fig.
2
b and Fig.
3
a).
When distinguishable, photosynthetic membranes (thylakoids)
were organized in layers of a few stacks, but lacked the clear
subdivision into stacked grana and unstacked stromal lamellae
observed in vascular plants
50. The nuclei were spherical/oval in
shape and were closely associated with the plastids via the fourth
envelope membranes in secondary plastids (i.e.
Phaeodacty-lum
40). Mitochondria were characterized by more variable shapes
not only between species but also within cells of the same species
(e.g. Supplementary Fig. 2 in the case of Emiliania). This diversity
probably reflects the dynamic nature of these organelles, which
frequently change their shape, undergo dislocations, fusion and
fission in eukaryotes
51.
Quantitative analysis indicates that plastids always occupied
the largest fraction (15–40%) of the cell (Fig.
2
c, Supplementary
Data 1) in line with recent estimates in vascular plants
29,35,
followed by the nucleus (5–15%) and the mitochondria (2.5–5%).
Altogether, these three organelle types (nuclei, plastids and
mitochondria)
filled a relatively constant fraction (40–55%) of the
total cell volume, despite significant differences in the cell
volumes of the different phytoplankton taxa (Symbiodinium e.g.
is around 100 times larger than Micromonas). Networks of
internal vesicles, the Golgi apparatus, ER, vacuoles and storage
compartments (e.g. lipid droplets, starch granules, nutrient
storage, etc) and the cytosol occupied the other half with a larger
variability in terms of their relative volume occupancy. We
interpret this conservation of the organelle volumes and the
variability of the other compartments as the signature of
evolutionary constraints that preserve essential cellular functions
(gene
expression,
energy
production
and
consumption,
compartmentation of metabolic pathways), while leaving
meta-bolic
flexibility to allow the storage of assimilated nutrients,
particularly carbon and subcellular trafficking. The only
excep-tion was Nannochloropsis, where the large accumulaexcep-tion of oil
bodies possibly reduced the cell volume available to the main
organelles (22.4 ± 4.5%, Fig.
2
, see also below).
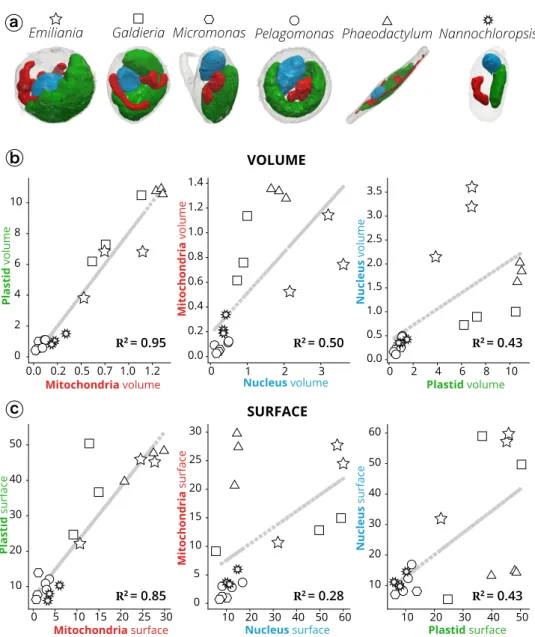
Thanks to the possibility to perform quantitative surface and
volumetric estimates, we sought relationships between the three
above mentioned organelles (Fig.
3
) in the different taxa, to
identify possible evolutionarily-preserved morphological
charac-teristics. This analysis was initially biased by the presence of
Symbiodinium (Supplementary Fig. 3). These dinoflagellate cells,
being much larger than the others, led to the clustering of data
into two groups (Symbiodinium cells on one side, all the other
cells on the other side), preventing the observation of correlation
between the other cells.
Excluding Symbiodinium from the analysis removed this bias
and unveiled the existence of a tight correlation between plastids
and mitochondria in terms of volume (the coefficient of
determination R
2, being 0.95, Fig.
3
b) and surface area ratios
(R
2= 0.85, Fig.
3
c).
No significant correlation was found between the volume/surface
ratio of the nucleus and the mitochondria or plastid (R
2≤ 0.5).
Plastid-mitochondria relationships are of primary importance in
diatoms
5,52, where interactions between the two organelles are
relevant for carbon assimilation. Based on the
findings above, it is
possible that this organelle-organelle relationship also exists in
other microalgal species.
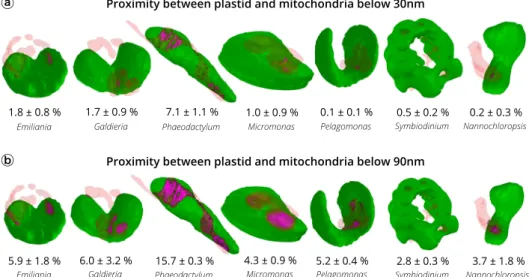
Plastid-mitochondria interactions may rely on physical
inter-actions between the two organelles
39,53. We tested this possibility
by quantifying possible contact points between plastids and
mitochondria in the different species analysed above (Fig.
4
).
Recent work based on cryo-electron tomography of cyanobacterial
cells has revealed specific contact sites between thylakoids and the
plasma membrane with a ~3 nm intermembrane space
54. Using
the same technique, ER-plasma membrane, ER-mitochondria, and
nucleus-vacuole contact sites were measured in eukaryotic cells
with intermembrane distances of ~20 nm, ~10 nm, and ~15 nm,
respectively
55,56. Based on these results, we chose a distance value
of
≤30 nm to calculate surface areas of contact between plastids
and mitochondria. We could identify contacts in Phaeodactylum
(7.1 ± 1.1% of the plastid surface being involved in contacts with
mitochondria, Fig.
4
a), in agreement with the previous
sugges-tions
5. Conversely, contacts turned out to be almost negligible in
all the other organisms, ranging from 0.1 ± 0.1 in Pelagomonas to
1.8 ± 0.8% of the plastid surface in Emiliania.
Other distance criteria have been proposed to operationally
track contact points between organelles in light microscopy
57.
Fig. 1 Cellular volume and external features of selected phytoplankton cells revealed by FIB-SEM imaging. Green branches of the phylogenetic tree of eukaryotes represent photosynthetic lineages (adapted from ref.91). A 3D scan view of cell morphology of selected phytoplankton members
(Mammiellophyceae (Micromonas RCC 827), Prymnesiophyceae (Emiliania RCC 909), Bacillariophyceae (Phaeodactylum Pt1 8.6), Pelagophyceae (Pelagomonas RCC 100), Dinophyceae (Symbiodinium RCC 4014 clade A), Cyanidiophyceae (Galdieria SAG21.92) and Eustigmatophyceae (Nannochloropsis CCMP526) is shown with a linear scale bar of 1µm and a voxel scale of 1 µm3. Specific cellular features (cell walls, the flagellum in Micromonas, the raphe in
Phaeodactylum, the coccosphere in Emiliania) are visible. For every species, three cells were reconstructed and morphometrically analysed. Data represent cell volumes ± s.d. for every species.
Fig. 2 Internal cell architecture of phytoplankton cells. a Sections through cellular 3D volumes, segmented from FIB-SEM images of whole cells of Micromonas (stack of frames in Supplementary Movie 1), Pelagomonas (Supplementary Movie 2), Nannochloropsis (Supplementary Movie 3), Galdieria (Supplementary Movie 4), Emiliania (Supplementary Movie 5), Phaeodactylum (Supplementary Movie 6) and Symbiodinium (Supplementary Movie 7). Sections are representatives micrographs of an experiment repeated three times with similar results Scale bar: 1µm. b Segmentations highlight the main subcellular compartments: green: plastids (containing thylakoids and pyrenoids—light green—in some cell types); red: mitochondria; blue: nuclei (with different intensities of staining possibly corresponding to euchromatin—light blue—heterochromatin—blue and the nucleolus—dark blue); grey: other compartments. Segmentations are representatives tomograms of an experiment repeated three times with similar results.c Volume occupancy by the different subcellular compartments in different microalgal cells. Top plot: % of cell-volume occupation; bottom plot: absolute volume sizes. Data refer to three cells ± s.d. for every species.
Distances
≤90 nm may represent an ‘upper limit’ for contacts.
Using this criterion, areas became larger in Phaeodactylum
(15.7 ± 0.3% of the plastid surface Fig.
4
b), and evident in all the
tested organisms. However, due to the quite large intermembrane
distance, areas calculated with this criterion likely represent a
proximity between plastids and mitochondria, rather than
genuine contact sites between the two organelles mediated by
protein machineries, as observed in the case of other
organelle-organelle interactions
58–60.
Subcellular features of energy-managing organelles. Besides
providing information on the topology of organelles, our 3D
images had enough resolution to explore sub-organelle features.
We exploited this possibility to investigate the possible
con-servation of structural architectures within plastids and
mito-chondria (Fig.
5
and Supplementary Fig. 4), seeking for signatures
of structural constraints related to cellular energy management.
Plastids were mostly occupied by thylakoid membranes and the
stroma, and by the carbon-fixing pyrenoid (Fig.
5
a), a
Rubisco-rich matrix that was absent in Pelagomonas
46, Galdieria
61and
Nannochloropsis
62.
In two taxa (Phaeodactylum and Emiliania), we observed
thylakoids crossing the pyrenoid matrix (Fig.
5
a). These pyrenoid
membranes (also called pyrenoid tubules in Chlamydomonas
6)
displayed different topologies: we observed parallel stacks in
the diatom (Supplementary Fig. 4) and a more branched
structure in Emiliania, reminiscent of that recently reported in
Chlamydomonas
6,63. Micromonas and Symbiodinium contained
thylakoid-free pyrenoids that were almost completely surrounded
by starch sheaths (Fig.
5
a). Few stalks ensure the connection
between pyrenoid and the plastid, possibly to facilitate the
diffusion of Rubisco substrates and products as previously
proposed
6,64,65, see also the review
66. Unlike Micromonas, the
pyrenoid of the dinoflagellate Symbiodinium was not centred in
the plastid, but instead protruded towards the cytosol, being
surrounded by a shell of cytosolic rather than stromal starch
66–68.
Fig. 3 Morphometric analysis of phytoplankton members. a 3D topology of the main organelles (green: plastids; red: mitochondria; blue: nuclei) in the different cell types.b Volume relationships in different subcellular compartments, as derived from quantitative analysis of microalgal 3D models. c Surface relationships in different subcellular compartments, as derived from quantitative analysis of microalgal 3D models. Three cells were considered for every taxum. Stars: Emiliania; squares: Galdieria; hexagons: Micromonas; circles: Pelagomonas; triangles: Phaeodactylum; suns: Nannochloropsis. Symbiodinium cells were not considered in this analysis, because their size, which largely exceeds the other (Supplementary Fig. 3), prevents a meaningful analysis of the volume/surface relationships.
Despite the differences in the pyrenoid topology, the ratio of
pyrenoid/plastid volumes was preserved in three out of the four
microalgae lineages where this compartment was present (7.1 ±
1.2%, 9.3 ± 1.4%, 7.2 ± 1.2% for Phaeodactylum, Emiliania,
Micromonas, respectively, Fig.
5
a and Supplementary Dataset 1).
This constant ratio highlights the importance of maintaining a
proper balance between the subcompartments performing light
harvesting (the photosynthetic membranes) and CO
2fixation (the
pyrenoid). An exception to this observation is Symbiodinium,
where the pyrenoid occupies a much lower fraction of the plastid
volume (2.8 ± 0.2%). Our quantitative morphometric analysis
provides a possible rationale for this difference. We found that
the pyrenoid surface/volume ratio (an important parameter for
gas exchange in this compartment, and therefore for CO
2assimilation) is 3–5 time higher in Phaeodactylum, Emiliania,
Micromonas (20.6 ± 6, 12.3 ± 2.6 and 15.1 ± 2.4, respectively) than
in the dinoflagellate (4.7 ± 2.3). A much lower surface to volume
ratio may represent a functional constraint for carbon
assimila-tion. Therefore, we propose that the large increase in the plastid
volume of Symbiodinium (63.5 ± 9.5 µm
3when compared to
11.0 ± 0.3 µm
3, 5.9 ± 1.8 µm
3and 0.5 ± 0.2 µm
3, in
Phaeodacty-lum, Emiliania and Micromonas respectively, see also
Supple-mentary Data 1) cannot be followed by a commensurate
expansion of the pyrenoid volume (1.8 ± 0.3 µm
3vs 0. 8 ± 0.1,
0.5 ± 0.2 and 0.05 ± 0.03 µm
3, respectively), to avoid an excessive
decrease of the pyrenoid surface/volume ratio in this alga.
Overall, our volumetric analysis of the pyrenoid suggests that
both the surface to volume ratio and the volumetric ratio between
Fig. 4 Proximity between plastids and mitochondria in different phytoplankton members. Green: plastid surface. Red: mitochondria surface. Magenta: proximity surface (i.e. points at a distance≤30 nm (panel a) or ≤90 nm (panel b) between mitochondria and plastids. Data refer to three cells ± s.d. for every species.Fig. 5 Architecture of the mitochondria and plastids of different phytoplankton taxa. a Topology of the plastid. Whole plastid images and focus on the CO2-fixing compartment (pyrenoid) topology in Emiliania, Phaeodactylum, Micromonas and Symbiodinium cells. The 3D reconstruction displays the thylakoid
network (dark green) crossing the pyrenoid matrix (light green). If present (Micromonas and Symbiodinium), a starch layer surrounding the pyrenoid is shown in grey. The histogram recapitulates volume occupancy by sub-plastidial structures (thylakoids, matrix, starch, pyrenoid). Note that starch is cytosolic in Symbiodinium, and therefore its volume is not considered in the graph.b Topology of mitochondrial compartments. Red: mitochondrial matrix; yellow: cristae. The histogram recapitulates volume occupancy by mitochondrial subcompartments (in the matrix and within the cristae). See Supplementary Fig. 4 for sections through plastids and mitochondria.
the plastid and the pyrenoid are important parameters for the
photosynthetic metabolism. This concept of constant volumetric
ratios within energy-producing organelles is corroborated by our
analysis of mitochondria. In these organelles, we found that the
ratio between the volume of the cristae and the matrix (Fig.
5
b) is
relatively constant in these cells (11.6 ± 2.8%, 14.2 ± 2.6%, 14.5 ±
2.9%, 10.1 ± 5.9% in Phaeodactylum, Pelagomonas, Emiliania and
Micromonas, respectively), despite differences in the shape (Fig.
3
a
and Supplementary Fig. 2) and overall volumes of their
mitochondria (Fig.
2
c).
Microalgal subcellular architectures and physiological
respon-ses. The
finding that plastid-mitochondria interactions and
sub-organelle volume partitioning are relatively well conserved features
of phytoplankton suggests that these subcellular features could
have been evolutionarily-selected to ensure proper microalgal
fitness. To test this hypothesis, we looked at possible modifications
in the above-mentioned parameters upon exposing microalgae of
a given species to changing environmental conditions. For these
experiments, we concentrated on laboratory model algae
(Phaeo-dactylum and Nannochloropsis), which can easily be grown in
different conditions.
We
first focused on Phaeodactylum cells under different light
intensities, i.e. a type of environmental modification that is often
experienced by diatoms
69in their natural milieu. Cells exposed
to low light (LL: 40 µmol photons m
−2s
−1) or high light (HL:
350 µmol photons m
−2s
−1) led to modification of both
respiratory and photosynthetic performances (Fig.
6
), in line with
previous reports
5. Comparative analysis of 3D models of cells from
LL and HL conditions (Fig.
6
a) revealed substantial changes in the
morphology of the cells at the level of plastid and mitochondria.
The volume occupied by mitochondria showed an almost
two-fold increase in HL (from 3.9 ± 0.2 to 6.6 ± 0.7% Fig.
6
b),
consistent with the enhanced respiratory activity. Conversely,
the overall plastid volume reduced slightly from 33.7 ± 1.8 to
24.7 ± 6.7%. This reduction (already reported in the case of
Phaeocystis antarctica
24) was not accompanied by changes in the
pyrenoid volume (2.4 ± 0.6 vs 3.2 ± 0.9% of the cell volume)
leading to an almost two-fold augmentation of the pyrenoid
occupancy in the plastid (from 7.0 ± 1.3 to 13.2 ± 2.5%), at the
expense of the thylakoids plus the stroma (Fig.
6
b). This increase
likely accounts for the augmented photosynthetic activity (from
37 ± 10 nmol O
2mL
−1min
−1to 59 ± 5 nmol O
2mL
−1min
−1)
observed between LL and HL acclimated cells (Fig.
6
c). Indeed,
photon capture by the thylakoids in HL no longer limits the
photosynthetic
flux, which is, instead, set by the turnover of the
carbon
assimilating
enzymes.
The
finding that
plastid-mitochondrial proximity increased between HL and LL cells
(+36 ± 14% at ≤30 nm and +25 ± 7% at ≤90 nm, Fig.
6
d) also
provides a possible rationale for the enhanced photosynthesis
observed in HL cells. Indeed, previous work showed that organelle
interactions are an advantage for carbon assimilation in diatoms,
to facilitate energetic interactions between the two cell engines
5.
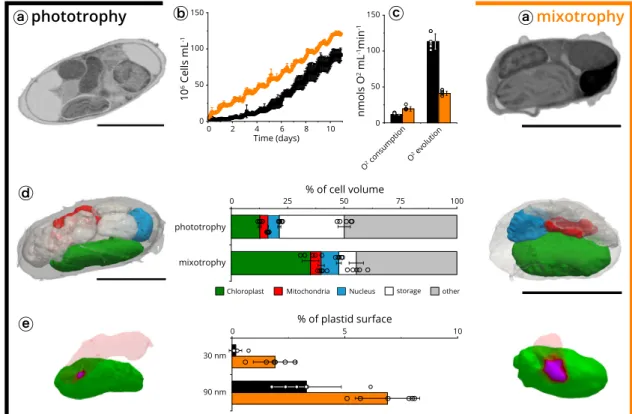
Next, we compared the physiology and subcellular features of
Nannochloropsis cells exposed to two trophic conditions. Previous
studies highlighted the ability of this alga to metabolize external
carbon sources under photosynthetic conditions (mixotrophy) to
improve growth
70–72. We reproduced the reported growth
enhancement when cells were shifted from phototrophy (without
Fig. 6 Structural analysis of light acclimation in Phaeodactylum tricornutum. a Cells were imaged at two different light regimes: LL (40 µmol photons m−2s−1, left) and HL (350µmol photons m−2s−1, right). Scale bar: 1µm. b Volume occupancy by the plastids (dark green), mitochondria (red) and pyrenoid (light green) in the two conditions. Data refer to three cells ± s.d. for each growth condition.c Respiratory activities (red) and photosynthetic capacities (green) are indicated for LL (left) and HL (right) cells. Data refer to three biological samples ± s.d. for each growth condition.d Plastid-mitochondria proximity surface points in LL and HL cells, measured at≤30 nm (grey) and ≤90 nm (black). At both distances, proximity areas points are increased by around 25% (blue) upon HL transition. Data refer to three cells ± s.d. for each growth condition.
organic carbon) to a carbon-rich medium
73, and found that
changes in the trophic lifestyle of this alga were also accompanied
by substantial physiological and morphological changes (Fig.
7
a). In
particular, growing algae in mixotrophy enhanced their respiratory
capacity (from 11.5 ± 0.8 to 18.9 ± 2.9 nmol O
2mL
−1min
−1,
Fig.
7
c) while decreasing their photosynthetic activity (from 113.2 ±
11.1 nmol O
2mL
−1min
−1to 41.0 ± 3.2 nmol O
2mL
−1min
−1,
Fig.
7
c). These changes were accompanied by a modification in
the cell organization. Phototrophic cells were largely
filled with
reserve vesicles (28.7 ± 2.9% of the cell volume), thereby reducing
the volume left to the organelles (21.3 ± 0.2%). The bulkiness of
reserve vesicles was reduced in mixotrophic cell (7.8 ± 3.4%), in
which the volume occupied by organelles (Fig.
7
d) recovered a value
(47.7 ± 1.1%) similar to the one observed in other algae in
phototrophic conditions (Fig.
2
). This reduced storage capacity in
mixotrophic cells may stem from a higher consumption of lipid
reserves
73, caused by the less favourable balance between
photo-synthesis—which produces reserves and respiration—which
con-sumes them.
Plastid-mitochondria proximity increased in cells acclimated to
mixotrophy (Fig.
7
e). The effect was substantial when calculated
using an organelle distance of
≤30 nm (from 0.16 ± 0.25 to 1.8 ±
0.7) and still significant (two-fold) at ≤90 nm (from 3.3 ± 1.5 to
6.9 ± 1.2). Although the proximity surface between the organelles
is small, its increase could be relevant in the frame of the observed
physiological changes. Plastid-mitochondria proximity may
facilitate energy exchanges between the organelles in
Nanno-chloropsis, to readjust the balance between the two cell organelles
according to the environmental conditions. Alternatively,
proxi-mity could mediate lipid exchange between plastids and
mitochondria
53, contributing to the structural changes observed
between the two trophic conditions.
By optimizing sample preparation, image acquisition,
segmen-tation and 3D reconstruction, for a quantitative FIB-SEM
tomography workflow, we have demonstrated that 3D whole-cell
models can be efficiently created, providing a unique resource to
quantitatively compare cellular morphological features. Our
analysis of phytoplankton pinpoints conserved features
(cell-volume fractions occupied by the main organelles,
plastid-mitochondria proximity) and highlights the existence of constant
surface/volumetric ratios within the energy-producing organelles,
exemplified by the surface to volume ratio in mitochondria and in
the pyrenoid. These characteristics imply the existence of
topological constraints, presumably related to organelle function
at the level of energy management for carbon assimilation. Our
investigations of light acclimation in Phaeodactylum cells and
acclimation to different trophic lifestyles in Nannochloropsis are
consistent with this hypothesis, as topological modifications in
their cellular engines accompanied physiological changes. These
data highlight the intimate links between cellular structures,
energy balance and physiological responses. Associating the
approach we have developed with cryo-electron tomography,
with chemical imaging
74, or with correlative microscopic
studies
75,76will vastly improve investigations of phytoplankton
as well as vascular plants, e.g. to study the impacts of climate
change scenarios
77. It will be critical to assess how changes in
temperature and nutrient availability in the oceans affect the
subcellular features and acclimation capacity of these key
phototrophic microorganisms, so as to predict their future activity
at the global scale.
Fig. 7 Plastid-mitochondria interactions are modified by trophic regimes in Nannochloropsis. a Cells were imaged after growth in phototrophic (left) and mixotrophic (right) conditions. Sections are representatives micrographs of an experiment repeated three times with similar results. Scale bar: 2µm. b Cell growth in phototrophic conditions (black) and mixotrophic conditions (orange). Data refer to three biological samples ± s.d. for each growth condition. c Oxygen consumption (respiration) and evolution (photosynthesis). Data refer to six biological samples ± s.d. for each growth condition. d Cell-volume occupancy by the different subcellular compartments in different microalgal cells. Green: plastid; red: mitochondria; blue: nuclei; white: storage vesicles; grey: other. Data refer tofive cells ± s.d. for each growth condition. Scale bar: 2 µm. e analysis of proximity surface points (magenta) between plastid (green) and mitochondria (red). Data refer tofive cells ± s.d. for each growth condition.
Methods
Species. The species used in this work (Supplementary Table 1) were chosen on the basis of their representativeness of phytoplankton taxa that are ecologically relevant or of their ability to successfully grow in variable laboratory conditions.
Algal cultivation. Phaeodactylum CCAP 1055/3 was obtained from the Culture Collection of Algae and Protozoa, Scottish Marine institute, UK. Cells were grown in artificial seawater (ESAW)78using ten times enriched nitrogen and phosphate
sources (5.49 mM NaNO3and 0.224 mM NaH3PO4; called“10X ESAW”79). Cells
were grown in 50 mLflasks in a growth cabinet (Minitron, Infors HT, Switzerland), at 19 °C, a light intensity of 40 µmol photon m−2s−1, a 12-h light /12-h dark photoperiod (unless otherwise specified) and shaking at 100 rpm. Galdieria SAG21.92 was obtained from the University of Dusseldorf (Germany) and was grown in sterile 2XGS modified Allen medium, pH 2.0 (ref.80) at 42 °C under the
same light conditions. Cells were grown in 250 mLflasks (50 mL culture volume). Nannochloropsis CCMP526 was also cultivated in artificial seawater (10X ESAW). Photoperiod was 12-h light /12-h dark. Cells were shifted from phototrophic to mixotrophic conditions through the addition of 5% Lysogeny Broth (LB) to the growth medium. Micromonas RCC 827, Pelagomonas RCC 100, Emiliania RCC 909 (grown in K medium at 20 °C), and Symbiodinium RCC 4014 (grown in f/2 medium at 20 °C) were obtained from the Roscoff Culture Collection (http://www. roscoff-culture-collection.org/)81and maintained at a light intensity of 60–80 µmol
photons m−2s−1, in a 12-h light /12-h dark photoperiod, without shaking. Nannochloropsis growth was measured following changes in the culture optical density at 650 nm. Changes were calibrated with cell numbers in both control and mixotrophic cultures.
Photophysiology measurements. Oxygen exchanges were measured with a Clark-type electrode (Hansatech Instruments, UK) at 20 °C, with respiration and gross photosynthesis quantified by measuring the slope in the dark and upon light exposure (intensity 300 µmol photons m−2s−1), respectively.
The parameter Fv/Fm (maximum yield of photosystem II photochemistry)82
was used to compare the photosynthetic capacity of the tested strain with earlier data in the literature, as a proxy for their physiological state. Fv/Fmwas measured
with a Speedzen 3 chlorophyllfluorescence imaging setup (Biologic, France). It was calculated as (Fm-F0)/Fm, where F0is the minimumfluorescence yield, determined
at open photosystem II reactions centres and Fmis the maximumfluorescence
yield, measured upon closing the photosystem II reaction centres with a short (150 ms) saturating light pulse.
Sample preparation for electron microscopy. Sample preparation protocols were adapted from reference41to optimize the contrast for 3D electron microscopy
imaging and therefore facilitate image segmentation through pixel classification. Live cells were cryofixed using high-pressure freezing (EM HPM100, Leica, Germany) in which cells were subjected to a pressure of 210 MPa at−196 °C, followed by freeze substitution (EM ASF2, Leica, Germany). Prior to cryofixation, the microalgal cultures were concentrated by gentle centrifugation for 10 min (1000 g). For the freeze substitution, a mixture 2% (w/v) osmium tetroxide and 0.5% (w/v) uranyl acetate in dried acetone was used. The freeze-substitution machine was programmed as follows: 60–80 h at −90 °C, heating rate of 2 °C h−1
to−60 °C (15 h), 10–12 h at −60 °C, heating rate of 2 °C h−1to−30 °C (15 h), and 10–12 h at −30 °C, quickly heated to 0 °C for 1 h to enhance the staining efficiency of osmium tetroxide and uranyl acetate and then back at−30 °C. The cells were then washed four times in anhydrous acetone for 15 min each at−30 °C and gradually embedded in anhydrous araldite resin. A graded resin/acetone (v/v) series was used (30, 50 and 70% resin) with each step lasting 2 h at increased temperature: 30% resin/acetone bath from−30 °C to −10 °C, 50% resin/acetone bath from−10 °C to 10 °C, 70% resin/acetone bath from 10 °C to 20 °C. Samples were then placed in 100% resin for 8–10 h and in 100% resin with the accelerator BDMA for 8 h at room temperature. Resin polymerizationfinally occurred at 65 °C for 48 h.
FIB-SEM acquisition imaging. Focused ion beam (FIB) tomography was per-formed with either a Zeiss NVision 40 or a Zeiss CrossBeam 550 microscope (Zeiss, Germany), both equipped with Fibics Atlas 3D software for tomography (Sup-plementary Fig. 1a). The resin block containing the cells wasfixed on a stub with carbon paste, and surface-abraded with a diamond knife in a microtome to obtain a perfectlyflat and clean surface. The entire sample was metallized with 4 nm of platinum to avoid charging during the observations. Inside the FIB-SEM, a second platinum layer (1–2 µm) was deposited locally on the analysed area to mitigate possible curtaining artefacts. The sample was then abraded slice by slice with the Ga+ion beam (generally with a current of 700 nA at 30 kV). Each freshly exposed surface was imaged by scanning electron microscopy (SEM) at 1.5 kV and with a current of ~1 nA using the in-lens EsB backscatter detector. For algae, we generally used the simultaneous milling and imaging mode for better stability, and with an hourly automatic correction of focus and astigmatism. For each slice, a thickness of 8 nm was removed, and the SEM images were recorded with a pixel size of 8 nm, providing an isotropic voxel size of 8 × 8 × 8 nm3. Whole volumes were imaged
with 800–1000 frames, depending on the species. Due to its reduced cell
dimensions, the voxel size was reduced to 4 × 4 × 4 nm3in the case of Micromonas,
resulting in higher resolution datasets with approximately 350–500 frames/cell. Image processing. As afirst step of image processing, regions of interest (ROIs) containing cells were cropped from the full image stack. This was followed by image registration (stack alignment), noise reduction, semi-automatic segmenta-tion of the ROIs, 3D reconstrucsegmenta-tion of microalgae cells and morphometric analysis. Several problems may be encountered during these steps. Raw stacks consist of big data (50–100 GB for the whole imaged volume, containing several cells) that do not necessarilyfit into the computer main memory (RAM). Moreover, cryo-substituted cells generate less contrasted images than cells prepared with chemicalfixation. Therefore, thefirst step in building a robust 3D model consists in ‘isolating’ a given ROI (e.g. an organelle) from other compartments, to obtain a smaller stack size that can be easily worked with (in practice, we worked with substacks that were around 10% of the original stack size).
Single cells were isolated by cropping in three dimensions using the open software Fiji (https://imagej.net/Fiji, Supplementary Fig. 1a). Image misalignment was corrected using the template matching (“align slices in stack”) option implemented in Fiji. This functionfinds the most similar image pattern in every slice and translates them to align the landmark pattern across the stack (https:// sites.google.com/site/qingzongtseng/template-matching-ij-plugin) (Supplementary Movies 1-9). Aligned image stacks werefiltered to remove noise using Python83
and OpenCV (https://opencv.org). Filtering techniques were chosen to highlight contours while removing noise in the images. Depending on the species, we found that the osmium staining was not homogeneously distributed. Therefore, it was not possible tofilter raw datasets of every species with the same method. Based on the effectiveness in highlighting organelle boundaries, differentfilters were used for the different microalgae (Supplementary Fig. 1b). Application of a linear Gaussianfilter followed by sharpening to remove noise and enhance contours, which is widely used and easy to implement84, was used to process raw datasets of Emiliania,
Micromonas, Phaeodactylum and Pelagomonas. However, this method was less effective when applied to raw datasets of Galdieria and Symbiodinium, where using the medianfilter proved to be a better de-noising option. These choices reflect the different cellular features and biochemical composition of each taxon (e.g. the presence of a thick cell wall in Galdieria), which results in variable contrast.
Segmentation. Segmentation of organelles, vesicular networks, vacuoles and sto-rage compartments was carried out with 3D Slicer software85(www.slicer.org,
Supplementary Fig. 1c), using a manually-curated, semi-automatic pixel clustering mode (3 to 10 slices are segmented simultaneously for a given ROI). We assigned colours to the ROIs using paint tools and adjusted the threshold range for image intensity values. The ROIs were annotated and the corresponding label map was run into the model maker module from 3D slicer (Supplementary Fig. 1c), to generate corresponding 3D models that were exported in different formats (. stl, obj, vtk, ply, mtl). For further analysis, we used the.stl mesh, which proved to be most suitable for 3D analysis in our workflow (Supplementary Table 2). 3D reconstructed model. A 3Dfiltering process was needed to refine the model and reduce the size of thefile (see Supplementary Table 2). In our case, 3D models generated by 3D Slicer were imported into the open source software MeshLab86,87
which automatically removed some‘isolated islands’. Models were further edited manually within MeshLab to eliminate remaining isolated islands erroneously annotated as ROIs. We also performed a remeshing process to facilitate 3D modelling, visualization and animation. Using MeshLab, we simplified meshes (‘mesh decimation’, Supplementary Fig. 1d) to reduce the model nodes and faces down to 25% of the original data without modifying morphometric values, such as surfaces and volumes (Supplementary Table 2). Every 3D model was imported into Paraview88(Supplementary Fig. 1d) to visualize 3D objects and understand their
relationships. Blender (www.blender.org) was used for object animation (Supple-mentary Movie 10).
Morphometric evaluations. Measurement of volumes, surface area, and the minimum distance between meshes) were performed using Numpy-STL (https:// pypi.org/project/numpy-stl/) and TRIMESH (https://trimsh.org/trimesh.html) packages of Python (Supplementary Table 3). This Python package is faster than MeshLab, with obvious advantages in terms of analysis of largefiles (>500 MB). Surface and volume measurements. Surfaces and volumes were computed using the discrete mesh geometry, with surfaces computed directly from mesh triangles and volumes computed from the signed volume of individual tetrahedrons, assuming a closed surface (watertight mesh, Supplementary Fig. 1e). Briefly, to compute the surface, we iterated over all the triangles of the mesh. The compu-tation of the cross product between two edges of a given triangle gives a vector whose magnitude is twice the area of said triangle. Then, the sum of all these areas provides the total surface area of the mesh. We then computed the signed volume of all tetrahedrons, which goes from the origin (0,0,0) to each triangle present in the mesh. Assuming a closed surface (watertight mesh), summing all those volumes gives the volume of the mesh89. A simple implementation of those algorithms is
Distance between organelles. Using the Trimesh Python module, the minimal distance between two meshes was calculated based on the closest points between two triangular meshes. Hence, the surface proximity areas were quantified based on: (i) calculating the minimal distance between each vertex of the plastid mesh to the mitochondria mesh (for 3 cells of every species), and then by (ii) gathering mesh vertices according to a given distance threshold to generate proximity sur-faces. Two distance thresholds were chosen for this analysis:≤30 nm, the ‘average’ one, to define possible contact points54–56and≤90 nm, defining the ‘upper limit’
for organelle proximity57,90. The corresponding surfaces were then compared to
the total plastid surface (Supplementary dataset 3).
Reporting summary. Further information on research design is available in the Nature Research Reporting Summary linked to this article.
Data availability
The authors declare that all the data supporting thefindings of this study are available within the paper and in its supplementary informationfiles. Raw FIB-SEM stacks are available athttps://www.ebi.ac.uk/biostudies/studies/S-BSST575. Source data are provided with this paper.
Code availability
The computer codes supporting thefindings of this study are available in the supplementary data 2 and supplementary data 3. The proximity distance computation code is available at:https://gitlab.com/clariaddy/mindist. The metrics computation code is available at:https://gitlab.com/clariaddy/stl_statistics.
Received: 5 June 2020; Accepted: 12 January 2021;
References
1. Field, C. B., Behrenfeld, M. J., Randerson, J. T. & Falkowski, P. Primary production of the biosphere: integrating terrestrial and oceanic components. Science 281, 237–240 (1998).
2. Sibbald, S. J. & Archibald, J. M. Genomic insights into plastid evolution. Genome Biol. Evol. 12, 978–990 (2020).
3. Not, F. et al. Diversity and ecology of eukaryotic marine phytoplankton. Adv. Botanical Res. 64, 1–53 (2012).
4. de Vargas, C. et al. Ocean plankton. Eukaryotic plankton diversity in the sunlit ocean. Science 348, 1261605 (2015).
5. Bailleul, B. et al. Energetic coupling between plastids and mitochondria drives CO2 assimilation in diatoms. Nature 524, 366–369 (2015).
6. Engel, B. D. et al. Native architecture of the Chlamydomonas chloroplast revealed by in situ cryo-electron tomography. eLife 4, e04889 (2015). 7. Andersen, R. A., Bailey, J. C., Decelle, J. & Probert, I. Phaeocystis rex sp. nov.
(Phaeocystales, Prymnesiophyceae): a new solitary species that produces a multilayered scale cell covering. Eur. J. Phycol. 50, 207–222 (2015). 8. Embleton, K. V., Gibson, C. E. & Heaney, S. I. Automated counting of
phytoplankton by pattern recognition: a comparison with a manual counting method. J. Plankton Res. 25, 669–681 (2003).
9. Rodenacker, K., Hense, B., Jutting, U. & Gais, P. Automatic analysis of aqueous specimens for phytoplankton structure recognition and population estimation. Microsc. Res. Tech. 69, 708–720 (2006).
10. Schulze, K., Tillich, U. M., Dandekar, T. & Frohme, M. PlanktoVision—an automated analysis system for the identification of phytoplankton. BMC Bioinformatics 14, 115 (2013).
11. Sosik, H. M. & Olson, R. J. Automated taxonomic classification of phytoplankton sampled with imaging-in-flow cytometry. Limnol. Oceanogr.: Methods 5, 204–216 (2007).
12. Hense, B. A., Gais, P., Jutting, U., Scherb, H. & Rodenacker, K. Use of fluorescence information for automated phytoplankton investigation by image analysis. J. Plankton Res. 30, 587–606 (2008).
13. Colin, S. et al. Quantitative 3D-imaging for cell biology and ecology of environmental microbial eukaryotes. eLife 6, e26066 (2017).
14. Baumeister, W. Electron tomography: towards visualizing the molecular organization of the cytoplasm. Curr. Opin. Struct. Biol. 12, 679–684 (2002).
15. Phan, S. et al. 3D reconstruction of biological structures: automated procedures for alignment and reconstruction of multiple tilt series in electron tomography. Adv. Struct. Chem. Imaging 2, 1–18 (2016).
16. Titze, B. & Genoud, C. Volume scanning electron microscopy for imaging biological ultrastructure. Biol. Cell 108, 307–323 (2016).
17. Mineyuki, Y. 3D image analysis of plants using electron tomography and micro-CT. Microscopy 63, i8–i9 (2014).
18. Liang, Z. et al. Thylakoid-bound polysomes and a dynamin-related protein, FZL, mediate critical stages of the linear chloroplast biogenesis program in greening Arabidopsis cotyledons. Plant Cell 30, 1476–1495 (2018). 19. Austin, J. R. & Staehelin, L. A. Three-dimensional architecture of grana and
stroma thylakoids of higher plants as determined by electron tomography. Plant Physiol. 155, 1601–1611 (2011).
20. Daum, B., Nicastro, D., Austin, J., McIntosh, J. R. & Kühlbrandt, W. Arrangement of photosystem II and ATP synthase in chloroplast membranes of spinach and pea. Plant Cell 22, 1299–1312 (2010).
21. Kouřil, R., Oostergetel, G. T. & Boekema, E. J. Fine structure of granal thylakoid membrane organization using cryo electron tomography. Biochim. Biophys. Acta (BBA)—Bioenerg. 1807, 368–374 (2011).
22. Kowalewska,Ł., Mazur, R., Suski, S., Garstka, M. & Mostowska, A. Three-dimensional visualization of the tubular-lamellar transformation of the internal plastid membrane network during runner bean chloroplast biogenesis. Plant Cell 28, 875–891 (2016).
23. Shimoni, E., Rav-Hon, O., Ohad, I., Brumfeld, V. & Reich, Z. Three-dimensional organization of higher-plant chloroplast thylakoid membranes revealed by electron tomography. Plant Cell 17, 2580–2586 (2005). 24. Moisan, T. A., Ellisman, M. H., Buitenhuys, C. W. & Sosinsky, G. E.
Differences in chloroplast ultrastructure of Phaeocystis antarctica in low and high light. Mar. Biol. 149, 1281–1290 (2006).
25. Moisan, T. A. & Mitchell, B. G. Photophysiological acclimation of Phaeocystis antarctica Karsten under light limitation. Limnol. Oceanogr. 44, 247–258 (1999).
26. Ota, S. et al. Highly efficient lipid production in the green alga Parachlorella kessleri: draft genome and transcriptome endorsed by whole-cell 3D ultrastructure. Biotechnol. Biofuels 9, 13 (2016).
27. Ota, S. et al. Deciphering the relationship among phosphate dynamics, electron-dense body and lipid accumulation in the green alga Parachlorella kessleri. Sci. Rep. 6, 1–11 (2016).
28. Wayama, M. et al. Three-dimensional ultrastructural study of oil and astaxanthin accumulation during encystment in the green alga Haematococcus pluvialis. PloS ONE 8, e53618 (2013).
29. Harwood, R. et al. Cell and chloroplast anatomical features are poorly estimated from 2D cross‐sections. N. Phytologist 225, 2567–2578 (2020). 30. Kittelmann, M., Hawes, C. & Hughes, L. Serial block face scanning electron
microscopy and the reconstruction of plant cell membrane systems. J. Microsc. 263, 200–211 (2016).
31. Pain, C., Kriechbaumer, V., Kittelmann, M., Hawes, C. & Fricker, M. Quantitative analysis of plant ER architecture and dynamics. Nat. Commun. 10, 1–15 (2019).
32. Rigort, A., Villa, E., Bäuerlein, F. J., Engel, B. D. & Plitzko, J. M. in Methods in Cell Biology (eds Muller-Reichert, T. & Verkade, P.) (Elsevier, 2012). 33. Schaffer, M. et al. Cryo-focused ion beam sample preparation for
imaging vitreous cells by cryo-electron tomography. Bio Protoc. 5, e1575 (2015).
34. Wietrzynski, W. et al. Charting the native architecture of Chlamydomonas thylakoid membranes with single-molecule precision. eLife 9, e53740 (2020). 35. Oi, T. et al. Three-dimensional intracellular structure of a whole rice
mesophyll cell observed with FIB-SEM. Ann. Bot. 120, 21–28 (2017). 36. Yamane, K. et al. Three‐dimensional ultrastructure of chloroplast pockets
formed under salinity stress. Plant Cell Environ. 41, 563–575 (2018). 37. García-Cerdán, J. G. et al. Chloroplast Sec14-like 1 (CPSFL1) is essential for
normal chloroplast development and affects carotenoid accumulation in Chlamydomonas. Proc. Natl Acad. Sci. 117, 12452–12463 (2020).
38. Xu, C. S. et al. Enhanced FIB-SEM systems for large-volume 3D imaging. eLife 6, e25916 (2017).
39. Flori, S. et al. Plastid thylakoid architecture optimizes photosynthesis in diatoms. Nat. Commun. 8, 15885 (2017).
40. Flori, S., Jouneau, P. H., Finazzi, G., Marechal, E. & Falconet, D. Ultrastructure of the periplastidial compartment of the diatom Phaeodactylum tricornutum. Protist 167, 254–267 (2016).
41. Decelle, J. et al. Algal remodeling in a ubiquitous planktonic photosymbiosis. Curr. Biol. 29, 968–978 e964 (2019).
42. Sviben, S. et al. A vacuole-like compartment concentrates a disordered calcium phase in a key coccolithophorid alga. Nat. Commun. 7, 11228 (2016). 43. Jantschke, A. et al. Anhydrousβ-guanine crystals in a marine dinoflagellate:
structure and suggested function. J. Struct. Biol. 207, 12–20 (2019). 44. Jantschke, A., Pinkas, I., Schertel, A., Addadi, L. & Weiner, S.
Biomineralization pathways in calcifying dinoflagellates: Uptake, storage in MgCaP-rich bodies and formation of the shell. Acta Biomaterialia 102, 427–439 (2020).
45. Gal, A. et al. Native-state imaging of calcifying and noncalcifying microalgae reveals similarities in their calcium storage organelles. Proc. Natl Acad. Sci. USA 115, 11000–11005 (2018).
46. Andersen, R. A., Saunders, G. W., Paskind, M. P. & Sexton, J. P. Ultrastructure and 18s ribosomal-Rna gene sequence for pelagomonas-calceolata Gen Et
Sp-Nov and the description of a new algal class, the pelagophyceae classis nov. J. Phycol. 29, 701–715 (1993).
47. Simionato, D. et al. The response of Nannochloropsis gaditana to nitrogen starvation includes de novo biosynthesis of triacylglycerols, a decrease of chloroplast galactolipids, and reorganization of the photosynthetic apparatus. Eukaryot. Cell 12, 665–676 (2013).
48. Lopes Dos Santos, A. et al. Chloropicophyceae, a new class of picophytoplanktonic prasinophytes. Sci. Rep. 7, 14019 (2017). 49. Lupette, J. et al. The architecture of lipid droplets in the diatom
Phaeodactylum tricornutum. Algal Res. 38, 101415 (2019). 50. Mustardy, L. & Garab, G. Granum revisited. A three-dimensional
model–where things fall into place. Trends Plant Sci. 8, 117–122 (2003).
51. Bereiter‐Hahn, J. & Vöth, M. Dynamics of mitochondria in living cells: shape changes, dislocations, fusion, andfission of mitochondria. Microsc. Res. Tech. 27, 198–219 (1994).
52. Kim, J. et al. Flux balance analysis of primary metabolism in the diatom Phaeodactylum tricornutum. Plant J.: Cell Mol. Biol. 85, 161–176 (2016).
53. Mueller-Schuessele, S. J. & Michaud, M. Plastid transient and stable interactions with other cell compartments. Methods Mol. Biol. 1829, 87–109 (2018).
54. Rast, A. et al. Biogenic regions of cyanobacterial thylakoids form contact sites with the plasma membrane. Nat. Plants 5, 436–446 (2019).
55. Collado, J. et al. Tricalbin-mediated contact sites control ER curvature to maintain plasma membrane integrity. Dev. Cell 51, 476–487.e477 (2019). 56. Hoffmann, P. C. et al. Tricalbins contribute to cellular lipidflux and form
curved ER-PM contacts that are bridged by rod-shaped structures. Dev. Cell 51, 488–502. e488 (2019).
57. Scorrano, L. et al. Coming together to define membrane contact sites. Nat. Commun. 10, 1287 (2019).
58. Phillips, M. J. & Voeltz, G. K. Structure and function of ER membrane contact sites with other organelles. Nat. Rev. Mol. cell Biol. 17, 69–82 (2016). 59. Prinz, W. A. Bridging the gap: membrane contact sites in signaling,
metabolism, and organelle dynamics. J. Cell Biol. 205, 759–769 (2014). 60. Rowland, A. A. & Voeltz, G. K. Endoplasmic reticulum–mitochondria
contacts: function of the junction. Nat. Rev. Mol. cell Biol. 13, 607–615 (2012). 61. Merola, A. et al. Revision of Cyanidium caldarium. Three species of
acidophilic algae. Plant Biosyst. 115, 189–195 (1981).
62. Mackinder, L. C. et al. A repeat protein links Rubisco to form the eukaryotic carbon-concentrating organelle. Proc. Natl Acad. Sci. 113, 5958–5963 (2016).
63. Meyer, M. T., McCormick, A. J. & Griffiths, H. Will an algal CO2-concentrating mechanism work in higher plants? Curr. Opin. plant Biol. 31, 181–188 (2016).
64. Badger, M. R. & Price, G. D. The role of carbonic anhydrase in photosynthesis. Annu. Rev. Plant Physiol. Plant Mol. Biol. 45, 369–392 (1994).
65. Moroney, J. V. & Mason, C. B. The role of the chloroplast in inorganic carbon acquisition by chlamydomonas-reinhardtii. Can. J. Bot. 69, 1017–1024 (1991).
66. Meyer, M. T., Whittaker, C. & Griffiths, H. The algal pyrenoid: key unanswered questions. J. Exp. Bot. 68, 3739–3749 (2017).
67. Dauvillee, D. et al. Genetic dissection offloridean starch synthesis in the cytosol of the model dinoflagellate Crypthecodinium cohnii. Proc. Natl Acad. Sci. USA 106, 21126–21130 (2009).
68. Van Thinh, L., Griffiths, D. J. & Winsor, H. Ultrastructure of symbiodinium microadriaticum (Dinophyceae) symbiotic with Zoanthus sp. (Zoanthidea). Phycologia 25, 178–184 (1986).
69. Gallagher, J., Wood, A. & Alberte, R. Ecotypic differentiation in the marine diatom Skeletonema costatum: influence of light intensity on the photosynthetic apparatus. Mar. Biol. 82, 121–134 (1984).
70. Das, P., Lei, W., Aziz, S. S. & Obbard, J. P. Enhanced algae growth in both phototrophic and mixotrophic culture under blue light. Bioresour. Technol. 102, 3883–3887 (2011).
71. Fang, X., Wei, C., Zhao-Ling, C. & Fan, O. Effects of organic carbon sources on cell growth and eicosapentaenoic acid content of Nannochloropsis sp. J. Appl. Phycol. 16, 499–503 (2004).
72. Sforza, E., Cipriani, R., Morosinotto, T., Bertucco, A. & Giacometti, G. M. Excess CO2supply inhibits mixotrophic growth of Chlorella protothecoides
and Nannochloropsis salina. Bioresour. Technol. 104, 523–529 (2012). 73. Marudhupandi, T., Sathishkumar, R. & Kumar, T. T. A. Heterotrophic
cultivation of Nannochloropsis salina for enhancing biomass and lipid production. Biotechnol. Rep. 10, 8–16 (2016).
74. Decelle, J. et al. Subcellular chemical imaging: new avenues in cell biology. Trends Cell Biol. 30, 173–188 (2020).
75. Sartori, A. et al. Correlative microscopy: bridging the gap between fluorescence light microscopy and cryo-electron tomography. J. Struct. Biol. 160, 135–145 (2007).
76. Stephens, D. J. & Allan, V. J. Light microscopy techniques for live cell imaging. Science 300, 82–86 (2003).
77. Intergovernmental Panel on Climate, C. Climate Change 2014—Impacts, Adaptation and Vulnerability: Part B: Regional Aspects: Working Group II Contribution to the IPCC Fifth Assessment Report: Volume 2: Regional Aspects (Cambridge University Press, 2014).
78. Berges, J., Franklin, D. & Harrison, P. Evolution of an artificial seawater medium: Improvements in enriched seawater, artificial water over the last two decades (Vol. 37: 1138–1145). J. Phycol. 40, 619 (2004).
79. Dolch, L.-J. et al. A palmitic acid elongase affects eicosapentaenoic acid and plastidial monogalactosyldiacylglycerol levels in Nannochloropsis. Plant Physiol. 173, 742–759 (2017).
80. Allen, M. B. Studies with Cyanidium caldarium, an anomalously pigmented chlorophyte. Arch. Mikrobiologie 32, 270–277 (1959).
81. Vaulot, D., Gall, F. L., Marie, D., Guillou, L. & Partensky, F. The Roscoff Culture Collection (RCC): a collection dedicated to marine picoplankton. Nova Hedwig. 79, 49–70 (2004).
82. Butler, W. L. Energy distribution in the photochemical apparatus of photosynthesis. Annu. Rev. Plant Physiol. 29, 345–378 (1978).
83. Oliphant, T. E. Python for scientific computing. Comput. Sci. Eng. 9, 10–20 (2007).
84. Russo, F. An image enhancement technique combining sharpening and noise reduction. IEEE Trans. Instrum. Meas. 51, 824–828 (2002).
85. Kikinis, R., Pieper, S. D. & Vosburgh, K. G. in Intraoperative Imaging and Image-guided Therapy (ed. Jolesz, F.) (Springer, 2014).
86. Cignoni, P. et al. MeshLab: an Open-Source Mesh Processing Tool. In Sixth Eurographics Italian Chapter Conference (eds Scarano, V., De Chiara, R. & Erra, U.) 129–136 (Eurographics Digital Library, 2008).
87. Ranzuglia, G., Callieri, M., Dellepiane, M., Cignoni, P. & Scopigno, R. MeshLab as a complete tool for the integration of photos and color with high resolution 3D geometry data. CAA 2012 Conference Proceedings (eds Graeme, E. et al.) 406–416 (Amsterdam University Press, 2012).
88. Ahrens, J., Geveci, B. & Law, C. in The Visualization Handbook Vol. 717 (Data Science at Scale; Los Alamos National Laboratory, 2005).
89. Zhang, C., Chen, T. Efficient feature extraction for 2D/3D objects in mesh representation. In Proceedings 2001 International Conference on Image Processing (Cat. No. 01CH37205)) (IEEE, 2001).
90. Helle, S. C. et al. Organization and function of membrane contact sites. Biochim. Biophys. Acta 1833, 2526–2541 (2013).
91. Decelle, J. et al. Phyto REF: a reference database of the plastidial 16S rRNA gene of photosynthetic eukaryotes with curated taxonomy. Mol. Ecol. Resour. 15, 1435–1445 (2015).
Acknowledgements
The authors thank the Roscoff Culture Collection that provided phytoplankton strains and Noan Le Bescot (Ternog Design) for help in the conception and reali-zation of thefigures of this article. This project received funding from the European Research Council: ERC Chloro-mito (grant no. 833184) to G.F., D.F., G.C. Research was also supported by a Défi X-Life grant from CNRS to J.D., funds from the CEA DRF impulsion FIB-Bio program to J.D., P.-H.J., B.G., C.M., D.F., G.S.; the European Union’s Horizon 2020 research and innovation programme CORBEL under the grant agreement No 654248 to J.D., the LabEx GRAL (ANR-10-LABX-49-01),financed within the University Grenoble Alpes graduate school (Ecoles Universitaires de Recherche) CBH-EUR-GS (ANR-17-EURE-0003) to C.W., J.D., P.-H.J., B.G., C.M., F.C., G.C., G.S., D.F., G.F. and the ANR‘Momix’ (Projet-ANR-17-CE05-0029) to G.C., G.F. This work used the platforms of the Grenoble Instruct-ERIC centre (ISBG; UMS 3518 CNRS-CEA-UGA-EMBL) within the Grenoble Partnership for Structural Biology (PSB), supported by FRISBI (ANR-10-INBS-05-02) and GRAL to B.G., C.M., G.S. The electron microscope facility is supported by the Auvergne-Rhône-Alpes Region, the Fondation Recherche Medicale (FRM), the funds FEDER and the GIS-Infrastructures en Biologie Santé et Agronomie (IBiSA) to B.G., C.M., G.S.; J.D. was supported by ATIP-Avenir program. C.U. is supported by a joint UGA-ETH Zurich PhD grant (to G.F. and S.C.Z.) in the framework of the“Investissements d’avenir” programme (ANR-15-IDEX-02).
Author contributions
C.U. designed the work, performed image treatment; made scripts and drafted the manuscript; J.D. designed the manuscript, prepared samples for FIB-SEM, interpreted data and drafted the manuscript; P.-H. J. conceived the work, performed FIB-SEM imaging and drafted the manuscript; S.F. characterized the physiological responses of LL and HL Phaeodactylum cells; B.G. performed sample preparation; J.B.K. performed image treatment and made scripts; D.D.B. characterized the physiological responses of phototrophic and mixotrophic Nannochloropsis cells; C.M. performed cryofixation. G.A. optimized growth of phototrophic and mixotrophic Nannochloropsis cells; F. Chevalier. optimized samples growth; C.S. characterized the physiological responses of LL and HL Phaeodactylum cells; N.L.S. performed FIB-SEM imaging; R.T. performed FIB-SEM
imaging; F. Courtois. interpreted data; G.C. optimized samples growth and interpreted data; Y.S. performed FIB-SEM imaging and participated to manuscript drafting; G.S. designed the work and participated to manuscript drafting; S.C.Z. designed the work interpreted data and drafted the manuscript; D.F. designed the work, prepared samples for FIB-SEM, interpreted data and drafted the manuscript; G.F. designed the work; interpreted data and drafted the manuscript. All authors revised and approved the text.
Competing interests
The authors declare no competing interests.
Additional information
Supplementary informationThe online version contains supplementary material available athttps://doi.org/10.1038/s41467-021-21314-0.
Correspondenceand requests for materials should be addressed to J.D., D.F. or G.F.
Peer review informationNature Communications thanks Benjamin Engel, Koji Yamane, and the other, anonymous reviewer(s) for their contribution to the peer review of this work. Peer review reports are available.
Reprints and permission informationis available athttp://www.nature.com/reprints
Publisher’s note Springer Nature remains neutral with regard to jurisdictional claims in published maps and institutional affiliations.
Open Access This article is licensed under a Creative Commons Attribution 4.0 International License, which permits use, sharing, adaptation, distribution and reproduction in any medium or format, as long as you give appropriate credit to the original author(s) and the source, provide a link to the Creative Commons license, and indicate if changes were made. The images or other third party material in this article are included in the article’s Creative Commons license, unless indicated otherwise in a credit line to the material. If material is not included in the article’s Creative Commons license and your intended use is not permitted by statutory regulation or exceeds the permitted use, you will need to obtain permission directly from the copyright holder. To view a copy of this license, visithttp://creativecommons.org/ licenses/by/4.0/.