Carbon Nanodots: Opportunities and limitations to study their biodistribution at
the human lung epithelial tissue barrier
Running title: The biodistribution of Carbon NanoDots in a lung model Running Authors: Durantie et Barosova et al.
Estelle Durantiea*, Hana Barosovaa*, Barbara Draslera, Laura Rodriguez-Lorenzoa,b, Dominic A. Urbana, Dimitri Vanheckea, Dedy Septiadia, Liliane Hirschi-Ackermanna, Alke Petri-Finka,c, Barbara Rothen-Rutishausera&
* These authors contributed equally to this work
aAdolphe Merkle Institute, Université de Fribourg, Chemin des Verdiers 4, 1700, Fribourg, Switzerland
bWater Quality Group, Water4Environment Unit, Department of Life Sciences, International Iberian Nanotechnology Laboratory, Av. Mestre José Veiga 4715-330 Braga, Portugal
cChemistry Department, University of Fribourg, Chemin du Musée 9, 1700 Fribourg, Switzerland
& CORRESPONDING AUTHOR Prof. Barbara Rothen-Rutishauser BioNanomaterials Group
Adolphe Merkle Institute Chemin des Verdiers 4 CH-1700 Fribourg Switzerland
Phone: +41 26 300 9502
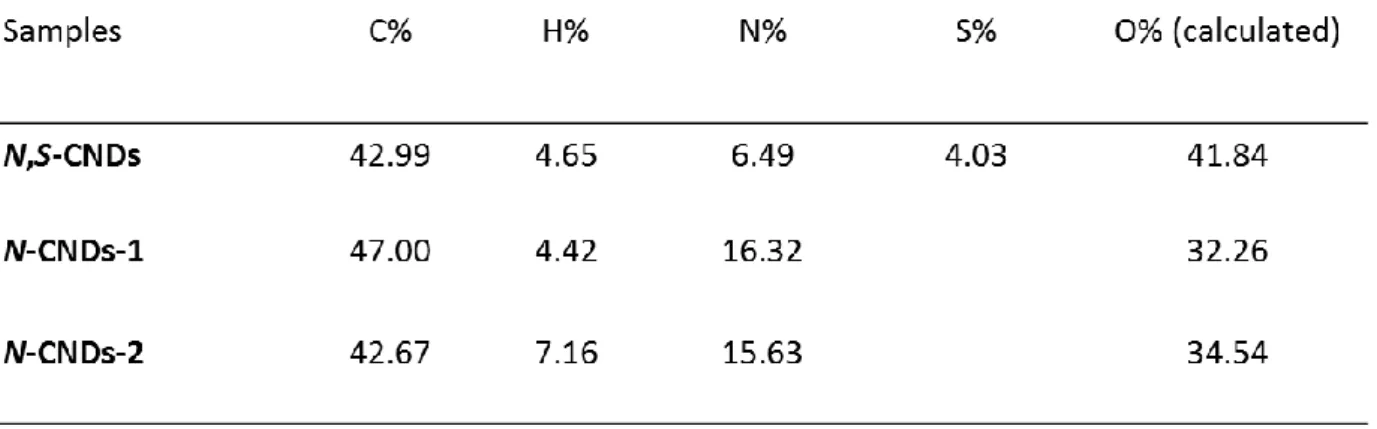
Table SI: Elemental analysis of CNDs
Elemental analysis show the successful doping of N,S-CNDs with nitrogen and and sulfur and the N-CNDs-1 and N-CNDs-2 with nitrogen.
a)
b)
FIGURE S1:Representative TEM micrographs of agglomerated N-CNDs-1 proving the
low contrast of the particles, when smaller agglomerates occur (b). a) scale bar: 200 nm, b) scale bar 50 nm.
N,S-CND
N-CND-1
N-CND-2
a)
b)
CNDs are stable in supplemented FluoroBrite DMEM until 4h and UV-Vis properties changed at 24h; however, the fluorescent signals remain equal. TDA results show stable size over 24 h.
N-CND-2 were diluted to 10 μg/mL to avoid saturation signal; signal at 24h is more intense due to evaporation.
FIGURE S2: (a) UV-Vis and (b) fluorescent spectra of all three types of CNDs after 0, 1, 4 and 24 h at concentration 100 µg/mL in
Signal of
untreated cells
Merged signals
Signal of CNDs
N,S
–
CNDs
N
-
CNDs
-1
un
tr
ea
ted
a)
b)
FIGURE S3:a) Spectra obtained using lambda mode in confocal microscope presenting overlapping of the untreated cells (J774A.1
mouse macrophage cell line used to improve the potential uptake) peak with CNDs peaks, (b) representative LSM images of unteated cells and cells treated with CNDs applying obtained spectra. Scale bar: 20 µm.