HAL Id: inserm-01334550
https://www.hal.inserm.fr/inserm-01334550
Submitted on 20 Jun 2016
HAL is a multi-disciplinary open access
archive for the deposit and dissemination of
sci-entific research documents, whether they are
pub-lished or not. The documents may come from
teaching and research institutions in France or
abroad, or from public or private research centers.
L’archive ouverte pluridisciplinaire HAL, est
destinée au dépôt et à la diffusion de documents
scientifiques de niveau recherche, publiés ou non,
émanant des établissements d’enseignement et de
recherche français ou étrangers, des laboratoires
publics ou privés.
Embryonic Stem Cells and Tissues.
Imen Jebeniani, Julia Leschik, Michel Puceat
To cite this version:
Imen Jebeniani, Julia Leschik, Michel Puceat. Epigenetic Regulation of Cardiac Differentiation of
Embryonic Stem Cells and Tissues.. Journal of visualized experiments : JoVE, JoVE, 2016, pp.
e53874. �10.3791/53874�. �inserm-01334550�
Video Article
Epigenetic Regulation of Cardiac Differentiation of Embryonic Stem Cells and
Tissues
Imen Jebeniani1, Julia Leschik2, Michel Puceat1
1INSERM UMR-910, Faculté de Médecine, Université Aix-Marseille
2Institute of Physiological Chemistry, University Medical Center, Johannes Gutenberg University
Correspondence to: Michel Puceat at michel.puceat@inserm.fr
URL: http://www.jove.com/video/53874
DOI: doi:10.3791/53874
Keywords: Developmental Biology, Issue 112, Epigenetics, chromatin immunoprecipitation, cardiac development, ES cells, gene transcription regulation, cardiac differentiation
Date Published: 6/3/2016
Citation: Jebeniani, I., Leschik, J., Puceat, M. Epigenetic Regulation of Cardiac Differentiation of Embryonic Stem Cells and Tissues. J. Vis. Exp. (112), e53874, doi:10.3791/53874 (2016).
Abstract
Specific gene transcription is a key biological process that underlies cell fate decision during embryonic development. The biological process is mediated by transcription factors which bind genomic regulatory regions including enhancers and promoters of cardiac constitutive genes. DNA is wrapped around histones that are subjected to chemical modifications. Modifications of histones further lead to repressed, activated or poised gene transcription, thus bringing another level of fine tuning regulation of gene transcription. Embryonic Stem cells (ES cells) recapitulate within embryoid bodies (i.e., cell aggregates) or in 2D culture the early steps of cardiac development. They provide in principle enough material for chromatin immunoprecipitation (ChIP), a technology broadly used to identify gene regulatory regions. Furthermore, human ES cells represent a human cell model of cardiogenesis. At later stages of development, mouse embryonic tissues allow for investigating specific epigenetic landscapes required for determination of cell identity. Herein, we describe protocols of ChIP, sequential ChIP followed by PCR or ChIP-sequencing using ES cells, embryoid bodies and cardiac specific embryonic regions. These protocols allow to investigating the epigenetic regulation of cardiac gene transcription.
Video Link
The video component of this article can be found at http://www.jove.com/video/53874/
Introduction
The heart is the first organ to be formed and to become functional in the embryo. The heart is built from many cell lineages that arise from the first and second embryonic heart fields1. From the post-fertilization blastocyst stage up to the shaped heart, embryonic cells have thus to make many cell fate decisions. Gene transcription is regulated in a time- and space-dependent manner and is a key biological process that underlies cell fate decision during embryonic development. Such a process is mediated by specific transcription factors which bind regulatory regions within the genome including enhancers and promoters of cardiac constitutive genes. DNA is wrapped around histones that are subjected to modifications such as acetylation, methylation, ubiquitinylation, and/or phosphorylation. Histone modification leads to repressed, activated or poised gene transcription depending upon which lysine residue of histone is modified2.
Chromatin immunoprecipitation assay (ChIP) has been set up years ago3 and is currently the most broadly used technology in order to identify
targets of either modified histones or transcription factors4. Following immunoprecipitation of histones or transcription factors, bound DNA can be either amplified by polymerase chain reaction (PCR) or sequenced. ChIP has technically overcome more challenging gel retardation assays5.
However ChIP does not imply direct binding of a transcription factor to DNA, an advantage of gel retardation assay. On the other hand, ChIP combined to DNA sequencing has opened a new genome-wide perspective on gene regulation.
ES cells (ES cells) recapitulate within embryoid bodies (i.e., cell aggregates) or in 2D culture the early steps of cardiac development6 and provide
in principle enough material for ChIP. Furthermore, human ES cells represent a human cell model of cardiogenesis although their cardiogenic potential depends upon their epigenetic signature7. At later stages of development, mouse embryonic tissues allow for investigating specific
epigenetic landscapes required for determination of cell identity. However, the genome is transcribed in a time- and cell type-specific manner8. Epigenetic regulation of gene transcription has to be studied within localized regions. Herein, we describe protocols of ChIP, sequential ChIP followed by PCR or sequencing using ES cells, embryoid bodies and cardiac specific embryonic regions. These protocols allow to investigating the epigenetic regulation of cardiac gene transcription.
Protocol
1. DNA-protein Cross-linking
1. Fix in 15 ml tubes harvested-ES cells (2 x 10⁶ cells for regular ChIP, 2 x 10⁵ cells for microChIP), embryoid bodies (EBs) generated from ES cells and embryonic heart tissues dissected from E9.5 mouse embryos (atrioventricular canal, outflow tract and ventricle) using 1% formaldehyde in PBS for cells or in permeabilization PB2 buffer for embryonic tissues. Place the tubes on orbital shaker at a speed of 60 rpm at room temperature for exactly 10 min.
2. Stop the cross-linking reaction by adding glycine to a final concentration of 125 mM and incubate for 5 min at room temperature on the orbital shaker at a speed of 60 rpm.
2. Cell Lysis and Chromatin Fragmentation
1. Wash twice cross-linked cells resuspended in 10 ml PBS 1x or embryonic tissues resuspended in 1 ml PB2. Centrifuge at 1,000 x g for 5 min at 4 °C. Discard the supernatants.
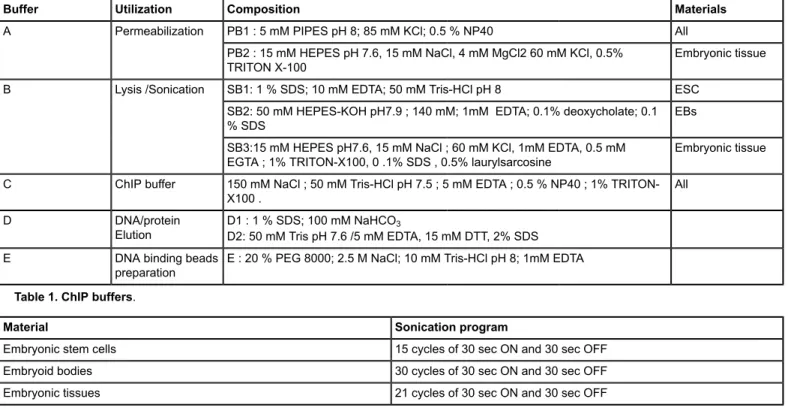
2. Add protease inhibitors to buffer PB1 or PB2 (2 µg/ml Leupeptin, 1 µg/ml Aprotinin, and 0.1 mM PMSF) (Table 1). Resuspend the cell pellet
or embryonic tissue from step 2.1 in 1 ml of Buffer PB1 or PB2 respectively. Pipet up and down and resuspend the cells or tissues. Use a 1 ml syringe with a 21 gauge needle to homogenize cells or tissue. Incubate at 4 °C (on a wheel) for 10 min.
3. Spin down at 3,000 x g for 5 min at 4 °C and discard the supernatant.
4. Resuspend the pellet in 300 µl of respective SB buffers (Table 1) supplemented with protease inhibitors in a clean tube (certified RNase-,
DNase-, and pyrogen-free) to prevent any DNA degradation. Incubate for 15 to 30 min on ice.
5. Sonicate the samples at 4 °C to shear the chromatin using a sonicator according to programs listed in Table 2 for each material. Adjust
sonication duration depending upon the next application (i.e., PCR or sequencing). Sheared DNA size should be around 500 bp for PCR and 300 bp for sequencing.
6. Centrifuge sonicated cell lysate for 10 min at 6,000 x g at 4 °C, transfer the supernatant (chromatin) in a clean 1.5 ml tube and discard the pellet.
7. Dilute the chromatin in solution (supernatant buffer B) for 10 times with water and assess the optical density using 1.5 µl in a nano-spectrophotometer. Obtain the concentration of proteins in µg/µl using the following formula: 1.55 x OD 280 - 0.76 x OD260.
Buffer Utilization Composition Materials
PB1 : 5 mM PIPES pH 8; 85 mM KCl; 0.5 % NP40 All A Permeabilization
PB2 : 15 mM HEPES pH 7.6, 15 mM NaCl, 4 mM MgCl2 60 mM KCl, 0.5%
TRITON X-100 Embryonic tissue
SB1: 1 % SDS; 10 mM EDTA; 50 mM Tris-HCl pH 8 ESC SB2: 50 mM HEPES-KOH pH7.9 ; 140 mM; 1mM EDTA; 0.1% deoxycholate; 0.1
% SDS EBs
B Lysis /Sonication
SB3:15 mM HEPES pH7.6, 15 mM NaCl ; 60 mM KCl, 1mM EDTA, 0.5 mM
EGTA ; 1% TRITON-X100, 0 .1% SDS , 0.5% laurylsarcosine Embryonic tissue C ChIP buffer 150 mM NaCl ; 50 mM Tris-HCl pH 7.5 ; 5 mM EDTA ; 0.5 % NP40 ; 1%
TRITON-X100 . All
D DNA/protein
Elution D1 : 1 % SDS; 100 mM NaHCOD2: 50 mM Tris pH 7.6 /5 mM EDTA, 15 mM DTT, 2% SDS3 E DNA binding beads
preparation E : 20 % PEG 8000; 2.5 M NaCl; 10 mM Tris-HCl pH 8; 1mM EDTA
Table 1. ChIP buffers.
Material Sonication program
Embryonic stem cells 15 cycles of 30 sec ON and 30 sec OFF Embryoid bodies 30 cycles of 30 sec ON and 30 sec OFF Embryonic tissues 21 cycles of 30 sec ON and 30 sec OFF
Table 2. Sonication Programs.
3. Immunoprecipitation and Washes
1. Wash 3 times Protein A-conjugated beads with buffer C . Take 100 µl of beads in a clean 1.5 ml tube and add 1 ml of buffer C (Table 1). The
2. Incubate antibody raised against modified histones or transcription factor (concentrations listed in Table 3) with 20 µl of washed Protein A
conjugated beads and 1 ml of buffer C supplemented with protease inhibitors in a clean 1.5 ml tube. Set the samples on a rotator at 40 rpm for at least 2 hr at 4 °C.
3. Wash antibody-beads complexes 3 times with 1 ml of buffer C (manipulation described in 3.1).
4. Prepare 2 tubes, one containing 150 µg of chromatin and antibody-beads complexes and the other tube containing 150 µg of chromatin and 20 µl of washed beads; Add 1 ml of buffer C supplemented with protease inhibitors to each tube and incubate the samples on a rotating wheel at 40 rpm overnight at 4 °C.
NOTE: The concentration of chromatin must be at least 300 µg to immunoprecipitate a transcription factor or for sequential ChIP.
Standard concentration (ng/µl) Volume (µl) Total DNA concentration (ng)
A 10.0 1 10.0 B 5.00 1 5.00 C 2.50 1 2.50 D 1.25 1 1.25 E 0.625 1 0.625 F 0.3125 1 0.3125 G 0.156 1 0.156 H 0.0 1 0.0
Table 3. Standards concentrations.
4. DNA Elution, Cross-link Reversal and Proteinase K Digestion
1. Set the samples in the magnetic rack. Recover the supernatant containing unbound antibody chromatin.
NOTE: Samples can be quickly frozen in liquid nitrogen at that step and stored at -80 °C. Chromatin can be used in other immunoprecipitation assays with other antibody. Wash each sample 3 times with 1 ml of buffer C (manipulation described before). 2. Elute the antibody-bound protein by adding 150 µl of buffer D1 or D2 if sequential ChIP has to be done (Table 1) to washed ChIP materials
and incubate the samples for 20 min at 50 °C in a heating block.
3. Remove tubes from the heating block and put samples in the magnetic rack, recover the supernatant in a clean 1.5 ml tube (certified RNase-, DNase-, and pyrogen-free) and discard the beads.
4. Use supernatant for a sequential ChIP adding 1 to 3 µg of the second antibody in 2 volumes of buffer C or reverse crosslink by adding 5 M NaCl to obtain a final concentration of 200 mM.
5. Prepare an input sample of chromatin in a clean 1.5 ml tube (certified RNase-, DNase-, and pyrogen-free) taking the same amount of chromatin as that of the IP sample (150 µg) in a final volume of 150 µl of water (RNase DNase free water). Add 5M NaCl to a final concentration of 200 mM. Incubate samples overnight at 65 °C.
6. Next day, remove samples from the heating block, add 250 mM EDTA to obtain a final concentration of 12.5 mM and proteinase K to obtain a final concentration of 250 µg/ml in the ChIP material and digest at 55 °C for 2 hr in the heating block.
5. DNA Isolation Using DNA-binding Beads
1. Preparation of beads
1. Start to bring the beads at room temperature for at least 30 min, vortex the beads very thoroughly. Beads settle down, so work fast when pipetting. Transfer 1 ml of beads in clean 1.5 ml tube (certified RNase-, DNase-, and pyrogen-free).
2. Set on magnet, wait for 2 - 3 min for the solution to clarify, discard supernatant. Remove from magnet, add 1 ml of 0.5 M EDTA and mix by brief vortexing.
3. Repeat step 5.1.2 twice, and discard supernatant at the end.
4. Remove from magnet, add 1 ml of buffer E and slowly resuspend the beads. Transfer the whole mix (beads in buffer E) into 50 ml of buffer E. Place on a shaker and let it mix slowly at room temperature for 1 hr.
5. Test DNA-binding beads following the purification protocol described below using 3 experimental conditions: 50 µl of beads/ 50 µl of DNA (1 volume/1 volume), 100 µl of beads/50 µl of DNA (2 volumes/1 volume) and 125 µl of beads/ 50 µl of DNA (2.5 volumes/1 volume). Let migrate purified DNA on a 1.5% agarose gel to check the size of the fragments (Figure 1A).
2. DNA Purification
1. Add 425 µl (2.5 volumes) of DNA binding magnetic beads to each DNA sample (about 170 µl). Resuspend slowly by pipetting up and down (about 10 times) and incubate at room temperature for 10 min.
2. Place on magnet for 5 min, then aspirate supernatant and discard (on magnet).
3. Add 600 µl of freshly made 80% ethanol to the tube on magnet, wait for 1 min, aspirate supernatant and discard and then repeat the previous step once more.
4. Give a quick spin, for 5 sec (microfuge), place the tube on magnet and remove the last drops of ethanol. Let dry for 1 min at RT 5. Elute the DNA by adding 20 µl of DNase RNase free water. Remove from magnet and vortex the sample.
6. Incubate for 3 min at room temperature and then place samples on magnet. Aspirate eluted DNA into a new tube (certified RNase-, DNase-, and pyrogen-free).
6. DNA Quantification Using a Fluorescence Detection Instrument
1. Serially dilute in water 1 μg DNA (1 kb ladder) to give a total of 7 dilutions plus a no-DNA point (dilutions gathered in Table 3).
2. Prepare a solution of PCR Green I dye, sufficient for all samples (purified DNA and standard dilutions A-H): dilute 10,000x the Green dye in 1x TE buffer.
3. Add 1 µl of each DNA samples (purified DNA and standard dilutions A-H) to 10 µl 1x green dye mix in capillaries cuvettes to be read in a fluorimeter at 488 nm wavelength. For the no-DNA assay, use 1 µl of the 1x TE buffer.
4. Build a calibration curve using a graphic software and determine the relative concentrations to the range of DNA samples in ng/µl. The DNA is then ready for PCR or to make sequencing libraries.
7. PCR
1. Selection of primers
1. Design primers of interest to interrogate the genomic regions of interest. Design primers to amplify enhancer regions of genes using the UCSC genome browser. Enhancers are further predicted using H3K4me1 or p300 ChIP-seq9 data available in GEO data set.
2. PCR
1. Run PCR reactions for 45 cycles (8 sec 95 °C, 8 sec 60 °C, 8 sec 72 °C) using a real-time PCR thermocycler in 25 μl green dye mix, 2 ng DNA, and 0.5 μl primer mix (20 μM stock solution)10.
3. Analysis of enrichment
1. Calculate Absolute enrichment assuming that at most 1% of nucleosome were immunoprecipitated11.
2. Consider the genomic as enriched if 10 ng IP samples show a greater enrichment when compared to 0.1 ng of input DNA. 3. Express results as the fold increase in enrichment over a non-enriched region after normalization to the input and adjustment with a
non-specific control sample.
4. Consider the input DNA to be diluted by 100 (dilution factor or DF).
5. Normalize the input using the following equation 2-ΔCt x 100%, where -ΔCt = Ct[IP] - Ct[Input x DF].
6. Adjust control using the following equation (ΔCt[IP]-ΔCt[NS]) where NS is the non-specific sample (no antibody IP, or IgG IP). 7. Calculate the fold enrichment of the sample as 2-ΔΔCt. A file including all steps of calculations with formulas in which only each PCR
sample can be entered will facilitate the analysis of results.
Representative Results
Figure 1A illustrates first the preparation of DNA-binding beads and quality control using DNA of different sizes (1 kb ladder). 0ne, 2 and 2.5
volumes (1 to 3) of beads was added to one volume of the sample to purify high and low molecular size DNA fragments.
Figures 1 B,C,D are typical examples of DNA gels from whole sonicated DNA extracted from mouse ES cells, embryoid bodies or a cardiac
embryonic region (pooled 25 E9.5 ventricles), respectively.
When ES cells differentiate toward a cardiac cell fate, they transit first through a mesendodermal and then a mesodermal state. Such a developmental journey includes a step by which epithelial cells have to undergo an epithelio-mesenchymal transition
Figure 2 shows PCR results following immunoprecipitation of modified histones. The experiment was designed to look at the epigenetic
regulation of epithelio-mesenchymal transition genes in wild type or gene-mutated cells when ES cells differentiate toward a mesodermal cell fate. Chromatin from wild type or mutated ES cells treated with a morphogen like BMP2 was immunoprecipitated using anti H3K4me1, H3K36me3 and H3K9me2 antibodies. Binding of modified histones is monitored by PCR of genomic (enhancers, A, B, C, D, E) regions of cadherin and twist genes.
Differentiation genes feature bivalent domains in ES cells12. Their 5' UTR regions close to their promoters are indeed occupied by both H3K4me3 a chromatin activating mark and H3K27me3, a repressed mark. These marks are modified when cells are challenged by morphogens such as BMP2 7. These marks are however variable depending upon the human ES cells lines likely because of the original blastocyst they derive from even when undifferentiated (Figure 3).
The protocols described above are suitable for ChIP sequencing even starting from a low amount of material; ChIP experiments were performed from chromatin extracted from AVC, OFT and ventricles of E9.5 mouse embryos in order to uncover novel genes and enhancers playing a role in defining the identity of these specific cardiac regions. Figure 4 shows 2 genomic regions of myocardial genes in the E9.5 mouse ventricle
Figure 1. Electrophoresis Data: DNA-binding Beads Checking and Sonication Validation. (A) DNA purified by DNA-binding beads, 1
volume of beads/1 volume of DNA (1) and 2 volumes of beads/1 volume of DNA (2) and 2.5 volume of beads/1 volume of DNA (3). Size of DNA fragments obtained after reverse crosslink of input fractions of mouse ES cells (B), embryoid bodies (C), and embryonic cardiac tissue (D). The
samples were run on 2% agarose electrophoresis gels. Please click here to view a larger version of this figure.
Figure 2. ChIP Data Analysis. (A) Enrichment of H3K27ac epigenetic mark on E-cadherin enhancers/promoter (A - E regions). (B) Enrichment
of H3K4me1, H3K36me3 and H3K9me2 epigenetic marks on Twist enhancers/promoter (A-C regions). Genomic regions are amplified by qPCR to measure the histone enrichment vs the input following ChIP. Results are means±SEM from 3 experiments. Please click here to view a larger version of this figure.
Figure 3. Sequential ChIP. Chromatin was extracted from 4 human ES cell lines and ChIP was performed sequentially using anti H3K4me3 and
then anti-H3K27me3 antibodies. Please click here to view a larger version of this figure.
Figure 4. ChIP from Chromatin Extracted from Specific Embryonic Cardiac Regions. Chromatin was extracted from 25 ventricles of
E9.5 mouse embryos (2 litters) lysed and sonicated. The anti-H3K27ac antibody was used for immunoprecipitation. The DNA was used for sequencing. The figure shows genomic regions of the cardiac genes Nkx2.5 and Tbx5 enriched in the modified histone and one genomic region of Shox2 pacemaker-specific gene not enriched and not expressed in the ventricle. Please click here to view a larger version of this figure.
Discussion
Epigenetics has become an important field of research in developmental biology. How a genetic program is activated in embryonic cells to allow the cells to acquiring a specific identity within an embryonic lineage has been for long time a key question for developmental biologists.
ChIP has been broadly used within the last years and combined to DNA sequencing following improvement in resolution of sequencing. This has become a powerful technique in order to investigate in a genome wide dependent manner the epigenetic landscape of cells or specific embryonic and adult tissues. The ChIP assay buffers and sonication conditions have been greatly improved to allow assays for small amount of biological material. This includes specific regions of embryonic hearts obtained by microdissection or by FACS-sorted cells expressing a fluorescent reporter protein. Indeed ChIP performed on heterogeneous cell populations 1314 can lead to misleading results that are difficult to interpret. The
epigenetic signature marks very accurately cell populations. That signature confers to them a specific potential of differentiation and determines their fate. It is thus important to work with purified (sorted) cell populations or dissected embryonic tissues.
We have described above robust protocols in order to achieve these goals. We have used these protocols for ChIP-PCR, ChIP on ChIP7, 10 or
been optimized to ensure a complete cell and nuclear lysis and efficient chromatin sonication. The protocols can thus be used for small amount of embryonic tissues.
Limitations of these protocols are inherent to ChIP. More specifically, the spatial resolution is not very high with DNA sizes around 500 bp. However, it allows us to investigate the dynamics of bivalent domains in differentiating ES cells7 and to reveal differences in enrichment of
modified histones on EMT gene regulatory regions in wild type or gene-mutated cells. (Figure 2). Deep sequencing of immunoprecipitated DNA
(Figure 4) partially overcomes this limitation.
Enrichment of a specific genomic region following immunoprecipitation of a transcription factor does not indicate for sure that the factor directly binds DNA. It could only be part of complex factory bound to DNA. This is an important point to be aware about. In contrast, gel retardation assay could be used to address the question.
Having the technology in hands combined with deep sequencing allows to monitor genome wide the genomic regions occupied by a transcription factors or a specific histone mark. The technology is improving and allows to interrogating only small cell populations15. It thus opens new
avenues in the dynamics of specific epigenetic landscapes during embryonic development.
Disclosures
The authors have nothing to disclose.
Acknowledgements
The authors acknowledge funding agencies, the IMI StemBANCC European community programme, the leducq Foundation (SHAPEHEART) and the Agence Nationale de la Recherche (Genopath)
References
1. Buckingham, M., Meilhac, S., Zaffran, S. Building the mammalian heart from two sources of myocardial cells. Nat Rev Genet. 6, 826-835
(2005).
2. Chen, T., Dent, S.Y. Chromatin modifiers and remodellers: regulators of cellular differentiation. Nat Rev Genet. 15, 93-106 (2014).
3. Collas, P. The current state of chromatin immunoprecipitation. Mol Biotechnol. 45, 87-100 (2010).
4. Gade, P., Kalvakolanu, D.V. Chromatin immunoprecipitation assay as a tool for analyzing transcription factor activity. Methods Mol Biol. 809,
85-104 (2012).
5. Scott, V., Clark, A.R., Docherty, K. The gel retardation assay. Methods Mol Biol. 31, 339-347 (1994).
6. Van Vliet, P., Wu, S.M., Zaffran, S., Puceat, M. Early cardiac development: a view from stem cells to embryos. Cardiovasc Res. 96, 352-362
(2012).
7. Leschik, J., Caron, L., Yang, H., Cowan, C., Puceat, M. A view of bivalent epigenetic marks in two human embryonic stem cell lines reveals a different cardiogenic potential. Stem Cells Dev. 24, 384-392 (2015).
8. Bonn, S., Zinzen, R.P., Girardot, C., Gustafson, E.H., Perez-Gonzalez, A., Delhomme, N., Ghavi-Helm, Y., Wilczynski, B., Riddell, A., Furlong, E.E. Tissue-specific analysis of chromatin state identifies temporal signatures of enhancer activity during embryonic development. Nat Genet. 44, 148-156 (2012).
9. Kim, T.K., Shiekhattar, R. Architectural and Functional Commonalities between Enhancers and Promoters. Cell. 162, 948-959 (2015).
10. Abboud, N., Moore-Morris, T., Hiriart, E., Yang, H., Bezerra, H., Gualazzi, M.G., Stefanovic, S., Guenantin, AC., Evans, S.M., Puceat, M. A cohesin-OCT4 complex mediates Sox enhancers to prime an early embryonic lineage. Nat Commun. 6, 6749 (2015).
11. Dahl, J.A., Collas, P. Q2ChIP, a quick and quantitative chromatin immunoprecipitation assay, unravels epigenetic dynamics of developmentally regulated genes in human carcinoma cells. Stem Cells. 25, 1037-1046 (2007).
12. Bernstein, B.E., Mikkelsen, T.S., Xie, X., Kamal, M., Huebert, D.J., Cuff, J., Fry, B., Meissner, A., Wernig, M., Plath, K., et al. A bivalent chromatin structure marks key developmental genes in embryonic stem cells. Cell. 125, 315-326 (2006).
13. Wamstad, J.A., Alexander, J.M., Truty, R.M., Shrikumar, A., Li, F., Eilertson, K.E., Ding, H., Wylie, J.N., Pico, A.R., Capra, J.A., et al. Dynamic and coordinated epigenetic regulation of developmental transitions in the cardiac lineage. Cell. 151, 206-220 (2012).
14. Stergachis, A.B., Neph, S., Reynolds, A., Humbert, R., Miller, B., Paige, SL., Vernot, B., Cheng, J.B., Thurman, R.E., Sandstrom, R., et al. Developmental fate and cellular maturity encoded in human regulatory DNA landscapes. Cell. 154, 888-903 (2013).
15. Brind'Amour, J., Liu, S., Hudson, M., Chen, C., Karimi, M.M., Lorincz, M.C. An ultra-low-input native ChIP-seq protocol for genome-wide profiling of rare cell populations. Nat Commun. 6, 6033 (2015).