HAL Id: hal-01996796
https://hal.umontpellier.fr/hal-01996796
Preprint submitted on 28 Jan 2019HAL is a multi-disciplinary open access
archive for the deposit and dissemination of sci-entific research documents, whether they are pub-lished or not. The documents may come from teaching and research institutions in France or abroad, or from public or private research centers.
L’archive ouverte pluridisciplinaire HAL, est destinée au dépôt et à la diffusion de documents scientifiques de niveau recherche, publiés ou non, émanant des établissements d’enseignement et de recherche français ou étrangers, des laboratoires publics ou privés.
Dmitryi Chalin, Sergei Rochal, Andrea Parmeggiani, Karima Kissa
To cite this version:
Nausicaa Poullet, Ivan Golushko, Vladimir Lorman, Jana Travnickova, Dmitryi Chalin, et al.. Me-chanical instabilities of aorta drive blood stem cell production: a live study. 2019. �hal-01996796�
1
Mechanical instabilities of aorta drive blood stem cell production:
1
a live study.
2
3
Nausicaa Poullet1, Ivan Golushko2,3, Vladimir Lorman2, Jana Travnickova1, Dmitryi Chalin3,
4
Sergei Rochal3, Andrea Parmeggiani1,2 and Karima Kissa1,*.
5 6
1
DIMNP, CNRS, INSERM, Univ Montpellier, Montpellier, France
7 2
Laboratoire Charles Coulomb, CNRS, Univ Montpellier, Montpellier, France
8 3
Faculty of Physics, Southern Federal University, 5 Zorge str., Rostov-on-Don, Russia
9 10 *Correspondence: karima.kissa-marin@umontpellier.fr 11 12 13 14 15
During embryogenesis of all vertebrates, haematopoietic stem/progenitor cells 16
(HSPCs) extrude from the aorta by a complex process named Endothelial-to-17
Haematopoietic Transition (EHT). HSPCs will then colonize haematopoietic organs 18
allowing haematopoiesis throughout adult life. The mechanism underlying EHT 19
including the role of each aortic endothelial cell within the global aorta dynamics 20
remains unknown. In the present study, we show for the first time that EHT involves the 21
remodelling of individual cells within a collective migration of endothelial cells which is 22
tightly orchestrated, resulting in HSPCs extrusion in the sub-aortic space without 23
compromising aorta integrity. By performing a cross-disciplinary study which combines 24
high resolution 4D imaging and theoretical analysis based on the concepts of classical 25
mechanics, we propose that this complex developmental process is dependent on 26
mechanical instabilities of the aorta preparing and facilitating the extrusion of HSPCs. 27
28 29
We dedicate this work to the memory of our friend and colleague, V. Lorman. 30
2 Introduction
32 33
Transplantation of human blood cells is essential to regularly save lives on a large-scale.
34
However, this method requires an exogeneous allogenic source to avoid histoincompatibility
35
as well as graft versus host disease associated problems. Currently, haematopoietic
36
stem/progenitor cells (HSPCs) can only be produced in vitro by methods involving genetic
37
cellular reprogramming. Different groups succeeded in it, however these approaches remain
38
scientifically and technically challenging 1–4. Moreover, the presence of transgenes in the
39
genome of reprogrammed human HSPCs represents an important clinical risk 5.
40
In order to develop new methods to generate HSPCs in vitro and control their fate after
41
transplantation, we need to further deepen our knowledge on blood cells ontogenesis at tissue
42
and organism levels, considering also novel features like biomechanical forces experienced by
43
HSPCs in physiological conditions. Indeed, the 3D in vivo structure of the tissue from which
44
HSPCs are generated is subjected to mechanical forces that influence cellular properties and
45
processes like cell migration, adhesion and polarity 6,7. Moreover, mechanical stress is known
46
to have a major impact on gene expression modulation and consequently on developmental
47
processes 8, inflammation and cancer 9.
48
In this article, we address for the first time the question of HSPCs production from the aorta
49
in relationship with the growth of the zebrafish embryo, the most widely used animal model
50
to study developmental processes in real time. We discuss and underline that, together with
51
haemodynamic forces, the growth of the whole embryo generate mechanical stresses on the
52
aorta and play a crucial role in blood production.
53
Previously, we and colleagues have demonstrated that HSPCs emerge in the Aorta Gonad
54
Mesonophros (AGM) region 10–13, from the ventral wall of the dorsal aorta (DA) 14–16. We
55
named this process Endothelial-to-Haematopoietic Transition or EHT 14. In zebrafish, EHT
56
takes place during a specific time window between 30 and 65 hours post fertilization
57
(h.p.f.)12,14,17 Systematic tracking of aortic endothelial cells (EC) in live embryos showed that
58
HSPCs emerge from the aortic ventral floor through a process that involves a strong shape
59
change followed by the egress of single cells from the aortic ventral wall into the sub-aortic
60
space 14. Moreover, we and colleagues observed that the extrusion of HSPCs was aborted
61
when the runx1 transcription factor essential for HPSCs emergence was inhibited14,18.
62
Surprisingly, this inhibition affected neither aorta formation nor any events preceding HSPCs
63
extrusion, such as aorta radius dilation and contraction. A more recent study has then put in
64
evidence with wealth of details the cytoskeletal processes occurring in the single cell
65
dynamics during the HSPC egress from the aorta19.
66
In the present study, with the help of 4D confocal microscopy, we follow and quantify at
67
tissue level, the whole aorta behaviour as well as the one of its cells throughout EHT between
68
24 and 72 h.p.f. We put in evidence important structural changes of the aorta and the
69
collective migration of its lateral cells down to the aorta floor prior to HSPC egress. These
70
phenomena result in a global aorta remodelling in terms of number and localisation of
71
endothelial cells, thus showing an ongoing global cellular reorganisation of the tissue that
72
assures aorta integrity during EHT. We then analyse the role of the actin cytoskeleton both in
73
emerging and neighbouring cells during the HSPCs extrusion process.
3
Based on these observations and applying general principles of mechanics to the novel
75
context of EHT, we relate the overall aorta remodelling and EHT egress to mechanical
76
instabilities. This cross-disciplinary analysis indeed reveals that mechanical instabilities,
77
induced by different stresses arising from the inhomogeneous growth of the aorta and its
78
interaction with surrounding growing tissues, play a key non-specific role in HSPCs
79
extrusion. Thus, not only haemodynamic forces, but also stresses induced by the global
80
zebrafish embryonic growth 17 are essential for haematopoiesis.
81 82
Results 83
84
EHT is associated with important aorta remodelling. To investigate the mechanisms 85
underlying EHT, we first carried out a 4D confocal microscopy imaging of this process in a
86
physiological context. For that, we image the trunk of zebrafish embryos (Fig. 1a) including
87
diverse structures such as the DA, the cardinal vein (CV), the notochord and the muscles
88
surrounding the DA (Fig. 1a-c) between 30 and 65 h.p.f.
89
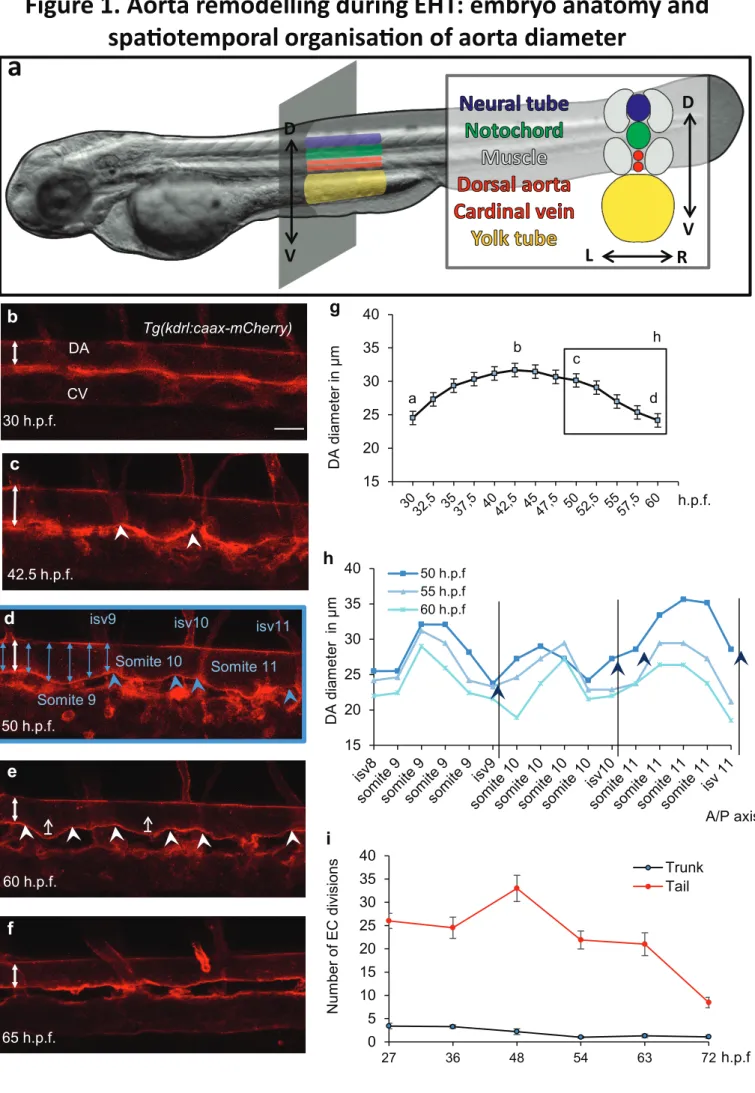
The imaging revealed strong changes of the morphology of the whole DA with time (Fig.
1b-90
f, Supplementary Movie S1). From 24 to 42.5 h.p.f., we observed a drastic increase of the 91
aorta diameter from 24±0.8 µm to 32±0.9 µm (Fig. 1c, 1g) followed by the emergence of a
92
pattern with alternating thinner and thicker diameter regions (Fig. 1c-d, 1g-h) with a relative
93
amplitude variation ranging from 17% to 33% the average aorta diameter.
94
At 42.5 h.p.f., the average diameter of the DA starts to decrease (Fig. 1f, 1g) and at 65 h.p.f.,
95
the aorta original cylindrical shape and diameter are restored which corresponds to the end of
96
EHT (Fig. 1d-f, 1g). To determine if there is a causal link between the change in aorta
97
diameter and cell extrusion, we followed the behaviour of individual cells leaving the DA
98
(Fig. 1e-f, arrowheads correspond to regions where HSPCs emerged). Our observations
99
showed that interestingly, HSPC extrusion rate peaks between 42.5 and 52 h.p.f. precisely
100
when the aorta diameter starts to decrease.
101 102
Aorta dilation is not associated with cell mitosis. To further assess EC behaviour during 103
aorta dilation and HSPC extrusion, we looked at EC division and whether an increase of cell
104
number can explain vessel expansion or compensate for HSPC emerging from the aorta floor.
105
We used a zebrafish transgenic line that expresses a marker of the S/G2/M phase of the cell
106
cycle, mVenus-zGeminin 20. This marker was specifically expressed under the kdrl promoter,
107
allowing visualization of ECs during mitosis 20. We quantified the number of EC divisions in
108
the trunk and in the tail between 27 and 72 h.p.f. We found that many division events occur in
109
the tail region (33.0±2.8 EC divisions at 48 h.p.f), allowing development of the Caudal
110
Haematopoietic Tissue (CHT) (Fig. 1i). In contrast, at the peak of EHT (at around 48 h.p.f.),
111
we quantified a mean of 2.2±0.6 ECs dividing in the whole AGM area (Fig. 1i), far under
112
what would have been needed to compensate for the estimated 25 HSPCs emerging from the
113
aorta during the whole AGM 14. Overall, between 27 and 72 h.p.f., we observed only a few
114
EC divisions in the trunk region: the total number of cells in this area essentially decreases
115
throughout the EHT process. Thus, additional surface area, for the aorta dilation and later for
116
integrity maintenance during HSPC extrusion, should be provided exclusively by cell
117
deformation.
4 119
HSPCs migrate collectively from the sides towards the ventral part of the aorta. To 120
quantify the precise contribution of each EC to the EHT process, we followed the fate and
121
behaviour of individual cells between 30 and 60 h.p.f. in the whole trunk region of the DA. To
122
do so, we used the double transgenic line kdrl:nls-GFP/kdrl:caax-mCherry, allowing
123
respective visualization of nucleus and membrane of ECs through time. We discovered that
124
ECs undergo substantial rearrangements in the trunk region between 30 and 45 h.p.f. (Fig.
2a-125
b). Interestingly, during this time window ECs migrate massively from the lateral side of the 126
DA to the floor (Fig. 2a-h with arrows). The number of cells in the DA floor peaks at about
127
40 h.p.f., when cell migration from the sides fully compensate for cell egress, and then
128
steadily declines afterwards (Fig. 2i) as lateral cells stop migrating towards the DA floor. The
129
decline is due to the extrusion of cells from the aorta floor into the sub-aortic space. The
130
number of ECs forming the dorsal aorta in the trunk region therefore strongly decreases from
131
the start to the end of the process (from 12.1±0.9 cells/somite at 30 h.p.f. to 7.9±0.3
132
cells/somite at 60 h.p.f., p-value=0.009) (Fig. 2a-c, 2i-j). Remarkably, the number of ECs
133
localized in the DA roof (facing the notochord) is essentially constant during the whole
134
process (Fig. 2i).
135 136
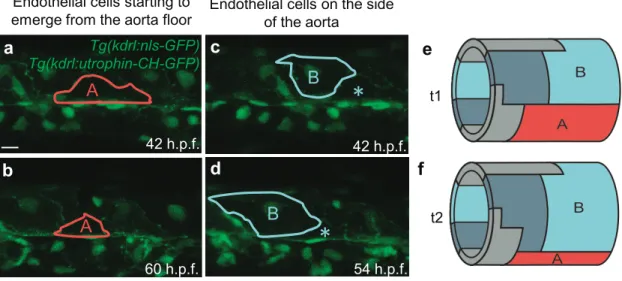
HSPCs extrusion requires collective EC morphology changes. In order to determine the 137
contribution of neighbouring ECs to the extrusion of HSPCs, we compared the morphology of
138
the emerging cells versus the morphology of their neighbours during EHT. Imaging of the
139
double transgenic line kdrl:utrophin-CH-GFP/kdr:nls-GFP allowed to visualize the
140
boundaries of each individual EC together with its nucleus. Quantification of the cell area
141
between 40 and 60 h.p.f. showed that both emerging cells and their neighbours undergo
142
drastic and rapid morphology changes (Fig. 3). The area of cells prior to their extrusion
143
significantly reduces and shape changes from flat endothelial to a round plate-like cell
(-144
69%±5% decrease in cell area) (Fig. 3a-b, 3e-g). In contrast, neighbouring lateral cells
145
increase their area comparably (+60%±9% increase in cell area) (Fig. 3c-d, 3e-f and 3h).
146
These data confirm that in the absence of divisions in the trunk region, the loss of cells
147
through EHT is mainly compensated by the deformation of the lateral ECs thus assuring
148
global aorta integrity.
149 150
Extrusion is finalized by actin ring closure around the emerging HSPC. We then focused 151
on the cytoskeletal activity of ECs to understand the mechanism of this dramatic cell-to-tissue
152
reorganization process. First, we used the kdrl:utrophin-CH-GFP line to mark stable F-actin
153
in ECs 21. 4D confocal imaging during the period of rearrangement (42-60 h.p.f.) showed that
154
EC junctions are highly dynamic and have tight cell-to-cell membrane boundaries
155
(Supplementary Movie S2). Because of the significant vascular cell deformation during
156
EHT, we then analysed the interplay between cytoskeleton activity and HSPCs shape during
157
the extrusion process. We imaged a double transgenic line
kdrl:utrophin-CH-GFP/kdrl:caax-158
mCherry showing respectively stable actin filaments and EC membranes. Live imaging
159
revealed that the aorta diameter decreases while HSPC extrusion in the sub-aortic space are
160
driven by the formation and closure of an actin ring surrounding the emerging cells (Fig. 4,
161
Supplementary Movie S1, Supplementary Movie S3) as also recently observed by Lancino 162
5
et al 19. Transverse view of the aorta shows that the emerging cell membrane and the actin
163
cytoskeleton co-localize to form a perfect circle that closes as the cell exits the DA floor (Fig.
164
4a-c Supplementary Movie S3). As the kdrl:utrophin-CH-GFP line displays a mosaic 165
expression, not all ECs express Utrophin-CH-GFP and we were therefore able to follow EHT
166
in cases where only the neighbouring cells expressed the GFP probe. In this scenario, we still
167
clearly observed the formation (Fig. 4a, 4d) and closure of the actin ring (Fig. 4b-c, e-f),
168
suggesting that the neighbouring cells also actively participate in the ring formation and actin
169
contractile dynamics.
170
In order to visualize all F-actin in the system, we also used a transgenic line expressing
171
Lifeact (a 17-amino-acid peptide that binds to filamentous actin) fused to green fluorescent
172
protein (GFP) 22. Vascular expression of Lifeact-GFP was driven by the VE-cadherin
173
promoter and this transgenic line was used together with kdrl:caax-mCherry to visualize EC
174
membrane as well. Imaging of VE-cad: Lifeact-GFP was consistent with the results obtained
175
with kdrl:utrophin-CH-GFP and we could follow the formation and closure of the actin ring
176
during EHT (data not shown).
177
To confirm the role of actin polymerization in HSPC extrusion, we treated embryos with
178
drugs blocking actin assembly, Latrunculin B or Rac inhibitor NSC23766. In treated embryos,
179
despite the presence of the aorta diameter modulation, the actin cytoskeleton was highly
180
disrupted and the formation of the actin ring surrounding the emerging cells was not observed
181
(Supplementary Fig. 2). Interestingly, the formation of typical plate-like cells in the aorta
182
floor preceding HSPCs extrusion was also not observed (data not shown). We also found that
183
in treated embryos some cells undergoing EHT bent toward the DA lumen: 33%±9% of cells
184
emerged toward DA lumen in Latrunculin B-treated embryos (Supplementary Fig. 2). These
185
results show the importance of actin polymerization for the acquisition of cell rigidity and the
186
direction of HSPCs extrusion from the aorta in the sub-aortic space.
187
We further looked at the role of the acto-myosin contraction in HSPC extrusion by subjecting
188
embryos to drugs blocking myosin contraction, Blebbistatin and ROCK inhibitor Y-27632.
189
The action of these drugs was very similar to that of the actin-blocking ones. The actin ring
190
surrounding emerging cells was not observed and HSPC exit took longer with some cells
191
undergoing fragmentation during the process (Supplementary Fig. 2).
192
To quantify the effect of actin polymerization and contraction blocking on haematopoietic
193
organs colonization such as the CHT by HSPCs, we treated cd41:GFP embryos, which
194
express GFP in HSPCs and thrombocytes 23, with Latrunculin B, Rho-kinase inhibitor
Y-195
27632, Blebbistatin and Rac inhibitor NSC23766. For all drugs, except with Rho-kinase
196
inhibitor Y-27632, we found that the number of HSPCs colonizing the CHT (cd41+ cells)
197
between 52 and 72 h.p.f. was significantly lower in treated embryos compared to control
198
(Supplementary Table 1). Live imaging of EHT reveals that HSPCs bend without achieving
199
complete extrusion. Part of them bents in the wrong direction, i.e. in the aorta lumen, while
200
others cells burst as previously observed after runx1 gene inactivation 14. Interestingly, none
201
of the drugs blocking actin polymerisation or contraction was found to affect EC
202
rearrangement occurring during the earlier stages of EHT (data not shown).
203
All together these results show that the acto-myosin cytoskeleton plays an essential role
204
mainly in the final step of EHT, precisely to complete the extrusion of HSPCs from the aorta
205
floor to the sub-aortic space.
6
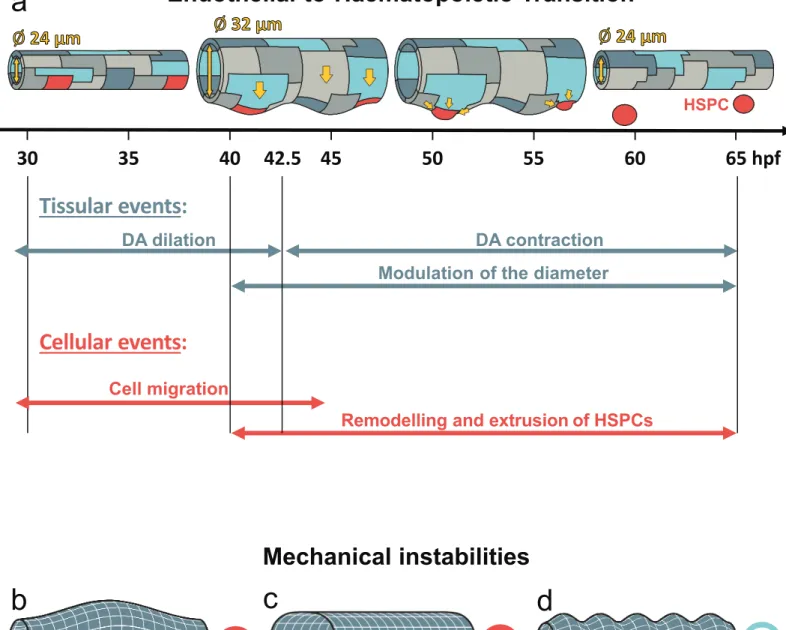
Cellular and tissular levels are dynamically coordinated during EHT. Structuring up our 207
observations, the EHT transition is a collective phenomenon organized on both tissular and
208
cellular spatial scales (Fig. 5).
209
At tissue level, EHT is organized in two phases. In the first phase, from 28 to 42.5 h.p.f. the
210
DA diameter increases (Fig. 1g and 5a). At 40 h.p.f. aorta’s shape of straight cylinder is
211
distorted by an average diameter modulation along the aorta longitudinal direction (Fig. 1h
212
and 5a). 213
During this first tissular phase, between 30 and 40 h.p.f., and concurrent with the diameter
214
modulation, at cellular level ECs reorganize themselves spatially and cells, localized on the
215
side of the aorta, migrate towards its floor. This cell migration is a quick process, which takes
216
on average 5.9h±0.7h (counted for 18 cells in 15 individuals).
217
The second tissular phase corresponds to the diameter reduction and the disappearing of the
218
diameter modulation up to the end of EHT (from about 42.5 to 65 h.p.f.). Here, global
219
morphological reorganization of DA is coupled with the dynamics of cells that, once localized
220
at the aorta floor, undergo a drastic morphological change, shaping from a flat EC to a round
221
plate-like cell. As cells round up, they undergo a strong antero-posterior contraction. In
222
parallel, neighbouring ECs increase their area and compensate for the surface reduction of
223
emerging HPSC cells and eventually for their extrusion. The whole cellular dynamics assures
224
aorta integrity while DA diameter decreases. This important morphology and identity tissular
225
and cellular remodelling take on average 9.2h±1.5h (counted for 6 cells in 6 individuals) and
226
occur between 37 and 55 h.p.f. The closure of the actin rings around the emerging cells allows
227
for their individualization from the aorta. The cellular extrusion and release from the aorta
228
take on average 7.5h±1.3h (counted for 10 cells in 10 individuals). Remnant ECs finally
229
complete the remodelling of the aorta by fully recovering its initial diameter and cylindrical
230
geometry (Fig. 1e-f and 5).
231 232
Discussion 233
234
In this article, we study and characterise the EHT process at the cellular and tissular level. We
235
quantify the temporal sequences of cells rearrangements, shape modifications, and their
236
coordination with cellular migration events, whilst the DA tissue takes a peculiar
tri-237
dimensional shape in the trunk region. Thanks to 4D imaging and drug treatment, we have
238
organized the EHT process in two different phases of DA dilation and contraction, and
239
analysed the cellular events occurring.
240
To decipher the mechanisms that control the DA shape at various stages of EHT, we discuss
241
here why the mechanical properties of the DA endothelium play an important role in the
242
global control of the spatiotemporal organisation of the DA.
243
In the last century, theoretical methods of classical elasticity have been successful to describe
244
instabilities in metallic pipes and similar mechanical systems that, once subjected to a critical
245
load, change their shape and buckle. More recently, the generalization and adaptation of linear
246
elasticity theory for the needs of biophysical systems has allowed the mechanical description
247
of living matter like lipid membranes, cells or tissues 24–26. Moreover, high susceptibility of
248
biological systems, residing near the critical point to the variation of external parameters, is
249
supposed to be often used in nature to control and regulate various processes 27.
7
We argue here that mechanical instabilities are involved in the DA shape transition during
251
EHT. More precisely, global variations of aorta shape in the trunk region assisting EHT are
252
the result of instabilities driven by mechanical stresses of various natures acting on the DA.
253
These stresses emerge spontaneously from the DA inhomogeneous growth and its interaction
254
with surrounding tissues rather than from genetically preprogrammed features of
255
embryogenesis. As a matter of fact, the specific diameter modulation in the lower part of the
256
DA appears even when the morphogenetic program of EHT is strongly altered under
257
inhibition of the runx1 transcription factor 14. Moreover, cytoskeleton-blocking drugs only
258
affect the final step of extrusion of HPSC, but not at all the previous phases involving the
259
cellular tissue remodeling and the global shape change of the DA.
260
The DA is formed by a single monolayer of cells contrary to an adult aorta multilayer
261
complex organization 14,28. Therefore, in first approximation, DA can be considered as a thin
262
cylindrical elastic shell. DA is much softer than metallic pipes, and its shape is finally defined
263
by the opposition of different active factors. These factors include: the inner hemodynamic
264
forces, the outer compressions exerted by the surrounding tissues due to embryonic growth
265
and development 17 and the in-plane stresses generated in the aorta tissue by ECs shaping and
266
migration as observed in our experiments. The typical timescales for such developmental
267
events are of several hours, thus much longer than the typical time of aortic elastic response to
268
the heart-beat (fractions of seconds), for instance 29,30.
269
Classical mechanics predicts that destabilization of a tubular membrane can be associated
270
with three main modes corresponding to various membrane deformations. These modes are:
271
Euler buckling (a tube’s longitudinal axis bends while cross-section remains circular, Fig.
272
5b), transverse buckling (axis of a tube remains straight, whereas its cross-section takes an 273
oval shape Fig. 5c) and “corrugation instability” (a tube preserves its rotational symmetry
274
along the main axis, but its radius is modulated along the main axis, Fig. 5d).
275
Euler buckling of the cylindrical tube can be invoked by the compressive stress along the tube
276
main axis. If the surrounding tissues were absent, the DA stability with respect to this mode
277
would have been determined almost exclusively by the bending rigidity of the tube wall.
278
However, as it is proven by the experiment, long-wave buckling instability is irrelevant for
279
the aorta, because notochord and other tissues surrounding the DA prevent its longitudinal
280
axis from bending (Fig. 1 and 5).
281
Transverse buckling of the cylindrical shell occurs when transverse isotropic (i.e. possessing
282
the rotational symmetry of the tube) stress in its walls reaches a negative critical value.
283
Stability with respect to transverse buckling is independent on the tension applied along the
284
tube axis and is determined by material constants characterizing the system. This type of
285
mechanical instability also occurs in ordinary rings31. Slightly elongated shape of aorta in the
286
dorsal-ventral direction is preserved throughout the whole process and in our opinion this
287
shape is due to an anisotropic compression applied by the muscles located on the sides of the
288
aorta rather than to the transverse buckling instability with spontaneous symmetry breaking.
289
On the contrary, deformation appearing in the DA prior to HSPCs extrusion has a
well-290
pronounced space periodicity and amplitude (Fig. 1c-e,1h, and Fig. 5) which makes it similar
291
to the corrugation deformation of an axially compressed thin-walled rigid pipe 32. Importantly,
292
space period and amplitude of the DA diameter modulation lay beyond the cell diameter and
293
thickness. As it was mentioned before, the blood pressure creates positive stress in DA walls.
294
Its longitudinal component can be calculated as σ=R ΔP/2h, where ΔP is a pressure difference
295
between the interior and the exterior of DA, R and h are DA’s radius and thickness
296
respectively. This positive stress cannot induce corrugation since it makes DA even more
8
stable. However, negative compressive stress (inducing the corrugation in the system) can
298
originate from the difference between the growth rates of the DA and the tissues around it. As
299
it is shown by our data at about 30 h.p.f., this negative stress eventually overpowers the
300
positive one associated with blood pressure and leads to the corrugation of the aorta. This
301
deformation occurs mainly in the ventral part of the DA where the migrating cells converge,
302
and the compressive stress is maximal. Later on, as the zebrafish embryo develops, exit of the
303
cells undergoing EHT decreases the effective stress due to the decrease of the equilibrium
304
surface area of the DA. Consequently, at about 65 h.p.f. the stress drops below the critical
305
value and the tube regains its initial not-deformed shape (Fig. 1f, Fig. 5).
306
As we show experimentally, chemical perturbation or inhibition of acto-myosin contractility
307
machinery seriously affects only the final event of EHT, i.e. the extrusion of the EHT cell
308
from the aorta endothelium. Very interestingly, we stress that the initial phases of EHT
309
resulting in DA shape distortion still occurs in presence of chemical perturbations. Moreover,
310
the deformation of HSPCs that are preparing to leave the aorta also occurs. What is different
311
is that, in the drug-treated specimens where the actin rings surrounding the cells are absent,
312
many cells do not bend outside (as usual) but do bend inside of the aorta. Based on this
313
observation, we hypothesize that the EHT process is also associated with additional shape
314
instability of individual cells forming the aorta endothelium. We believe that this second
315
instability is also provoked by the stress exerted on the DA tissue, whereas the polymerization
316
of the actin ring and the actin cytoskeleton activity insures the right direction of future HSPC
317
bending and further facilitates its extrusion in the sub-aortic space toward the cardinal vein.
318
In conclusion, by using 4D fluorescence microscopy, we have characterized qualitatively and
319
quantitatively different dynamical phases of EHT leading to the generation of circulating
320
hematopoietic stem cells from the DA. From the analysis of our observations on wild-type,
321
genetically-modified and chemically-treated zebrafish, we confirmed the important role of the
322
acto-myosin system in EHT single cell final extrusion 19,33. Other processes involving the
323
externalisation of a single cell from a cell layer, such as apoptotic extrusion from the
324
epithelial layer of the zebrafish embryo epidermis, confirm that actin/myosin contraction is
325
essential in this process 34.
326
In particular, we profiled a general mechanism based on mechanical instabilities that prepare
327
and support the whole EHT prior to a specific genetic control of the process. Importantly, our
328
interpretation suggests a generic and self-organized mechanism that drives unique collective
329
events of tissue reorganization such as EHT in the development and growth of complex
330
organisms.
331
Further on, it will be interesting to develop a more precise mathematical model for the
332
description of aorta dynamics and study EHT transition in other model systems. Since the
333
aorta of the zebrafish embryo consists in a limited number of cells, which decreases even
334
more during the EHT process, it will be important to combine an analytical continuum model
335
with a coarse-grained approach allowing for the description of individual cells, similarly to
336
ones used in 35–37,38, but generalized for a curved 2-dimensional surface in 3-dimensional
337
space.
338
We believe that further studies of EHT will shed light on complex HSPC genesis, a
339
fundamental example of developmental process with important applications in tissue
340
engineering and regenerative therapies, but also on mechanical processes resulting in the
341
development of pathologies. Finally, does mechanics prepare the tissue before genetic
342
reprogramming? It is a debate that is developed in this study in an illustrated way with the
343
example of HSPCs ontogenesis.
9 Methods.
345
Zebrafish husbandry 346
Tg(kdrl:Has.HRAS-mCherry) (here cited as kdrl:caax-mCherry)39 ,
Tg(kdrl:utrophin-CH-347
GFP), Tg(Cdh5:Gal4//UAS:lifeact:GFP)22, Tg(kdrl:nls-GFP)40, Tg(flk-1:mV-zGem)20 and
348
Tg(cd41:eGFP)23 were maintained, crossed, raised and staged as described previously 41,42.
349
All animal experiments described in the present study were conducted at the University of
350
Montpellier according to European Union guidelines for handling of laboratory animals
351
(http://ec.europa.eu/environment/chemicals/lab_animals/home_en.htm) and were approved by
352
the Direction Sanitaire et Vétérinaire de l'Hérault and Comité d'Ethique pour
353
l'Expérimentation Animale under reference CEEA-LR-13007.
354 355
Drug treatments 356
From 24 h.p.f. onwards, embryos were grown in PTU-containing medium to block
357
pigmentation. Embryos were dechorionated and treated with different drugs after the start of
358
circulation at 26 h.p.f. Drugs were dissolved in DMSO as stock solution and diluted in E3
359
medium up to 1% DMSO final concentration. Control embryos were subjected to the same
360
concentration of DMSO as treated embryos. Embryos were treated with 2µM Latrunculin B,
361
0.8µM Blebbistatin, 50µM Rac inhibitor NSC23766 for or 50µM Rho-kinase (ROCK)
362
inhibitor Y-27632. Embryos were kept in drug solution until image acquisition and
363
appropriate concentrations of drugs were added to the mounting medium for time-lapse
364
acquisitions.
365 366
Quantification of HSPC colonization using Tg(cd41:eGFP) 367
To quantify cd41+ cells in the CHT, embryos were imaged under a fluorescent binocular
368
scope Zeiss V12 at 100X at 52 h.p.f. and 72 h.p.f. Cd41+ cells were then counted using
369 ImageJ. 370 371 Microscopy 372
Fluorescence images of transgenic embryos were acquired using Zeiss LSM510 at 20X.
373
Time-lapse imaging was performed using Zeiss LSM510 at 20X or 40X magnification
374
essentially as described43. Embryos were anesthetised with tricaine (0.016%) and mounted on
375
a glass petri dish with 0.7 % low melting agarose and covered with standard E3 medium
376
supplemented with tricaine and 1-phenyl-2-thiourea (PTU) (0.003%) to prevent pigment
377
formation. Temperature was maintained at 28°C by placing the dish in a temperature-control
378
chamber during time-lapse acquisitions. Images were analysed using ImageJ and Imaris
379 (Bitplane). 380 381 382 383
10 Aorta diameter measurement
384
To measure aorta diameter Tg(kdrl:caax-mCherry) embryos were imaged using Zeiss
385
LSM510 as described above. Aorta diameter was measured manually using ImageJ at 10
386
different points along the trunk which were then averaged. To show aorta diameter evolution
387
through time, the aorta was measured every 2.5 hours in 5 embryos.
388 389
Cell surface area measurements 390
Cell surface area was measured using the Surface Contour tool of the Imaris software
391
(Bitplane). Briefly, the contour of a given cell was outlined on the different stacks where the
392
cell was visible using the Click drawing mode. The software then calculated automatically the
393
total cell surface area (µm²). A total of 6 ECs starting to emerge from the aorta floor and 5
394
ECs on the side of the aorta were analysed in 5 different embryos.
395 396
Statistical analysis 397
Normal distributions were analysed using Shapiro–Wilk test. Non-Gaussian data were
398
analysed using Wilcoxon or Kruskal–Wallis test, Gaussian with Student’s t-test or analysis of
399
variance followed by Holm’s multiple comparison. P<0.05 was considered as statistically
400
significant. Statistical analyses were performed using R software.
401 402
Bibliography. 403
1. Lis, R. et al. Conversion of adult endothelium to immunocompetent haematopoietic stem 404
cells. Nature 545, 439–445 (2017). 405
2. Batta, K., Florkowska, M., Kouskoff, V. & Lacaud, G. Direct Reprogramming of Murine 406
Fibroblasts to Hematopoietic Progenitor Cells. Cell Rep. 9, 1871–1884 (2014). 407
3. Riddell, J. et al. Reprogramming Committed Murine Blood Cells to Induced Hematopoietic 408
Stem Cells with Defined Factors. Cell 157, 549–564 (2014). 409
4. Lancrin, C. et al. The haemangioblast generates haematopoietic cells through a haemogenic 410
endothelium stage. Nature 457, 892–895 (2009). 411
5. Ivanovs, A. et al. Human haematopoietic stem cell development: from the embryo to the dish. 412
Development 144, 2323–2337 (2017). 413
6. Hamill, O. P. & Martinac, B. Molecular Basis of Mechanotransduction in Living Cells. Physiol. 414
Rev. 81, 685–740 (2001). 415
7. Eyckmans, J., Boudou, T., Yu, X. & Chen, C. S. A Hitchhiker’s Guide to Mechanobiology. Dev. 416
Cell 21, 35–47 (2011). 417
8. Modesto, K. & Sengupta, P. P. Myocardial mechanics in cardiomyopathies. Prog. Cardiovasc. 418
Dis. 57, 111–24 (2014). 419
9. Desprat, N., Supatto, W., Pouille, P.-A., Beaurepaire, E. & Farge, E. Tissue Deformation 420
Modulates Twist Expression to Determine Anterior Midgut Differentiation in Drosophila 421
Embryos. Dev. Cell 15, 470–477 (2008). 422
11
10. Gering, M. & Patient, R. Hedgehog Signaling Is Required for Adult Blood Stem Cell Formation 423
in Zebrafish Embryos. Dev. Cell 8, 389–400 (2005). 424
11. Tavian, M. & Péault, B. Embryonic development of the human hematopoietic system. Int. J. 425
Dev. Biol. 49, 243–50 (2005). 426
12. Murayama, E. et al. Tracing hematopoietic precursor migration to successive hematopoietic 427
organs during zebrafish development. Immunity 25, 963–975 (2006). 428
13. Kissa, K. et al. Live imaging of emerging hematopoietic stem cells and early thymus 429
colonization. 111, 1147–1156 (2008). 430
14. Kissa, K. & Herbomel, P. Blood stem cells emerge from aortic endothelium by a novel type of 431
cell transition. Nature 464, 112–115 (2010). 432
15. Bertrand, J. Y. et al. Haematopoietic stem cells derive directly from aortic endothelium during 433
development. Nature 464, 108–11 (2010). 434
16. Robin, C. et al. Human Placenta Is a Potent Hematopoietic Niche Containing Hematopoietic 435
Stem and Progenitor Cells throughout Development. Cell Stem Cell 5, 385–395 (2009). 436
17. Kimmel, C. B., Ballard, W. W., Kimmel, S. R., Ullmann, B. & Schilling, T. F. Stages of embryonic 437
development of the zebrafish. Dev. Dyn. 203, 253–310 (1995). 438
18. Chen, M. J., Yokomizo, T., Zeigler, B. M., Dzierzak, E. & Speck, N. A. Runx1 is required for the 439
endothelial to haematopoietic cell transition but not thereafter. Nature 457, 887–891 (2009). 440
19. Lancino, M. et al. Anisotropic organization of circumferential actomyosin characterizes 441
hematopoietic stem cells emergence in the zebrafish. Elife 7, (2018). 442
20. Fukuhara, S. et al. Visualizing the cell-cycle progression of endothelial cells in zebrafish. Dev. 443
Biol. 393, 10–23 (2014). 444
21. Burkel, B. M., von Dassow, G. & Bement, W. M. Versatile fluorescent probes for actin 445
filaments based on the actin-binding domain of utrophin. Cell Motil. Cytoskeleton 64, 822–32 446
(2007). 447
22. Helker, C. S. M. et al. The zebrafish common cardinal veins develop by a novel mechanism: 448
lumen ensheathment. Development 140, 2776–86 (2013). 449
23. Lin, H.-F. et al. Analysis of thrombocyte development in CD41-GFP transgenic zebrafish. Blood 450
106, 3803–10 (2005).
451
24. Golushko, I. Y., Rochal, S. B. & Lorman, V. L. Complex instability of axially compressed tubular 452
lipid membrane with controlled spontaneous curvature. Eur. Phys. J. E 38, 112 (2015). 453
25. Alstrøm, P., Eguíluz, V. M., Colding-Jørgensen, M., Gustafsson, F. & Holstein-Rathlou, N.-H. 454
Instability and “Sausage-String” Appearance in Blood Vessels during High Blood Pressure. 455
Phys. Rev. Lett. 82, 1995–1998 (1999). 456
26. Li, B., Cao, Y.-P., Feng, X.-Q. & Gao, H. Surface wrinkling of mucosa induced by volumetric 457
growth: Theory, simulation and experiment. J. Mech. Phys. Solids 59, 758–774 (2011). 458
27. Muñoz, M. A. Colloquium : Criticality and dynamical scaling in living systems. Rev. Mod. Phys. 459
90, 031001 (2018).
460
28. Santoro, M. M., Pesce, G. & Stainier, D. Y. Characterization of vascular mural cells during 461
zebrafish development. Mech. Dev. 126, 638–649 (2009). 462
12
29. Campàs, O. A toolbox to explore the mechanics of living embryonic tissues. Semin. Cell Dev. 463
Biol. 55, 119–130 (2016). 464
30. Wyatt, T., Baum, B. & Charras, G. A question of time: tissue adaptation to mechanical forces. 465
Curr. Opin. Cell Biol. 38, 68–73 (2016). 466
31. Landau, L. D., Lifshitz, E. M., Pitaevskii, L. P., Sykes, J. B. & Kearsley, M. J. Statistical physics. 467
Volume 5 of Course of theoretical physics. Part 1. 468
32. Timoshenko, S. & Goodier, J. N. Theory of Elasticity. (1951). 469
33. Guillot, C. & Lecuit, T. Mechanics of Epithelial Tissue Homeostasis and Morphogenesis. Science 470
(80-. ). 340, 1185–1189 (2013). 471
34. Rosenblatt, J., Raff, M. C. & Cramer, L. P. An epithelial cell destined for apoptosis signals its 472
neighbors to extrude it by an actin- and myosin-dependent mechanism. Curr. Biol. 11, 1847– 473
1857 (2001). 474
35. Bi, D., Yang, X., Marchetti, M. C. & Manning, M. L. Motility-Driven Glass and Jamming 475
Transitions in Biological Tissues. Phys. Rev. X 6, 021011 (2016). 476
36. Farhadifar, R., Röper, J.-C., Aigouy, B., Eaton, S. & Jülicher, F. The influence of cell mechanics, 477
cell-cell interactions, and proliferation on epithelial packing. Curr. Biol. 17, 2095–104 (2007). 478
37. Merkel, M. et al. Triangles bridge the scales: Quantifying cellular contributions to tissue 479
deformation. Phys. Rev. E 95, 032401 (2017). 480
38. Krajnc, M., Dasgupta, S., Ziherl, P. & Prost, J. Fluidization of epithelial sheets by active cell 481
rearrangements. Phys. Rev. E (2018). doi:10.1103/PhysRevE.98.022409 482
39. Chi, N. C. et al. Foxn4 directly regulates tbx2b expression and atrioventricular canal formation. 483
Genes Dev. 22, 734–9 (2008). 484
40. Blum, Y. et al. Complex cell rearrangements during intersegmental vessel sprouting and vessel 485
fusion in the zebrafish embryo. Dev. Biol. 316, 312–22 (2008). 486
41. Kimmel, C. B., Ballard, W. W., Kimmel, S. R., Ullmann, B. & Schilling, T. F. Stages of embryonic 487
development of the zebrafish. Dev Dyn 203, 253–310 (1995). 488
42. Westerfield, M. The Zebrafish Book. A Guide for the Laboratory Use of Zebrafish (Danio rerio), 489
4th Edition. (2000). 490
43. Renaud, O., Herbomel, P. & Kissa, K. Studying cell behavior in whole zebrafish embryos by 491
confocal live imaging: application to hematopoietic stem cells. Nat. Protoc. 6, 1897–904 492 (2011). 493 494 495 496
13 Acknowledgements
497
We thank Etienne Lelièvre for his critical reading of the manuscript, A. Sahuquet, C.
498
Chevalier, V. Diakou for their assistance and the MRI facility, N. Abdellaoui for management
499
of zebrafish facility. D. Stainier lab for Tg(Cdh5:Gal4//UAS:lifeact:GFP), S. Shulte-Merker
500
lab for Tg(kdrl:utrophin-CH-GFP) and Tg(kdrl:nls-GFP) and National Bioresource Project
501
Zebrafish for Tg(flk-1:mV-zGem). This work was supported by the ARC, FRM, ATIP-Avenir
502
fellowships and a fellowship from the Région Languedoc-Roussillon, Chercheur d’Avenir.
503
NP was supported by a fellowship from the ATIP-Avenir, SR and IG are grateful to the RSF
504
grant N 19-12-00032, AP, IG and SR acknowledge NUMEV (AAP-2016-2-025) for financial
505
support. I.G.’s thesis was funded by Campus France (Vernadsky Fellowship) and the
France-506
Russia Cooperation Program, and JT by a fellowship from the MESR and the FRM.
507 508
Disclosure of Conflicts of Interest 509
The authors declare no competing financial interests.
510 511 512
Figure 1. Aorta remodelling during EHT: embryo anatomy and spatiotemporal 513
organisation of aorta diameter. 514
a. Drawing showing the AGM localization in the trunk of a 48 h.p.f. zebrafish. Scheme of the
515
AGM in longitudinal or transverse views (grey boxes) consisting of the neural tube, the
516
notochord, the dorsal aorta, the cardinal vein, and the yolk tube. b-f. Still frames of time-lapse
517
imaging of Tg(kdrl:caax-mCherry) embryo from 30-65 h.p.f. Maximum projection from 40
z-518
stack spaced by 1µm. Double-headed arrows indicate difference of aorta diameter through
519
time. b-c. Between 30 and 42.5 h.p.f., DA diameter expands. Arrowheads indicate
520
localization of cells leaving the aorta and forming a local reduction of the diameter. d. Image
521
of Tg(kdrl:caax-mCherry) embryo at 50 h.p.f. to illustrate DA diameter measurements
522
throughout the length of 3 somites as represented in h. e. From 45 to 65 h.p.f., DA diameter
523
decreases, corresponding to the peak and then decline of EHT events. Arrows indicate the
524
contraction of the aorta occurring from the floor. f. After EHT, at 65 h.p.f, aorta floor
525
becomes flat. g. Graph showing aorta diameter variation in time measured every 2.5h in 5
526
embryos. Letters correspond to the according panels. Error bars represent standard error of the
527
mean. h. Graph showing variation of diameter along the antero/posterior axis at 3 time points:
528
50, 55 and 60 h.p.f. (Black box from g) in the embryo imaged in b-f. Dotted line indicates
529
intersomitic vessels. Blue arrowheads indicate localization of EHT cells leaving the aorta and
530
forming a local reduction of the diameter. i. Graph showing the number of EC divisions
531
(kdrl:mV-zGmn+ cells) occurring between 27 and 72 h.p.f. in the trunk and in the tail region,
532
n=10 cells. Note that a peak of division is observed in the tail region between 36 and 54 h.p.f.
533
corresponding to the formation of the CHT and its colonisation by HSPC. DA: dorsal aorta;
534
isv: intersomitic vessel; CV: cardinal vein. Scale bar: 25 µm. See also Supplementary Movie
535
S1. 536
14
Figure 2. Cells undergoing EHT are recruited from the side of the aorta and migrate to 538
its floor prior to extrusion. 539
a-c. From 30 to 60 h.p.f., still frames of time-lapse imaging of Tg(kdrl:ns-GFP)/Tg(kdrl:caax-540
mCherry) embryo. Maximum projection from 40 z-stack spaced by 1µm. Stars indicate the
541
nucleus of the ECs in the dorsal aorta in the 2 central somites of the image. d-h. Still frames
542
of time-lapse imaging of Tg(kdrl:nls-GFP)/Tg(kdrl:caax-mCherry) embryo. Maximum
543
projection from 40 z-stack spaced by 0.6µm. Cells migrating from the side of the aorta toward
544
the floor are numbered 1 and 2 in white. i. Graph showing the number of nuclei counted in 3
545
different zones of the dorsal aorta: roof, side and floor, n=5 cells. j. Schematic representation
546
of cell rearrangement occurring from 30 to 60 h.p.f. Colour coding of the cells corresponds to
547
the graph in i. DA: dorsal aorta; CV: cardinal vein. Scale bar: 25 µm (a-c), 10µm (d-h).
548 549
Figure 3. Endothelial cells adopt collaborative behaviour during EHT: cellular 550
contractions and extensions to maintain aorta integrity. 551
a-d. Still frames of time-lapse imaging of Tg(kdrl:nls-GFP)/Tg(kdrl:utrophin-CH-GFP) 552
embryo between 40 and 60 h.p.f. Maximum projection from 40 z-stack spaced by 0.6µm. Cell
553
A (highlighted in orange) is an endothelial cell located in the floor of the aorta and starting to
554
undergo EHT. Cell A surface reduces importantly between 42 h.p.f. (a) and 60 h.p.f. (b). Cell
555
B (highlighted in blue) is located in the side of the aorta neighbouring a cell undergoing EHT
556
(star). Cell B surface increases between 42 h.p.f. (c) and 54 h.p.f. (d). e-f Schematic
557
representation of EC surfaces and positions at t1 (e) and t2 > t1 (f). Colour-code and letters
558
correspond to the panel a-d. g. Graph showing the temporal evolution of EC starting to
559
emerge from the aorta floor in percentage of difference compared to area at 40 or 42 h.p.f.
560
Each line represents the measurements for one cell. 6 ECs starting to emerge from the aorta
561
floor were analysed in 5 different embryos. For details on cell area (µm²) calculation, see
562
Material and Methods section. h. Graph showing temporal evolution of cell area of lateral EC
563
in percentage of difference compared to area at 40 or 42 h.p.f. Each line represents the
564
measurements for one cell. 5 ECs on the side of the aorta were analysed in 5 different
565
embryos. Scale bar: 10µm.
566 567
Figure 4. Final contraction in EHT is actin-dependent and coordinated with 568
surrounding cells. 569
a-c. Horizontal reconstructed view from a maximum projection of a series of z-stack of a 570
Tg(kdrl:utr-CH-GFP)/Tg(kdrl:caax-mCherry) embryo during EHT at 42, 44 and 46 h.p.f.
571
Upper panels are kdrl:utrophin-CH-GFP alone and lower panels are merged images with
572
kdrl:caax-mCherry. Closure of the actin ring by the neighbouring cells is clearly observable
573
in the upper panels. See also Supplementary Movie S3. d-f. Single z-stacks of time-lapse
574
imaging of the same embryo as in a-c. Upper panels are kdrl:utrophin-CH-GFP alone and
575
middle panels are merged images with kdrl:caax-mCherry. Actin ring (arrows) closes around
576
emerging cell (arrowhead). Note that in this case the emerging cell does not express
Utrophin-577
CH-GFP due to mosaic labelling, allowing us to confirm the role of the neighbouring cells in
578
actin ring closure.
15 580
Figure 5. Overall schematic representation of Endothelial-to-Haematopoietic Transition 581
with mechanical instabilities. a. The EHT transition starts first by a global aorta dilation (as 582
soon as the heart starts to beat), taking place from 24 to about 42,5 h.p.f., followed by the
583
aorta contraction, occurring from about 42,5 to 65 h.p.f. While the embryo is growing and
584
developing, the first phase of aorta dilation is essentially characterized by cells that start to
585
increase their area, while others, in particular those located on the sides of the aorta, migrate
586
towards the ventral part (aorta floor). During this phase the characteristic modulation of the
587
aorta diameter, the corrugation instability (see main text and below), appears.
588
In the contraction phase, cells localized at the aorta floor undergo a drastic morphological
589
change, shaping from flat ECs to round plate-like cells. As cells round up, they undergo a
590
strong antero-posterior contraction. In parallel, neighbouring ECs compensate for the surface
591
reduction of emerging cells, and eventually for the extrusion of the latter cells from the aorta,
592
by increasing importantly their surface. Finally emerging round cells extrude and
593
individualize from the aorta. This phase coincides with the decrease of the diameter
594
modulation, recovering the initial aorta diameter and its cylindrical geometry.
595
b-c-d. The three main mechanical instability modes of a thin cylindrical soft pipe (membrane) 596
under mechanical stresses: b. Longitudinal buckling; c. Transverse buckling; d. Corrugation.
597 598
Figure 1. Aorta remodelling during EHT: embryo anatomy and
spatiotemporal organisation of aorta diameter
a
b
V D R L V Dd isv9 isv10 isv11
Somite 9 Somite 10 Somite 11 50 h.p.f. b DA CV 60 h.p.f. e Tg(kdrl:caax-mCherry) f 65 h.p.f. c 42.5 h.p.f. 30 h.p.f. 15 20 25 30 35 40 a b c d DA d ia m ete ri n µm h.p.f. h g DA d ia m ete r i n µm 15 20 25 30 35 40 50 h.p.f 55 h.p.f 60 h.p.f h A/P axis 0 5 10 15 20 25 30 35 40 27 36 48 54 63 72 Trunk Tail Nu m be ro f E C di vi si on s h.p.f i
h.p.f. Nu m be ro f c el ls / so m ite in th e A G M i 30 h.p.f. 45 h.p.f. 60 h.p.f. a b c Tg(kdrl:nls-GFP)/ Tg(kdrl:caax-mCherry) DA CV 30 h.p.f. 45 h.p.f. 60 h.p.f. * * * * * * * * * * * * * * * * * * * * * * * * * * * * * * * * * * * * * * * * * * * * * 1 2 1 2 1 2 1 2 1 2 28 h.p.f. 31.9 h.p.f. 33 h.p.f. 36.6 h.p.f. 36.8 h.p.f. d e f g h j
Figure 2. Cells undergoing EHT are recruited from the middle of
the aorta and migrate to its floor prior to extrusion.
0 1 2 3 4 5 6 30 35 40 45 50 55 60 DA roof DA side DA floor
Figure 3. Endothelial cells adopt collaborative behaviour during EHT:
cellular contractions and extensions to maintain aorta integrity.
40 h.p.f b 0 10 20 30 40 50 60 40 42 45 48 51 54 57 60 % o f d iff er en ce of c el la re a h.p.f. Endothelial cells on the side of the aorta
h
42 h.p.f.
54 h.p.f. 60 h.p.f.
42 h.p.f.
Endothelial cells starting to
emerge from the aorta floor Endothelial cells on the sideof the aorta
t1 t2 a b c d e f % o f d iff er en ce of c el la re a
g Endothelial cells starting to emerge from the aorta floor
h.p.f. -100 -80 -60 -40 -20 0 20 40 40 42 45 48 51 54 57 60 Tg(kdrl:nls-GFP) Tg(kdrl:utrophin-CH-GFP) A A B B
*
*
Figure 4. Final contraction in EHT is actin-dependent and
coordinated with surrounding cells.
c d b Tr an sv er sa l v ie w a b c b 44 h.p.f. 46 h.p.f. La te ra lv ie w 42 h.p.f. d e f 44 h.p.f. 46 h.p.f. 42 h.p.f.
Figure 5. Overall schematic representation of
Endothelial-to-Haematopoietic Transition with mechanical instabilities
Tissular events:
DA dilation DA contraction
Modulation of the diameter
Cell migration
Remodelling and extrusion of HSPCs