Supporting Information
Responsive Nanofibers with Embedded Hierarchical Lipid Self-Assemblies
Nguyen D. Tien1, 2, , Anjani K. Maurya1, 2, 3, Giuseppino Fortunato2, Markus Rottmar4, Robert
Zboray1, Rolf Erni5, Alex Dommann1, 3, René M. Rossi2, Antonia Neels1,6, Amin Sadeghpour1, 2,
*
1Empa, Swiss Federal Laboratories for Materials Science and Technology, Center for X-Ray
Analytics, St. Gallen, Switzerland
2Empa, Swiss Federal Laboratories for Materials Science and Technology, Laboratory for
Biomimetic membranes and Textiles, St. Gallen, Switzerland
3Cellular and Biomedical Sciences, Faculty of Medicine, University of Bern, Bern, Switzerland 4Empa, Swiss Federal Laboratories for Materials Science and Technology, Laboratory for
Biointerfaces, St. Gallen, Switzerland
5Empa, Swiss Federal Laboratories for Materials Science and Technology, Electron
Microscopy Center, Dübendorf, Switzerland
6Department of Chemistry, University of Fribourg, Fribourg, Switzerland
Present address: Department of Biomaterials, Institute of Clinical Dentistry, University of Oslo, Oslo, Norway
*Correspondence author: [email protected]
Number of pages: 5 Number of figures: 6
S2
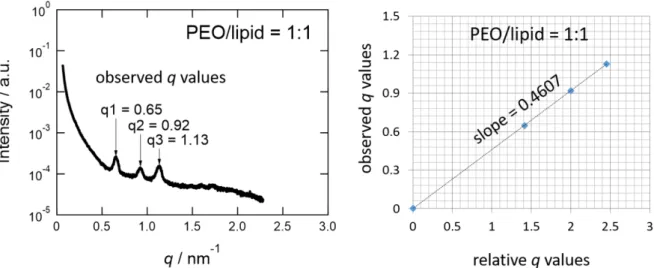
Calculation of lattice parameter:
The lattice parameter of cubic structure in cubosomes is calculated based on Bragg's equation taking into account of all observed diffraction peaks and the corresponding Miller indices. Therefore, the observed q values of three main diffraction peaks of cubosomes is plotted against the theoretical values. An example of calculation of lattice parameter for the sample at PEO/lipid = 1:1 as shown below.
Figure S1. The scattering profile of a cubosome-polymer mixture in solution (left). The linear correlation between experimental and theoretical peak positions (right) used for calculation of lattice parameter. The 110, 200, and 211 reflections are used.
The lattice parameter (LP) is calculated from the slope obtained from Figure S1 (right) by using Eq. 1.
Figure S2. SEM images of PEO (Mw = 300,000 g/mol) nanofibers at different concentrations.
It can be seen that higher concentration gives bigger fiber diameter. The mean diameters are calculated based on measurements of 50 fibers from the SEM micrographs using the ImageJ software (NIH, USA).
S4
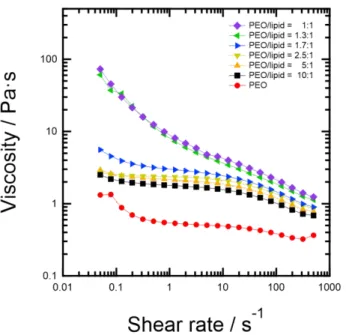
Figure S3. The viscosity of 5 wt% PEO solution increases by increasing the lipid cubosome concentration in the mixture and demonstrates the highest viscosity at the 1:1 weight ratio. All solutions exhibit a shear-thinning behavior: viscosity decreases again with shear rate.
Figure S4. The size distribution of nanofiber thickness obtained from image analysis of scanning electron micrographs for pure PEO and 1:1 PEO/lipid membranes prepared at 20% humidity.
Figure S5. Fourier transform infrared spectroscopy (FTIR) of pure PEO and PEO/lipid nanofibers. In PEO/lipid nanofibers, the strong peak at 1731 cm-1 is attributed to the C=O band
in glycerol monooleate (GMO) structure, which in turn confirms the existence of lipid mesosomes in fiber. FTIR analysis data were obtained using a Varian 640-IR, Australia. The signal resolution was 1 cm-1. A minimum of 16 scans was performed and averaged within a
range between 500 and 4000 cm-1.