Analysis of Outbound Process Defects at Amazon's ONT2
Fulfillment Center
by
Elizabeth Ann Ohrt
B.S. Chemical Engineering, Massachusetts Institute of Technology, 2011
Submitted to the MIT Sloan School of Management and the Institute for Data, Systems, and Society in partial Fulfillment of the Requirements for the Degrees of
Master of Business Administration and
Master of Science in Engineering Systems
In conjunction with the Leaders for Global Operations Program at the Massachusetts Institute of Technology
June 2016
0 2016 Elizabeth Ann Ohrt. All rights reserved.
The author herby grants MIT permission to reproduce and to distribute publicly copies of this thesis document in whole or in part in any medium now know or hereafter created.
Signature of Author
Signature redacted
MIT Sloan School of Management Institute for Data, Systems, and Society
May 6, 2016
Ctb_
Signature redacted
Certified by____
W'David Simchi-Levi, Thesis Supervisor Professor, Institute for Data, Systems, and Society and the Department of Civil and Environmental Engineering
Certified by
Signature redacted
Y. Karentheng, thesis Supervisor Assistant Professor of Operations Management
Accepted by_
Signature redacted
John N. Tsitsiklis, Clarence J. Lebel Professor of Electrical Engineering IDSS Graduate Officer
Accepted
by__Signature
redacted__
Maura Herson MASSACHUSETTS INSTITUTE Director of MBA Program, MIT Sloan School of Management
OF TECHNOLOGY
Analysis of Outbound Process Defects at Amazon's ONT2 Fulfillment Center
Elizabeth Ohrt
Submitted to the MIT Sloan School of Management and the Institute for Data, Systems, and Society on May 6, 2016 in partial Fulfillment of the Requirements for the Degrees of Master of
Business Administration and Master of Science in Engineering Systems
ABSTRACT
This thesis investigated two outbound process defects that result in damaged, late, missing or wrong-item shipments, leading to a poor customer experience and concessions for Amazon. Reducing these defects will improve customer satisfaction, reduce concession and re-work costs, and improve operations for last mile carriers, including Amazon Logistics. Investigation focused on two defects 1) missorted packages and 2) SLAM kickout errors. For each area, the process was mapped, data sources determined, statistical process control analysis performed and solutions implemented. For the sortation process, sort center data provides the most complete and timely view of process performance. Using this data control charts were created, providing a historical view of ONT2 process performance, enabling comparison to other sites and justifying the purchase of new equipment. A daily missort report was created and is delivered daily to ONT2 management to enable continuous tracking of sortation performance. Accurate data to track SLAM kickout defects was not readily available, so several existing metrics were used to develop a working understanding of primary defect drivers. A training gap was identified and re-training and auditing was performed. Post-implementation, the existing metrics indicated some improvement though the presence of confounding factors makes a definitive conclusion difficult. Recommendations for future work include incorporation and analysis of equipment data to create a leading indicator for missort defects. Concurrently, retrofits on the ONT2 flat sorter should be performed to reduce equipment-induced sortation problems. To reduce SLAM kickout errors, a metric should be created to track and correct human errors, and technology should be used to both reduce the need for re-processing and verify correct re-processing.
Thesis Supervisor: David Simchi-Levi
Professor of Civil and Environmental Engineering and Engineering Systems
Co-Director, Leaders for Global Operations, Department of Mechanical Engineering, Massachusetts Institute of Technology
Thesis Supervisor: Karen Zheng
Assistant Professor of Operations Management, Sloan School of Management, Massachusetts Institute of Technology
Acknowledgements
First, my thanks go to the staff of the Leaders for Global Operations (LGO) program and
representatives of Amazon for making this internship possible. I would also like to acknowledge my thesis advisors, Karen Zheng and David Simchi-Levi, for their guidance during my
internship and during the thesis-writing process. From Amazon, I would like to acknowledge my sponsor, Brian Donato, and manager, Scott Anderson, for their thoughtful support during the project. I had the privilege of working with a talented outbound team at ONT2, including Jose Garcia, Tim Lee, Ritchie Valtierra, Ryan Rau, and Eric McCarthy. Jordan Chen and Richard Artman contributed invaluable flat sorter knowledge. From Amazon Logistics, Hany Elkordy, Jordan Costen, and Ryan Bodnicki provided information about Amazon Logistics as a whole, and about their individual stations. Also, thanks to Spencer Chapman, Pat Dion, and my fellow LGO Eric Young for their SQL help. Finally, I greatly appreciated the statistics and SPC advice from my classmates Marshall Fox and Andrew Byron.
Glossary
Associate: An associate is the typical worker in an Amazon fulfillment center, with tasks such as picking, packing, etc.
Amazon Logistics (AMZL): AMZL is Amazon's own last mile delivery provider, currently operating in major cities. There are several AMZL delivery stations in the Los Angeles area. Critical Pull Time (CPT): The "critical pull time". Twenty to thirty minutes after this time a trailer must be loaded and virtually departed from the FC.
Gaylord: A large cardboard box, about five feet tall, into which sorted "flat" packages are diverted. The gaylord is then loaded onto a trailer for transport.
Jiffy mailer: A yellowish envelope used to pack small items and sorted on the flat sorter. Kickout: A package that did not "pass" the verification scan after auto-SLAM. A kickout could have a number of different defects, and will be manually re-processed by an associate.
Last mile carrier: A last mile carrier delivers packages from a distribution facility to a customer's door. Examples include UPS, FedEx, DHL and Amazon Logistics.
Missort: A package that arrives at the incorrect carrier facility or, for Amazon Logistics, at the incorrect station. For example, a package with a UPS shipping label is delivered to a FedEx facility by mistake.
Manifested Not Received (MNR): An error in which the last mile carrier virtually receives a package, but does not physically have the package in their facility.
Pallet Spur: A conveyor belt system on the outbound shipping dock that does not empty into a dock door, but rather into an empty area where boxes will be placed on pallets.
Promised Delivery Date (PDD): The PDD is the delivery date that is promised to the customer when they check out at Amazon.com.
Peak: The peak season begins in mid-November and continues until Christmas; this is the busiest time for the FC.
Received Not Manifested (RNM): An error in which the last mile carrier physically receives a package, but does not see the package ID number in their tech system.
SLAM: Stands for Scan / Label / Apply / Manifest, and refers to the step at which a shipment is weighed, the shipping method is calculated, and a shipping label applied.
Shipping Label: The shipping label is applied by the auto-SLAM machine or when a package is kicked out after the SLAM step. It contains the customer's name and address, the tracking number for the last mile carrier, and the encrypted shipment ID for internal Amazon tracking. Sort: A delivery method that specifies the carrier and the CPT (critical pull time), by which all packages that are a part of the sort must be loaded onto a trailer.
SpOO: A barcode label applied to a box after an item has been packed. After packing and before auto-SLAM, the spOO contains all order details for a particular shipment.
Virtual Physical Mismatch (VPM): A general term for the MNR and RNM errors discussed above.
Contents
ABSTRACT ... 3
Acknow ledgem ents... 4
G lo ssa ry ... 4 List of Figures ... 7 List of Tables ... 8 1. Introduction ... 9 1.1 A m azon Background... 9 1.2 Problem Statement ... 9 1.3 Project Approach... 10 1.4 Thesis Overview ... 10 2. Operations at Am azon.com ... 11
2.1 Am azon.com Fulfillm ent Process Sum m ary... 11
2.2 Overview of ONT2 Outbound Process ... 11
2.3 Overview of Am azon Logistics Sortation and Delivery ... 14
3. Literature Review ... 16
3.1 Process Capability A ssessm ent ... 16
3.2 Control Charts ... 16
3.3 Continuous Im provem ent... 17
4. Sortation A nalysis ... 18
4.1 Dock Package Sortation Detailed Process Description... 18
4.2 Flat Package Sortation Detailed Process Description ... 21
4.3 Sortation Perform ance M etrics... 24
4.4 Current Process Perform ance ... 28
4.4.1 Dock Package Perform ance... 29
4.4.2 Flat Package Perform ance Assessm ent ... 30
4.5 Cause and Effect Analysis... 32
4.5 Control Chart Creation... 34
4.5.1 Dock M issort Control Charts... 36
4.5.1 Flat M issort Control Charts ... 37
4.6 Solution Im plem entation... 39
4.7 Impact of Im plem ented Solutions ... 42
4.8 Recomm endations and Future W ork... 42
5. SLAM Analysis ... 44
5.1 Detailed Process Summ ary... 45
5.2 SLAM Perform ance M etrics ... 48
5.3 Current Perform ance Analysis ... 49
5.3.1 Quantitative Assessm ent... 50
5.3.2 Qualitative Assessm ent... 52
5.4 Cause and Effect Analysis... 52
5.5 Solution Implem entation... 54
5.6 Impact of Implem ented Solutions ... 55
5.7 Recom m endations and Future W ork... 55
6. Conclusions... 57
6.1 Sum m ary ... 57
6.2 Future Research Opportunities... 58
A p p en d ices... 5 9 Appendix I. ICQA Missort Audit Results - ONT2, October 2015... 59
Appendix II. SLAM Kickout Reprocessing PM V Diagram ... 60
List of Figures
Figure 1. ONT2 Outbound Process M ap ... 12Figure 2. Am azon Logistics Delivery Station Process M ap ... 15
Figure 3. Dock Sortation Process M ap ... 19
Figure 4. Flat Sortation Process M ap... 21
Figure 5. Delta Between Ship Date and Concession Report Date ... 25
Figure 6. Sort Center M issort Report... 28
Figure 7. AM ZL Returns M issort DPM O ... 30
Figure 8. Dock M issort Cause and Effect Diagram ... 33
Figure 9. Flat M issort Cause and Effect Diagram ... 34
Figure 10. P Chart of ONT2 Dock M issorts ... 36
Figure 11. P Chart of ONT6 Dock M issorts ... 37
Figure 12. P Chart of PHX6 Dock M issorts ... 37
Figure 13. P Chart of ONT2 Flat M issorts ... 38
Figure 14. P Chart of ONT6 Flat M issorts ... 39
Figure 15. P Chart of PHX6 Flat M issorts... 39 40
Figure 17. Missort Report - Week by Week View... 41
Figure 18. Auto Check Weight Error Label... 46
Figure 19. SLA M Process M ap ... 47
Figure 20. AMZL Performance Middle Mile Dashboard... 49
Figure 21. AMZL Package Returns ... 51
Figure 22. ONT2 Concessions, Summer and Fall 2016 ... 51
Figure 23. SLAM Defect Fishbone Diagram... 54
List of Tables
Table 1. A ir K nife O bservations... 311. Introduction
1.] Amazon Background
Amazon.com was founded as an online bookseller in 1994 and has since expanded into
consumer goods, electronics and entertainment media. The company's goal is to be "Earth's
most customer-centric company, where customers can find and discover anything they may want
to buy online" (Amazon.com, Inc. History, n.d.). While Amazon has branched out into other
industries, the company's primary business is still retail'. Most recently, Amazon has expanded
into online grocery fulfillment and last mile parcel delivery services. In 2014, Amazon launched
its own last mile carrier, Amazon Logistics (AMZL), with the intent to gain greater control over
the shopping and shipping experience, and to reduce shipping costs (Stevens, 2014). The creation
of AMZL will also enable Amazon to avoid a threat noted clearly in the company's 2014 Annual
Report: "We rely on a limited number of shipping companies to deliver inventory to us and
completed orders to our customers. If we are not able to negotiate acceptable terms with these
companies or they experience performance problems or other difficulties, it could negatively
impact our operating results and customer experience." (Amazon.com, 2014) The focus of this
thesis project is closely aligned with Amazon's goals of satisfying its customers and also
expanding Amazon Logistics.
1.2 Problem Statement
The goal of this thesis project was to reduce customer concessions by reducing outbound process
defects at the ONT2 fulfillment center (FC). A secondary goal was to reduce the impact of these
defects on last mile carriers, Amazon Logistics in particular. Outbound process defects lead to
damaged, late, missing or wrong-item shipments, resulting in a poor customer experience and concessions for Amazon. These concessions are a key performance metric for all FCs and are tracked on a weekly basis. In spring 2015, ONT2 increased focus on reducing outbound process defects in order to drive down concessions and reduce problems for downstream Amazon Logistics delivery stations.
1.3 Project Approach
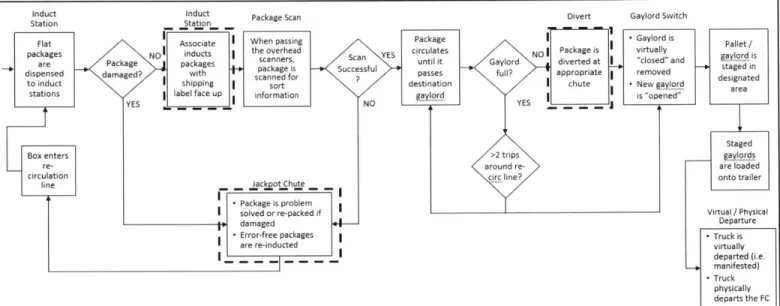
The approach used for this project is as follows: map the outbound FC process (Fig. 1), map the last mile carrier process (Fig. 2), determine quantitative and qualitative data sources to measure the impact of defects, data analysis, and report creation. The key steps under consideration are the SLAM and sortation steps for both "flat" packages (sorted by the flat sorter) and "dock" packages (sorted by the shipping sorter). Data sources for analysis include AMZL station feedback, AMZL package returns to ONT2, ICQA missort audit data and missort data collected at sort centers. Statistical process control tools were utilized to better understand defect root causes and quantify the current and historical process performance for the sortation step. Throughout the project, changes and re-training efforts were implemented, the results of which will be discussed in depth. Finally, a missort report was created that provides a more accurate, timely indicator of sortation performance for the managers at ONT2. Note that all numbers (axes, etc) in this thesis have been altered using a scaling factor in order to protect Amazon's
confidentiality.
1.4 Thesis Overview
This thesis will begin in Section 2 with a general overview of the Amazon.com fulfillment process, and a more detailed description of the FC outbound and Amazon Logistics processes.
capability assessment, control charts and continuous improvement. Section 4 will dive deeper into the package missort defect, along with the metrics used to measure performance, analysis completed and changes implemented. Section 5 will follow a similar outline for SLAM defects. Section 6 will close with a discussion of recommendations and suggestions for future work. Throughout this thesis defects will be reported in terms of defects per million opportunities (DPMO), which is frequently used to describe small defect rates. Defect DPMO has been adjusted using a scaling factor in order to protect Amazon's confidentiality.
2. Operations at Amazon.com
2.1 Amazon. com Fulfillment Process Summary
When an order is placed and assigned to an FC, the item is then assigned to a picker who picks the item from a shelving unit and places it in a tote. Next, the item is routed via tote to a packer, who packs the item into a pre-determined box or jiffy mailer (yellow envelope) as specified on the computer screen. The packaged item travels down a conveyor belt to the "SLAM" (Scan / Label / Apply / Manifest) step, where the package is weighed, an algorithm is run, and the shipping label is applied. If the package is defect-free, it is sorted on the shipping sorter if is a large box, or on the flat sorter if it is a smaller box or jiffy mailer. After sortation, the package is loaded onto a truck and then departed to a carrier facility. This process will be described in more depth below.
2.2 Overview of ONT2 Outbound Process
The focus on ONT2's outbound processes begins when the item is packed into a box. The relevant steps are illustrated and detailed below:
Shffie Sxtrr Fluid Load or
Shipping Soer - Pall rtize
Fack --- \ -+ A to SLA - - -- L)ad Irick - + Depart C
Ve iationI
S Flat Sorter - - -
-Mmml STAM
Figure
1.
ONT2 Outbound Process Map* When the item is received by the packer it is scanned, and a box or jiffy mailer size is assigned based on the item's dimensions and weight. The packer builds the box, puts in the item, and adds protective "dunnage" (air-filled plastic cushioning material). They then seal the box /jiffy mailer, scan and apply a "spOO" label, and place the package on the conveyor belt. The spOO label now contains all the relevant information about the order, including the item in the package, the customer's address and the PDD (promised delivery date).
* The box / jiffy mailer travels down the conveyor belt until it reaches the auto-SLAM machine, which applies the shipping label. Just before the package reaches the
auto-SLAM machine, the spOO is scanned and an algorithm is run to calculate the appropriate
shipping method and carrier. The algorithm takes into account when the package needs to arrive to the customer (the promised delivery date, or PDD), the destination, the weight and size of the package and finally, the cost of shipping. When the best method has been determined, the auto-SLAM machine applies the shipping label. Included on the shipping
label are the customer's name and address, the carrier's name (UPS, FedEx, etc.), a
number is used by the last mile carrier for routing and sortation. It has no particular relevance to the FC, and a new tracking number is generated for the same order every time a new label is printed. This is an important point when discussing SLAM errors in Section 5. The encrypted shipment ID is used by Amazon to track the package after the shipping label has been applied. It can be decrypted and searched in several different Amazon tech systems to see where the package should be in the fulfillment process. The encrypted shipment ID stays the same no matter how many times the shipping label is printed for a single order.
* After auto-SLAM, the package receives a verification scan in which the shipping label is scanned to ensure it will be readable in later scans. If it is not, or if a number of other errors occurred during the process the package will be "kicked out", or diverted, to a station where an associate will manually resolve the error. More on this error resolution step, called manual SLAM, in Section 5.
* Packages that pass the verification scan continue on to one of two sortation processes depending on their size. "Dock" packages (those greater than three inches in height) are routed to the shipping sorter, where the encrypted shipment ID is scanned and the package is assigned to the appropriate dock door based on the sort code. Depending on the "sort", or specific departure time and carrier, dock packages will be either fluid
loaded or palletized. For a fluid loaded sort, the packages are loaded directly into the back of a trailer, while packages for a palletized sort are built into a solid structure on a
standard wooden pallet. "Flat" packages (those less than three inches in height) are routed to the flat sorter where an associate inducts the package onto the flat sorter equipment.
shipment ID on the label is scanned, and the package is assigned to the appropriate chute based on its sort code. When the package reaches the assigned chute it is diverted into a gaylord, a large cardboard box that can hold up to 800 packages.
* Dock packages are loaded onto the trailer either via fluid loading or on pallets. Finally, the gaylords with flat packages are added to the trailer. The trailer is departed, physically and virtually, to the last mile carrier facility.
2.3 Overview ofAmazon Logistics Sortation and Delivery
Amazon Logistics (AMZL) was created in 2014 to be Amazon's internal last mile carrier, providing Amazon with the opportunity to own the full customer experience. The organization's vision statement includes the following:
"The goal ofA MZL is to disrupt the traditional logistics industry by providing the lowest delivery cost, highest quality and fastest delivery service, regardless of route density, to Amazon's customers globally..."
Currently, a fraction of ONT2's outgoing volume is sent to the delivery stations in Los Angeles, San Diego and San Francisco. The L.A. delivery stations were of particular interest for this project because they were close enough to visit, and managers at these sites provided important
information for this thesis. Packages destined for an AMZL site are handled in much the same way as packages that are sent to a UPS or FedEx site: dock packages are either fluid loaded
directly into the back of a trailer, or they are palletized and then loaded into a trailer. Flat packages are sorted into gaylords, and the gaylords are then loaded.
Scan Manualhy Pre-Depart Deliver to Ariv
eat
Unload onto TrakniI Sort Based Sa nLoad ino Customer Routmg- Number Totes Vehicle Return to
Sticker Station
Figure 2. Amazon Logistics Delivery Station Process Map
Once a package reaches the delivery station, the general process is as follows:
* Packages are unloaded from the trailer, pallet or gaylord onto a conveyor belt. At this time, wrong carrier or wrong station missorts may be visually identified and sidelined for return to the FC.
" Packages are hand-scanned, a route sticker is applied, and they are put back on the conveyor belt. If the package is not manifested or has another defect, an "Error" sticker will print and the package is sidelined for problem solving. This will happen if there was
a SLAM error that occurred in the origin FC, as will be discussed in Section 5, or if the package is a missort that was not previously identified.
" The packages are manually sorted to large racks based on their route number, given a pre-depart scan to reduce intra-station missorts, loaded into totes (or bags) and staged for departure when the delivery vehicles arrive.
* Delivery Associates (DAs) load the totes into their vehicles, depart for their route and return any undeliverable packages at the end of the day. Depending on the issue,
undeliverable packages may be re-injected the same or the next day. After three delivery attempts, the packages are returned to ONT2, even if they did not originate at ONT2. Un-routable packages (those that are damaged, wrong-station or wrong-carrier missorts, have a manifest issue, or some other defect) are also returned to ONT2.
3. Literature Review
3.1 Process Capability Assessment
One of the first steps in this project was to assess the current performance of the sortation and SLAM processes. (Cachon & Terwiesch, 2009) state that when assessing process capability and using statistical process control methods, "the importance of data collection cannot be
overemphasized". After data collection, current performance should be compared with
performance standards (NIST/SEMATECH e-Handbook of Statistical Methods, 2013), however in this case there were minimal pre-existing performance requirements. For sortation, there was only an estimate of missort DPMO across the North American network, and SLAM defects were incorporated into the aggregate concession DPMO target.
While SLAM performance capability assessment was not achieved in the course of this project, sortation performance was determined. The literature lists several tools as being important in establishing an understanding of process performance, including histograms, control charts and regression analysis to detennine the relationship between process variables and process output (Montgomery, 2009). All of the above were valuable inputs in establishing sortation process capability understanding.
3.2 Control Charts
Control charts were a critical part of this project, initially in establishing a baseline for historical sortation process performance. As noted by Haridy, the primary use for control charts is to "quickly detect the occurrence of assignable causes of process shifts" or rather, determine if the process is in control or out of control (Haridy, Wu, Lee, & Rahim, 2014). However, there are several additional benefits to control charts including determining the process mean and standard
deviation, and providing a visual representation of the process performance (Cachon & Terwiesch, 2009). Montgomery continues that "use of a control chart is an excellent way to reduce variability", and that corrective action should be taken as soon as the process
characteristics plot outside the upper or lower specification limits on a control chart (Montgomery, 2009).
Several different types of control charts can be used depending on the process and the parameters under investigation. The type used in this project is an attribute control chart (or p chart), as compared to a variable control chart (or k bar chart), in order to measure the proportion of defective (missorted) units. (Cachon & Terwiesch, 2009) caveat that with attribute control charts the sample size must typically be much larger than with variable control charts, especially when defects are rare. This caveat informed the choice of sample size (a day's worth of sort center volume) since missorts are somewhat rare at ONT2.
3.3 Continuous Improvement
Determining a robust data source, establishing a baseline for process performance and creating control charts to continually monitor the performance against statistically determined
specifications are enablers of continuous process improvement. The benefit of using data and control charts is gaining the ability to base process improvement meetings on facts and discuss a path forward objectively (Cachon & Terwiesch, 2009). While there are many available
frameworks and tools to aid continuous improvement efforts, employee engagement is one of the most important contributors to success (Brajer-Marczak, 2014). Providing a readily available data source (a missort report) and getting management buy-in were priorities for this project in order to ensure the feasibility of continuous improvement projects.
4. Sortation Analysis
Sortation defects resulting in missorted packages are one of two main areas of study for this thesis. For each section, dock package and flat package missorts will be addressed jointly when discussing general missort issues, and separately when different root causes and remedies apply. This section will first describe the dock and flat sortation processes in greater detail, then discuss the metrics used to gauge performance and the process performance at the time of study. The statistical process control techniques of interest will be described, as well as the solutions implemented and the recommendations moving forward.
4.1 Dock Package Sortation Detailed Process Description
After the auto-SLAM step, dock packages are routed to the shipping sorter, where the encrypted shipment ID is scanned and the package is assigned to the appropriate dock door based on the
sort code. If the assigned lane is full (and the andon light is flashing blue, or "blue lighting") the package will recirculate on the shipping sorter a maximum of three times, at which point it will reach "max re-circ (recirculation)" and be kicked out at the "jackpot lane". The package will be problem solved by an associate if necessary and then the package will either be manually taken to the appropriate door, or re-inducted to the shipping sorter.
Mezzanine Dock
Indicates movement from second floor to
4. Dock Sort first floor Virtual / Physical
Conveyor ~~ Fluid Loading Departure
- Box travels down Truck is virtually
Bai entspiral to conveyor beit departed (ie.
+ o yore sl YES NO Fluid YES - Box is loaded onto manifested)
conveyor belt shipping Line full? load? trailer - Truck physically
Shipping label label? departs the FC
is scanned
NO YES NOL
- Box travels Bos is
down Large ND IO addeo Two sDOds
Box enters boa tnpd spr I s are
re- NO around pallet spur / yod scanned Palt
cirClation re-c -Lb r gaylord is Pallet / gaylord
line Labels are staged in is loaded onto
fourcsides designate trailer
Box is d area
added - of pallet/
Problem Solve to pallet aylord
-Package is directed to - - Package is manually
problem solve line on transported to
dock appropriate dock door
Dock associate Package is loaded onto
Indicates action reprocesses package pallet or into truck
step Jlt rno uk
Indicates - Package is manually
decision step transported to
appropriate dock door Package is loaded onto T
pallet or into truck I
SJ
Figure 3. Dock Sortation Process Map
As noted earlier, dock packages will either be fluid loaded or palletized. High volume sorts,
including one AMZL sort at ONT2 at the time of study, are typically fluid loaded. During this
process, between one and three associates will build a wall of boxes to maximize the "cube"
usage (i.e. volume) of the trailer. If the conveyor belt leading into a given dock door is full, its
andon will "blue light" and become unavailable to the packages on the shipping sorter; packages
that hit max re-circ on the shipping sorter during this time will be kicked out at jackpot. When
sortation volume is heavy, associates may put boxes that should be fluid loaded in gaylords.
Missorts resulting from human error occur during this step if an associate is not closely watching
where they are putting each package.
For lower volume sorts, including most AMZL sorts, packages are routed to a pallet spur. Here,
associates build pallets by hand scanning each package to the pallet location and placing the box
on the pallet. When the pallet is full, it is wrapped in plastic to hold it together and staged in a designated area. Two spOO labels from packages on the pallet are scanned to uniquely identify the pallet. The pallet is scanned to the staging location and then again to the trailer. Packages from different sorts may be mixed on a pallet spur, increasing the chance of mis-sortation. Sorts were mixed on at least two pallet spurs at ONT2.
There are several opportunities for missorts to occur (Fig. 3; bold dashed lines represent steps when missorts can occur). The first is after the package is diverted to the jackpot or problem solve lane. After re-processing (if needed), the package will either be re-inducted on the shipping sorter or it will be placed on a cart with packages from the same sort and manually taken to the appropriate dock door. If an associate misplaces a package on the incorrect cart, it could result in a missort as there are no further formal checks to ensure the package is in the correct place.
For those packages that are palletized and on a "mixed" pallet spur containing several sorts, there is an additional missort opportunity. Although associates must scan each package and then scan the destination location (in the form of a QR code or bar code on a pallet or gaylord) it is still possible to misplace a package when pallets or gaylords for different sorts are in close proximity.
Finally, on rare occasions entire pallets or gaylords can be "missorted" if they are placed in a trailer destined for the incorrect trailer. This is not common and was not a major focus of this project.
Although manual errors such as package misplacement may seem trivial and unlikely, associates work ten-hour shifts, with just an hour break total during that time. Fatigue, the repetitive nature of the work, and frequent process and layout changes can easily lead to mistakes. The individual
root causes of the human errors that result in missorts were difficult to quantify for this project,
so the focus was primarily on improving the processes that might lead to missorts.
4.2
Flat Package Sortation Detailed Process Description
After auto-SLAM, flat packages (those less than three inches in height) are routed to the flat
sorter. The flat sorter is a large, oval piece of equipment, consisting of induct stations, a
circulating conveyor belt, and diverts (or chutes). At ONT2 there are eighty to ninety different
chutes, not all of which are in use at any given time.
induct Package Scan Station
Z Associate i When passing N 1 nlucts the overhead
Pa >O Ng
~ut
scannersPackage, -tk package i
., daged? / w'th cannec fer
shipping s5nt
abel face up inormat on YES jackot Chute Package is problem soved or re-packet if -- damaged Error-free packages are re-iducted
Divert Gayltrd Scitch
Package Gaylord is
circulates NO Package s virtuali alldt
Sc S until it / Gay ord diverted at closed" an a passes f? appropriate removed staged in
destinat on I cl'te - New gaylorn d ae
doaenerea
NO aylordYES
Staged
>2 trips gayolcs
around re- are loaded
ic line? onto trailer
- -Virtual / Physical Departure .Truck is virtually departed (ie manifested) -Truck physically neparts the FC
Figure 4. Flat Sortation Process Map
Packages are directed to induct stations at regular intervals, provided that the station is active and not too full, such that each station has 20-40 packages. There are four induct stations on each side of the flat sorter. At the station, an associate inducts the package onto the flat sorter conveyor belt with the label facing up. Then, the package is assigned to a position on the main part of the equipment, called a carrier plate. A carrier plate is about 18 square inches in size and
consists of a conveyor belt on a metal frame. The conveyor belt will spin in order to direct the
induct Stat Ion Flat packages are dispensed to induct stations Box enters re-circuiation
4
0package into a chute. There are two cameras on opposite sides of the flat sorter. When the package passes underneath one of these cameras, the encrypted shipment ID on the label is
scanned, and the package is assigned to the appropriate chute based on its sort code. When the carrier plate passes the chute, the belt spins and the package is diverted into the gaylord. If the appropriate gaylord is full or the chute is turned off (the gaylord is unavailable), the package will recirculate ("re-circ") a maximum of three times on the flat sorter before it is kicked out at jackpot, where packages with other defects are also kicked out. Here, the package will be
problem solved and / or re-inducted. Immediately after the jackpot chute there is a device called an air knife, which will shoot a puff of air towards a carrier plate when directed. The air knife will fire if the camera detects any anomalies with the carrier plate, including a package that is not fully on the plate (and thus at risk of being mis-diverted), or a barcode that could not be read. The purpose of the air knife is to ensure that overlapping packages or very light packages are diverted to the jackpot lane.
There are several opportunities for missorts to occur in this process (Fig. 4; bold dashed lines represent steps when missorts can occur), from induct to divert, due to human, technology and mechanical errors. Typically, missorts occur when multiple packages end up on the same carrier plate (double packages) or when one package overlaps an adjacent carrier plate (overlapping packages). When packages are situated off-center on a carrier plate, they may not cleanly divert
into the proper chute. If this happens, the package may fall down the adjacent chute, end up on the adjacent carrier plate, or overlap the adjacent carrier plate. When packages are doubled up on
a carrier plate they may be detected by the camera and fixed by diverting down the jackpot lane. However, if the camera does not detect two barcodes, it assumes there is only one package on the carrier and both packages are diverted into the same chute. The reasons for doubled up and
overlapping packages will be described according to the order in the process in which they may occur.
The first place that errors can occur is during induct. The packages that are sorted via the flat sorter have dramatically varying dimensions: the package may be a small, light jiffy mailer, a heavy box, or a jiffy mailer with an abnormally shaped item like a baseball. Although the mechanical induct system is theoretically designed to handle this variability, in practice these differences can result in a package being inducted such that it overlaps an adjacent carrier plate. Doubled up or overlapping packages can also occur due to poor or variable induct technique. When the packages are inducted, the associates doing this activity are instructed to slide the package onto the conveyor belt such that the package will be situated in approximately the same position with each induct. This technique should ensure that the packages end up squarely on a
carrier plate, thereby ensuring that they are cleanly diverted into a gaylord. However, when an inductor does not follow the procedure correctly, the package ends up in a slightly different place on the carrier plate each time. Even after trial-and-error calibration of the conveyor belt speed, the controls systems engineers at ONT2 found it difficult to account for the induct technique variability.
Another instance that leads to missorts occurs when the flat sorter jams due to blockage of a photo eye (there are many on the equipment). When a jam occurs, the entire conveyor belt comes to a stop and the equipment must be manually restarted after the jam is cleared. When the
conveyor belt is changing speed, packages are more likely to be inducted onto a carrier plate that already has a package on it or will overlap an adjacent carrier because the induct station belt speed is not able to adjust for the changing speed of the larger piece of equipment.
4.3 Sortation Performance Metrics
The sortation process at ONT2 has several different performance metrics, including the concessions report, a missort audit (performed four times per day) and a sort center missort report. In addition to using these measures, interviews and observations were performed, and additional insight was gained using data from AMZL station returns and from missort data collected at sort centers.
Several metrics are used to gauge the performance of the sortation processes for both dock and flat packages at all FCs in North American (NA FCs). Each of these metrics provides a window into the process performance, however each of them has notable flaws which were critical to understand in the pursuit of an accurate current state analysis.
The first of these metrics is the concessions report. As noted above, the concessions report is used to gauge performance in meeting the customer expectation for all NA FCs. If a customer has a sub-optimal experience and receives a package that is late, damaged, missing, or does not include the proper items, they can file a concession and Amazon will grant them one of a variety of different remedies. When the concession is filed, the case is assigned a reason code, such as "wrong item switcheroo", "item missing", or "damaged item", among others.
While the concessions report is a reflection of the customer experience and is published for all NA FCs on a weekly basis, it lacks clarity in several key ways. First, the concession is reported
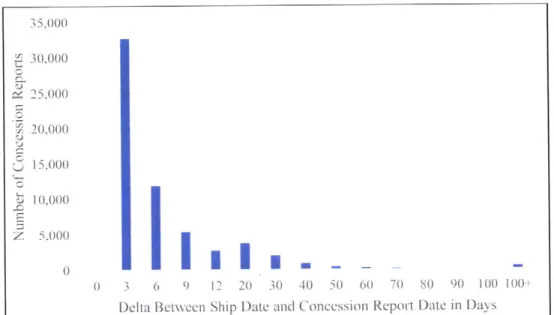
at the convenience of the customer and in many cases the customer will not file the concession until several weeks after they should have (or did) receive their shipment. For six months of
days2. The histogram below (Fig. 5) shows that although most concessions are reported within a week, the delta between the ship date and concession report date can stretch past three weeks.
IMIhl
lIkt\\CCn Yhip 0 1[te 1ndConlc')'ioll
R 2port 0D1c InI 0 1ayFigure 5. Delta between Ship Date and Concession Report Date
This illustrates that concessions are a lagging indicator and it is impossible to tell when all of the concessions for a given ship date have been reported. Thus, the efficacy of outbound process changes aimed at reducing concession-causing defects is difficult to determine using the concessions report alone.
Second, concessions may not be allocated to the correct reason code by the customer or the customer service representative. For example in one report a concession was categorized as a
"wrong item switcheroo" although the customer commented that they "never received package", indicating that the appropriate reason code should have been "item missing". This leads to another difficulty with concessions: reason codes are not only mis-reported, they can have
the customer never received their order at all, that they received an empty box, or that they
ordered five items and only received four. The defects that lead to these different outcomes are
different and impossible to ascertain using the current coding system.
Additionally, the reason codes encompass several root causes that lead to the same customer
impact. For example, a wrong item switcheroo can occur when the item is picked, packed, or
reprocessed by a SLAM operator.
Finally, for missorts in particular, the concession report provides a lower bound estimate for the
defect rate. This is due to a "band aid" for missorts that was introduced in 2012 in which major
carriers (UPS, FedEx, etc.) correct any missorts they receive by "overlabelling"
3. For example, if
UPS receives a missorted package with a DHL label, a UPS label is placed over the existing
label and the package is delivered to the customer by UPS. Because the customer receives their
package, a concession will not be filed for this package and the true missort rate will be
underrepresented by the concessions report. While this band aid method does have a small
financial impact to Amazon in the form of a per package payment to large carriers, it is about
20% of the cost of a concession
4, and typically meets the customer's PDD.
Another metric for sortation performance is the missort audit that is performed four times per
day in the FC by an associate on the ICQA (Inventory Control and Quality Assurance) team.
Each time the audit is performed, the associate should sample 100 flat packages, 100 fluid loaded
dock packages and 100 palletized dock packages. The associate chooses which gaylords and
dock lanes to audit and visually scans the packages to see if any of the shipping labels do not
match the sort in that location. This audit is subjective and the thoroughness will depend on the
specific associate doing the job. A review of thirty days of missort audit data shows how a positive missort finding skews the missort DPMO. In October 2015, the missort DPMO at ONT2 according to the audit varied between 0 (for 15 days) and 1,500 (for 1 day) (Appendix I)5.
Additionally, the sample size of 800-1200 packages per day is too small to accurately capture the missort rate at the expected DPMO. Using the sample size calculation equation6 shown below
and the estimated actual rate of missorts based on sort center data, the appropriate sample size for a confidence level of 95% and a margin of error of 0.1% is 7,700 flat packages and 2,700 dock packages.
p(1
- )z2ME2
Where n = the sample size
ME = margin of error; 0.1% used in this example
z = critical value for a specific confidence level (1.96 for 95% CI)
f = estimate of population missort proportion, with different values used for flat and dock packages
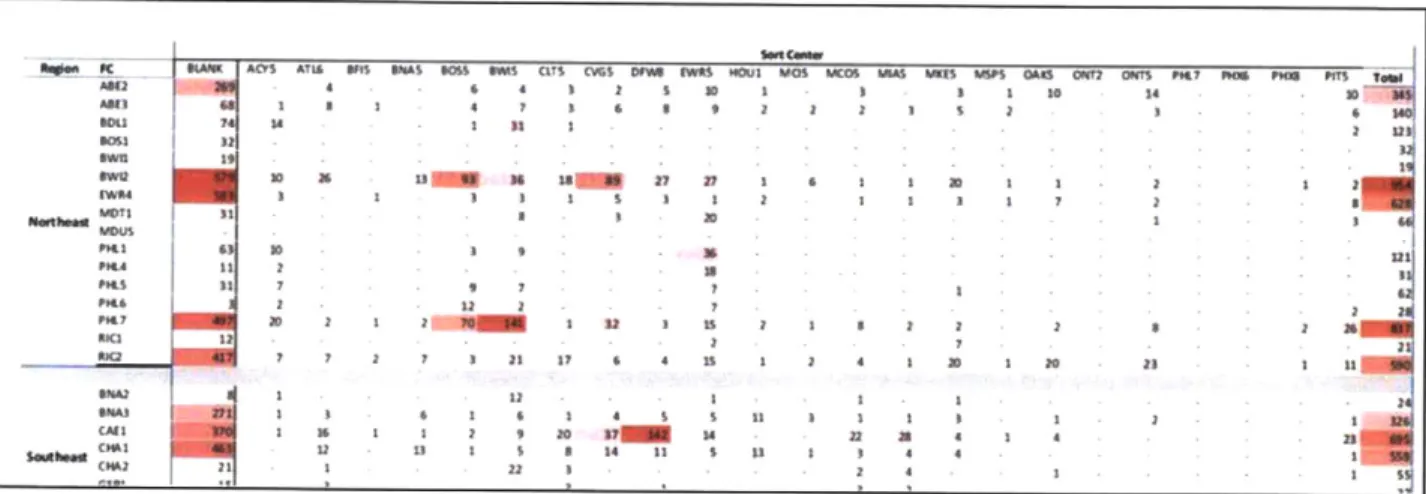
The final important metric is a report that the sort centers generate and deliver to all NA FCs every few days (Fig. 6). The report records all missorts that arrive at a sort center. While this report is the most complete and timely measure of the missort rate, this data is not tracked over time to identify trends, nor is it available to the FCs in a detailed format that would enable
immediate action to reduce missorts. The report indicates the number of missorts received by
each sort center from each origin FC within the indicated time period (typically a few days). However, there is no indication of the package type, the carrier or the arrival date of the packages, information which could help identify root causes.
process and they not spo5 "1ailt 0do Dot Mno5 -1 .m05 ve ef fors e1 tWS tIr 0 *lag gin
WJ 14 .1 4 2 11 11 22 1 2 6 4. Current r P e r 2orac *304~~ 327 33 "16 21 1 32 2 zs1 2 4 1 j I 2 3 122 2 ix: 4 2 2 Is 2
Figure
6.
Sort Center Missort RepgortIn summary, none of the metrics described above provide an indication of current or historical process capability and they do not support continuous improvement efforts due to their lagging and high level nature. These etrics were an important starting point for this investigation,
however alternative performance measures were developed and will be discussed in Section 4.4.
4.4 Current Process Performance
The current dock and flat sortation process performance was determined using the m-etrics above,
as well as additional data collected in the course of the internship. Both quantitative sources,
such as the missort report and concessions report, and qualitative sources, including interviews
and observations, were used.
Several informal interviews were carried out in order to understand general process performance and barriers to achieving a zero DPMO missort rate. The initial qualitative description of the process provided by a senior manager at ONT2 indicated that the dock process "has a lower
missort DPMO than the flat sortation process", though the true quantitative missort rate was unknown. This assessment was echoed by an operations manager at ONT2, and by the Outbound Dock SME (subject matter expert). In Sections 4.4.1 and 4.4.2, observations and metrics will illustrate that these hypotheses were correct.
4.4.1 Dock Package Performance
The Outbound Dock SME hypothesized that the reason for the dock sortation defect rate was primarily due to human error with palletized packages. For example, on a pallet spur with multiple sorts, it is easy for an associate to scan the package, scan the destination pallet / gaylord and then accidentally place it in the wrong destination. Observations of the dock sortation
process showed that fluid load sorts were less likely to encounter the same issues as mixed, palletized sorts because the packages are loaded directly into the back of a truck.
Beginning in June, ONT2 was the dedicated returns site for packages that arrived at AMZL stations but that were un-routable (due to an FC error) or undeliverable (due to a delivery or AMZL error). Five local delivery stations sent packages back to ONT2, where the customer service team collected package identification data, including the tracking number and the encrypted shipment ID. Using this ID information, additional details about package attributes could be gathered from Amazon's Data Warehouse using a SQL query. This data enabled some preliminary conclusions about wrong carrier missort DPMO for the FCs that delivered packages to these stations. It is not possible from this data to determine which packages were wrong-station missorts. Prior to the discovery of more robust and representative data, this data was used to identify trends and approximate the missort DPMO of flat and dock packages. Figure 7 shows the wrong carrier missort DPMO for these packages. The flat missort rate is clearly higher than
the ONT2 managers. One caveat with this data is that not all of the packages that were returned had identification information that could be collected. And not all of the identification numbers returned detailed information from the Data Warehouse query. Detailed information for about two thirds of the returned packages was found, and it is not clear why some information was not returned. It is also not clear if there was a bias in the type of package for which information was or was not returned (flat or dock packages). However, this data was assumed to be a better approximation than the existing data sources because it provided a direct and nearly complete missort defect rate for several sorts (albeit sorts that were a small fraction of total ONT2 volume).
00
Ship Date
- ONT2 DPMO -FLATS MIS -SORTS - ONT2 DPM.O -DOCK NlS-SORTS
Figure 7. A MZL Returns Missort DPMO
4.4.2 Flat Package Performance Assessment
Several different observations were performed on the flat sorter in order to better understand the process, the opportunities for defects to occur, the impact of induct technique and the
The first of these was an observation of the air knife, the purpose of which is to help divert poorly placed or "error" packages to the jackpot station. The air knife is designed to fire when
the carrier belt spins to divert a package. The carrier diverts in response to a signal from either camera, which could be detecting two barcodes, an invalid barcode, or some other anomaly. The hypothesis was that the air knife contributes to circumstances of misplaced packages by
unsuccessfully diverting the packages, and does more harm than good. This is recorded below as "air knife fired, package was not diverted", a situation in which the air knife fired and the
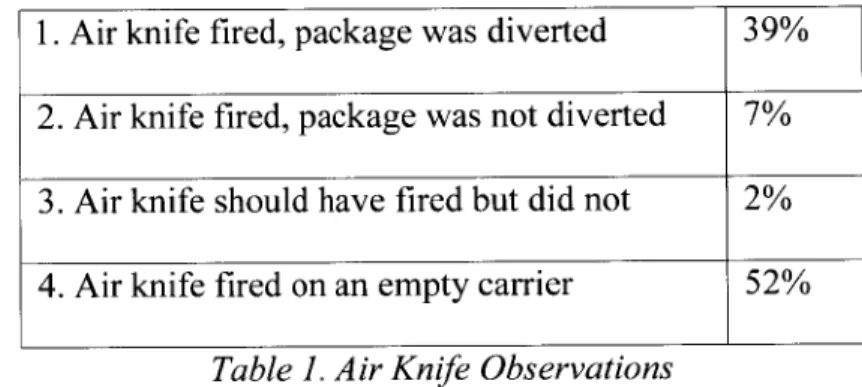
package was not diverted and ended up poorly placed on a carrier plate. The air knife was observed for a period of thirty minutes and the following four different actions were observed and the number of occurrences as a percentage of the total number of air knife fires was recorded (Table 1).
1. Air knife fired, package was diverted 39% 2. Air knife fired, package was not diverted 7% 3. Air knife should have fired but did not 2% 4. Air knife fired on an empty carrier 52%
Table 1. Air Knife Observations
The observation indicates that for the majority of the time the air knife either contributed to the placement problem or fired on an empty carrier. Although action four (fired on an empty carrier) does not directly appear to contribute to potential missorts, it does bring into question the overall functioning of the device and how often the air knife fires when it should not.
An induct experiment was also performed, in which one hundred packages were inducted with the proper technique and one hundred packages were inducted with improper techniques. The number of "good" placements and the number of "bad" placements were recorded. With the
proper technique, none of the packages were doubled up or overlapping. With improper techniques, just one out of one hundred packages ended up between carrier plates. This brief experiment seems to indicate that induct technique does not have an impact on package placement on the carrier plate. However, there are many variables that were not tested or recorded in this situation, including package dimensions and start up / shut down of the flat sorter. While a useful exercise, this experiment did not yield clear results, and a more detailed experiment with a larger sample size could yield more conclusive results.
In an effort to determine a more accurate missort rate using data that could be collected immediately at ONT2, fourteen gaylords were emptied and the number of total packages and number of missorts were counted. Additionally, the sort codes of the missort packages were recorded to determine if there was any kind of a pattern in the missortation. The average missort rate was almost eight times that of the assumed network average7
, though the rate varied from zero missorts to fourteen times the network average.
Finally, as with the dock missorts, the AMZL flat package returns were reviewed and the missort rate was plotted (Fig. 8). The plot indicates that the flat missort rate varies widely, unlike the dock missort rate. The plot does not show a clear pattern or trend, and the missort rate is up to fifteen times as high as the network average.
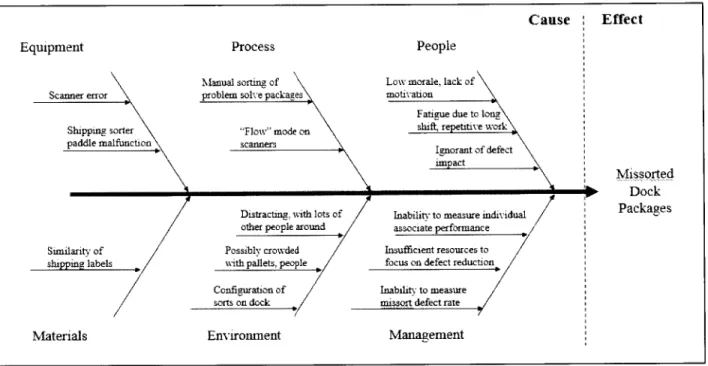
4.5 Cause and Effect Analysis
After mapping the processes and determining and analyzing qualitative and quantitative
measures of dock and flat sortation performance, cause and effect (or Ishikawa) diagrams were created to determine the possible root causes of the missort defects. The causes were divided into
equipment, process, people, materials, environment and management categories, which are commonly used in manufacturing-type settings (Kollengode, 2010). The problem to be solved was defined as dock missorts and flat missorts. The key causes and the reasons behind the key causes were determined through conversations with managers and associates, as well as personal
observations. See Figures 8 and 9 for the full diagrams. Further investigation was done for some of these areas, and will be discussed later in this thesis.
Equipment Scanner eror Shippng sorter paddle malfunction Sunilarity of shipping labels Materials Process Manual sorting of problem solve packages
"~ w "Flow" mode on
scanners
Distracting, with lots of other people around Possibly crowded with pallets, people Configuration of
sorts on dock
Environment
Cau
People
Low morale, lack of motivation
Fatigue due to long
shift. r titive work Ignorant of defect
unapact
Inability to measure mdividual
associate performance
Insuffcient resources to focus on defect reduction Inabiltty to measure
missort defect rate ./
Management
Figure 8. Dock Missort Cause and Effect Diagram
For dock packages, the primary contributors, based on data and observations, to missorts appear to be the people and the environment, with some contribution from management's inability to effectively measure associate performance.
se Effect
MISS orted
DOCK
Equipment
Scanner no-read Scanner minsed double package\
Photo eye nus-calibration
Delayed package divert
Mechanical motorn
prone to wearine out
Incontiatently 7 ahapei package Fraving belton / divert plate. Materials Process
Induct technique sensitivity bon
Packane re-circulation
Gaylord removal and eplacement (blue lightine)
Intermittent p releace to mdi Constant standig do induct job Environnent CaU People
sistent induct technique
Frequent turnover
Delayed remc'al of
full a rds
ackage Inability to mea-ure dock worker
ictotr and inductor performance
Inability to allocate funds for equipment upgrades
Inability to measure
miisort defect rate
Management
se Effect
Miseso rted Flat Packagyes
Figure 9. Flat Missort Cause and Effect Diagram
For flat packages, the primary contributors, based on data and observations, are the equipment and the materials used, as well as management's inability to measure the missort rate, as noted above.
4.5 Control Chart Creation
In order to get a more accurate and useful measure of the missort rate, the detailed missort data collected at sort centers was gathered from Amazon's Data Warehouse for analysis. By entering the shipment ID, detailed package information including the SLAM time, package type
(including box size), tracking number, ship date and carrier, is returned. This data is a useful resource for understanding historical sortation process capability as well as monitoring sortation performance on a daily basis in order to correct anomalies. Statistical process control (SPC) methods were utilized to better understand errors in the sortation process for dock and flat packages and create an action plan for correcting unusual process variation.
Control charts were created to track the proportion of missorted packages compared to outbound sort center volume. These charts establish an understanding of historical and current process parameters, which has never been done for the sortation process. With the historical performance established, control charts can be used to monitor the process, identify when the process has exceeded the allowable threshold and act to bring the process back within the acceptable
thresholds. Finally, once the sortation process has reached a steady state, in which only common cause variation occurs, the charts can be used to systematically decrease the sortation missort
rate.
For the missort defect control charts, the sample size is the total sort center volume over the period of time in question, in this case a single day. The "defective" proportion is the number of missorted packages over the sort center volume for that time period. The scales on the control charts have been altered to protect Amazon's confidentiality and control charts were created separately for flat and dock packages. The mean missort rate and upper and lower control limits were calculated but are not provided in this thesis for confidentiality reasons.
The date used for each data point was determined by the SLAM time for each package because it is one of the last time stamps that exist for a package in the Amazon data system. It is also the most reliable measure of approximately when a package went through the sortation process. Ship time was not used because of the amount of time that can pass between sortation and shipping (up to and occasionally over twenty four hours), and because the ship time assumes the package was sorted correctly, which is not the case for these packages.
Control charts were created for ONT2, ONT6, and PHX6 to understand the historical process capability of the flat and dock sortation processes. ONT6 was used because of similar volume
was utilized to capture the proportion of defective (missorted) packages compared to the sample
size.
4.5.1 Dock Missort Control Charts
Figure 10 shows a control chart for dock package missorts from ONT2 for three months during the internship. The three process "stages", indicated by dashed vertical lines, are the three months that were studied. The p chart below indicates that the average proportion of missorted packages is increasing over time, and that there have been three instances of unacceptable
uncontrolled variation, indicated by the red points on the plot that fall above the UCL. Figures I I and 12 are control charts for ONT6 and PHX6. A comparison of the charts shows that dock missort rates have increased over time at all three FCs, perhaps due to new hires for the holiday season ("peak") or an increase in outbound volume.
P Chart of ONT2 Dock Missorts
Month I Month 2 Month 3 40 c 30 0 OP20 0 S10 SLAM Date
Figure 11. P Chart of ONT6 Dock Missorts
P Chart of PHX 6 Dock Missorts
Month I Mouth 2 Month 3
140 120 .21001 2 0 S40 20 0 SLAM Date
Figure 12. P Chart of PHX6 Dock Missorts
4.5.1 Flat Missort Control Charts
Figures 13, 14 and 15 are control charts of flat missorts at ONT2, ONT6 and PHX6. The ONT6 average flat missort rate is about half that of ONT2 and PHX6, likely due to equipment
differences. The ONT2 and PHX6 flat sortation equipment is similar, though PHX6 scanner camera has been updated recently. At ONT2 and PHX6 the carrier plates do not adjust to
re-P Chart of ONT6 Dock Missorts
Monlh I Month 2 Month 3
20 a 15 .0 10 0 SLAM Date
has a different design, in which the carrier plates dynamically adjust to center the inducted
package on the plate. This ensures that the package is properly diverted into the appropriate
chute and does not miss the chute. This difference, as well as some differences in the induct
stations, likely explains the lower flat missort rate at ONT6. The ONT2 control chart (Fig. 13)
shows a process that is out of control, as well as an upward trend in the missort rate beginning in
the middle of the second month and peaking with a dramatically high missort rate at the
beginning of the third month. The cause of this increase was a flat sorter equipment malfunction
that was detected on a Friday and was corrected over the course of the following week through
equipment changes.
P Chart of ONT2 Flat Missorts
Month I Month 2 Month 3
120 100 go t 60FCF 40 20 1 )Li 0 T SLAM Date
P Chart of ONT6 Flat Missorts
Month I Month 2 Month 3
35 -_ - --30 0 25 20 2 15 0 5.N SLAM Date
Figure 64. P Chart of ONT6 Flat Missorts
P Chart of PHX6 Flat Missorts
Month I Month 2 Monh 3
40 V30 2
~-20
10 SLAM DateFigure 15. P Chart of PHX6 Flat Missorts
4.6 Solution Implementation
In order to provide greater visibility into ONT2 missorts, a report was created (Fig. 16 and 17) which utilizes the missort data collected at sort centers. Outbound sort center volume at ONT2 accounts for a sufficient amount of total ONT2 outbound volume that the sort center missort rate
can serve as a reasonable proxy for the overall missort rate until a better data source is found or created. The report is generated on a daily basis and provides weekly missort rates for flat and