J. F. Schneider S. Confort-Gouny Y. Le Fur P. Viout M. Bennathan F. Chapon C. Fogliarini P. Cozzone N. Girard Received: 26 June 2006 Revised: 13 February 2007 Accepted: 9 March 2007 Published online: 3 April 2007 # Springer-Verlag 2007
Diffusion-weighted imaging in normal fetal
brain maturation
Abstract Diffusion-weighted imag-ing (DWI) provides information about tissue maturation not seen on con-ventional magnetic resonance imag-ing. The aim of this study is to analyze the evolution over time of the apparent diffusion coefficient (ADC) of normal fetal brain in utero. DWI was performed on 78 fetuses, ranging from 23 to 37 gestational weeks (GW). All children showed at follow-up a normal neurological evaluation. ADC values were obtained in the deep white matter (DWM) of the centrum semi-ovale, the frontal, parietal, occipital and temporal lobe, in the cerebellar hemisphere, the brainstem, the basal ganglia (BG) and the thalamus. Mean ADC values in supratentorial DWM
areas (1.68±0.05 mm2/s) were higher
compared with the cerebellar
hemi-sphere (1.25±0.06 mm2/s)
and lowest in the pons (1.11±
0.05 mm2/s). Thalamus and BG
showed intermediate values (1.25±
0.04 mm2/s). Brainstem, cerebellar
hemisphere and thalamus showed a linear negative correlation with gesta-tional age. Supratentorial areas re-vealed an increase in ADC values, followed by a decrease after the 30th GW. This study provides a normative data set that allows insights in the normal fetal brain maturation in utero, which has not yet been observed in previous studies on premature babies. Keywords Brain . Fetus .
Maturation . MRI . Diffusion . Normal
Introduction
Magnetic resonance (MR) imaging of the fetal brain and its morphological changes during pregnancy has been well documented using conventional T1- and T2-weighted imaging (-wi) sequences. Changes in morphology include developing sulcation, decrease of subarachnoid spaces volume and progressive thinning of the periventricular
germinal zone [1–5]. Changes in signal can be detected in
many brain areas and are known from histologic studies to
be related to continuous cellular differentiation and orga-nization, myelin deposition, a decrease of the water content predominantly within the white matter, and to MR
properties of some lipids of the myelin membrane [6,7].
Diffusion-weighted (DW) imaging, based on microscop-ic water diffusion, has been applied to the characterization of brain maturation. Previous studies in the post-natal period and childhood have shown a correlation between apparent diffusion coefficient (ADC) values and
progres-sive brain maturation [8–11]. These changes precede those
J. F. Schneider (*)
Department of Pediatric Radiology, University Children’s Hospital UKBB, Basel, Switzerland e-mail: [email protected] Tel.: +41-61-6856565 Fax: +41-61-6856815 S. Confort-Gouny . Y. Le Fur . P. Viout . P. Cozzone
Centre de résonance magnétique biologique et médicale, UMR-CNRS 6612, Faculté de médecine,
Université de la Méditerranée, Marseille, France
M. Bennathan . F. Chapon . C. Fogliarini . N. Girard
Department of Neuroradiology AP-HM Timone, Université de la Méditerranée, Marseille, France
seen on conventional MR images and provide earlier
information about tissular organization [12,13]. However,
because the environmental conditions and the coils used for in utero imaging are different, results found in premature newborn at equivalent gestational age cannot be extra-polated to fetal MR imaging. Early detection and quanti-tative assessment of CNS injury in utero as detected by a decrease of the ADC may prove very useful in the clinical setting, in regard to the management of pregnancies at risk. The goal of this study was to quantitatively analyze ADC values on diffusion images in various brain regions and establish a time course of normal brain maturation during the fetal period in utero.
Materials and methods
This study is a retrospective review of DW images per-formed from January 2002 to December 2005 in pregnant women for fetal brain assessment. In our institution, the DW sequence is part of the standard MRI protocol in the evaluation of fetal brain, and no additional consent was deemed necessary.
Patient selection
Seventy-eight singleton fetuses, ranging from 23 to 36 weeks of amenorrhea (average±standard deviation=31±3 weeks), were included in this cross-sectional study and no fetus was examined twice. Gestational age (GA) was expressed in gestational weeks (GW) of amenorrhea and calculated
from the first day of the mother’s last menstrual period or
from the results of an early second trimester obstetrical ultrasound, in case clinical and ultrasound datas differed by more than 1 week.
Fetal brain MR imaging (MRI) was performed for various clinical indications (extra cerebral malformations, familial history of genetic disease or chromosomal abnormalities, fetuses in which sonographic examination could not adequately rule out central nervous system malformation). All of these were ruled out on MRI and based on clinical evaluation of a multidisciplinary board dedicated to fetal care). All MRI and DWI studies were reviewed by two confirmed neuroradiologists (J.F.S. and N.G.) and considered normal (no brain or facial malfor-mation, no brain signal anomaly). The maturation status and its correspondence with the GA was assessed using
normal sulcation and gyration atlas [3]. All children were
examined by neonatologists at birth and by pediatricians at 6 months of age with a normal clinical and neurological evaluation. MR examinations showing unacceptable move-ment artifacts were repeated until acceptable image quality was reached.
Pregnancies at risk of brain damage or proven materno-fetal infections even in the presence of a morphologically normal brain MRI were excluded from the study.
Imaging parameters and data analysis
All MR examinations were performed on a 1.5-Tesla Symphony Maestro Class (Siemens Medical Systems, Erlangen, Germany), after fetal sedation was obtained by
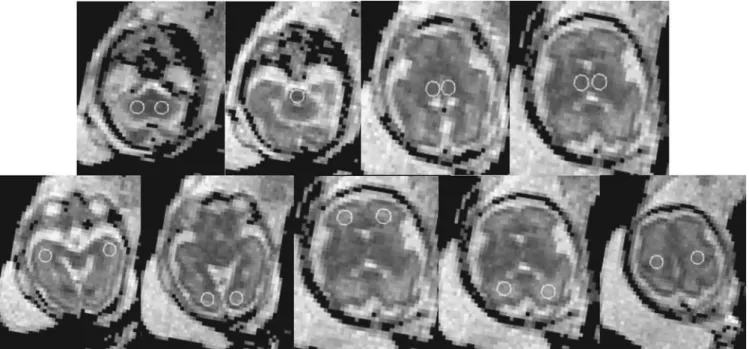
Fig. 1 Localization of the ROIs within all analyzed brain areas of a fetus at 28th GA. Upper row from left to right: cerebellar hemisphere, pons, thalamus, basal ganglia. Lower row from left to right: temporal WM, occipital WM, frontal WM, parietal WM, centrum semiovale
maternal premedication using flunitrazepam administered orally 15 min to 1 h before the study.
Body phased-array abdominal coils (four coils) were used in combination with spinal coils (two coils). After gradient-echo T1-wi and T2-wi HASTE (half-Fourier acquisition single-shot turbo spin echo) imaging, DW imaging was performed with axial spin-echo echo-planar technique (TR=3,200 ms, TE=94 ms, 20 slices, slice thickness=4 mm, gap=1 mm, three averages per image, field of view=350×350 mm, 128×128 acquisition matrix). Diffusion was measured in three orthogonal directions at
two values of b (b=500 s/mm2 and 1,000 s/mm2). An
additional set of images was obtained with no diffusion weighting. The total acquisition time for the DWI was 51 s.
DW images and the averaged ADC maps were auto-matically performed using Siemens software. DWI and ADC datas were subsequently transferred to a workstation using IDL software for further analysis (Iterative Data Language 6.3, Research System, Boulder, Colo., USA).
A single-sized region of interest (ROI) with a circular
area of 84 mm2was placed and ADC values retrieved in the
following locations (Fig. 1): two infratentorial positions
(central cerebellar area at the level of the cerebellar peduncle and the pons) and seven supratentorial positions (central area of the centrum semiovale at the level of the central region, the frontal, parietal, temporal and occipital lobe, the basal ganglia and the thalamus). Data obtained from corresponding regions of the left and right
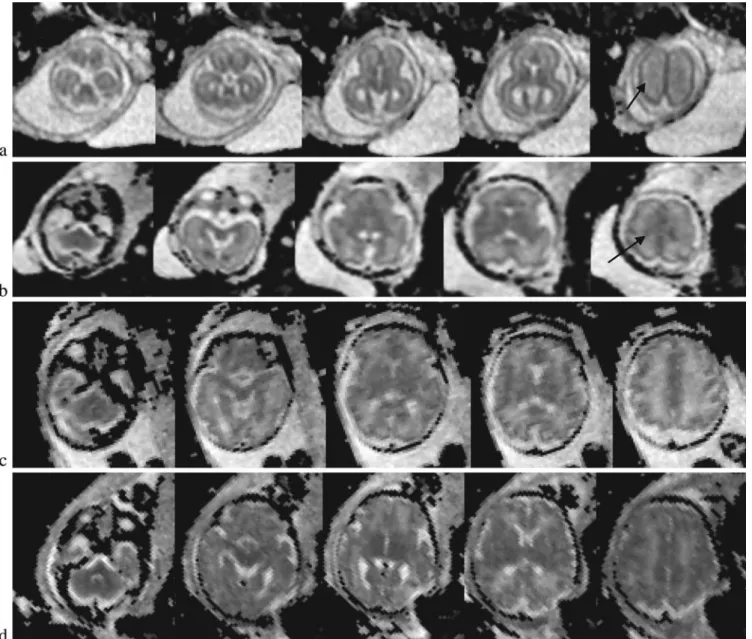
hemi-Fig. 2 Representative ADC maps at five different levels, from the cerebellar hemispheres, the midbrain, the thalamus, the lentiform nucleus and the centrum semiovale taken at the 24th (a), 28th (b),
32nd (c) and 36th GW (d). Black arrows on the right image in rows a and b point to the intermediate zone layer
spheres showed no statistically significant difference and were therefore averaged before further analysis.
The regional variation of mean ADC values and standard deviation was plotted against the GA for each brain region, and the data were best fit using the least squares regression procedure (JMP statistical software, SAS Institute, Cary, N.C.). A significance level of 5% was chosen (P<0.05).
Results
Pictorial representation
We will first review qualitatively the representative ADC maps at five different levels, from the cerebellar hemi-spheres, the midbrain, the thalamus, the lentiform nucleus and the centrum semiovale taken at the 24th , 28th , 32nd
and 36th GW, as shown in Fig.2.
In young fetuses below the 25th GW, ADC maps show a multilayered pattern at the supratentorial level. From the center to the periphery, five different cellular layers can be
identified on fetal MRI (Fig. 2a). The periventricular
germinal zone and the cortical ribbon are of low signal intensity. Within the white matter area located between these two layers, the intermediate zone is of intermediate to high signal intensity. This intermediate zone, although clearly seen in the coronal plane in high-resolution HASTE T2-wi is difficult to identify on ADC maps. Nevertheless, it can be seen as a hazy oval zone in the central area of the
centrum semiovale (last image on the right in Fig. 2a,b
(arrows).This multilayered pattern can be identified up to the 30th GW, especially in the thicker frontal area, and undergoes a profound reorganization which is reflected by
a change in signal intensity pattern over time (Fig. 2b).
First, there is a continuous reduction in thickness of the periventricular germinal zone, which nevertheless remains of low intensity. Second, the intermediate zone of migrating cells shows progressive vanishing within the deep white matter areas, merging in its intensity with the subventricular zone centrally and the subcortical WM peripherally. After the 30th GW, the multilayered pattern is less conspicuous and the intermediate layer of migrating
cells is barely visible (Fig.2c,d).
ADC measurements
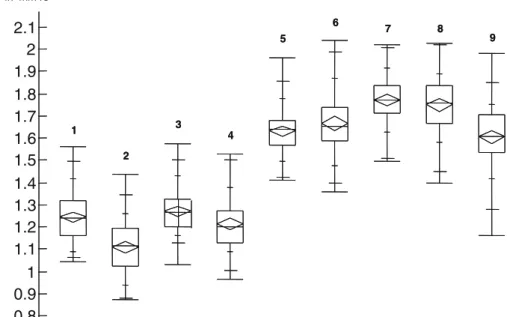
Results of analysis of variance of the data showed that two main groups of ADC values could be distinguished: (1) the areas of the supratentorial WM areas; (2) the areas of the pons, cerebellar hemispheres, and (3) the deep gray matter of the BG and thalamus. The mean ADC values (±standard error of mean) of the supratentorial deep white matter areas
are consistently higher (1.68±0.05 mm2/s) than those of
the infratentorial areas (from 1.11±0.05 mm2/s in the pons,
to 1.25±0.06 mm2/s in the cerebellum), the mean ADC
values of the deep gray matter being intermediate to low
(1.25±0.04 mm2/s) as shown in Fig. 3. The relation
between gestational age and ADC values in all investigated brain areas was investigated and statistically significant correlations were found in almost all brain regions
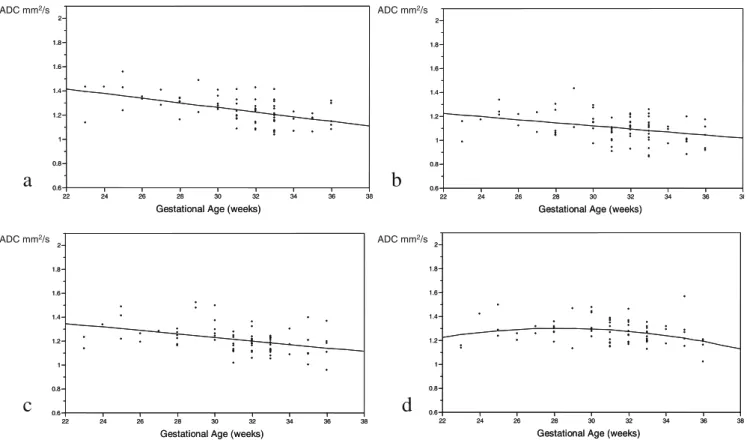
analyzed (Fig.4a–i).
As will be discussed, ADC values in the pons, cerebellar hemispheres and thalamus showed all a strong negative and linear change with gestational age. ADC values in the basal ganglia were best fitted using a quadratic polynomial curve with a minimal increase of the ADC values until the 30th GW and a decrease afterwards. When considering the supratentorial deep white matter areas, we found that ADC 0.8 0.9 1 1.1 1.2 1.3 1.4 1.5 1.6 1.7 1.8 1.9 2 2.1 1 2 3 4 5 6 7 8 9 Mean ADC in mm2/s 1 2 3 4 5 6 7 8 9
Fig. 3 Quantile box plot dia-gram of the ADC values distri-bution. Each plot represent a different region of the brain (horizontal lines representing the quantiles from minimal at the bottom to maximal at the top, the box itself representing the 25th to 75th quantile). 1 Cerebellar hemisphere; 2 pons; 3 basal ganglia; 4 thalamus; 5 temporal white matter; 6 occip-ital white matter; 7 frontal white matter; 8 parietal white matter; 9 centrum semiovale
values were best fit using a quadratic polynomial curve,
with an increase during the 23rd–30th GW and a
progres-sive decrease afterwards until birth. The decrease of mean ADC values was strongest in the centrum semiovale and occipital deep white matter, intermediate in the parietal and temporal deep white matter and lowest in the frontal deep white matter.
Discussion
DWI is a method widely used in adult and pediatric brain imaging for stroke, infections or tumors among others. Its application to neonatal brain imaging is relatively new and has been demonstrated helpful in various pathologies like hypoxic-ischemic injuries, neonatal stroke or infectious diseases, but has also found applications in demonstrating normal maturational processes. Most studies have concen-trated on postnatal development of early infancy and
childhood [10, 11, 14–18]. Reports of dedicated use of
DWI for normal fetal brain imaging are scarce [19]. Most
of these studies on early brain maturation are focused on newborns that were between one day and several weeks old
at the time of the study [17,20]. Because of the changes in
body water content and water distribution which occur very
rapidly after birth [21], it is possible that brain diffusion
values of premature babies are not identical to those of a fetus in utero of the same gestational age where these changes have not yet taken place.
The analysis of our results shows that a better under-standing of the underlying mechanisms of variations of the ADC values is possible when organizing the single measured fetal brain areas into more general anatomic and functional systems. It has been demonstrate that the first white matter fibers to show high-order organization and myelin deposition are concentrated in the ascending sensory spinocerebellar and spinothalamic tracts, which are located in the posterior part of the brainstem and make connections to the cerebellar hemisphere and to the lateral
parts of the thalamus [22,23]. This correlates well with the
facts that (1) the corresponding ADC values in these areas are already statistically significantly lower than in any
other parts of the fetal brain at the 23rd–36th GW, and (2)
all three regions show a very similar maturational time course reflected by an almost parallel negative linear fit
(Fig.4a–c).
Similarly, all deep white matter areas can be grouped together. These do not represent compact projectional
a
0.6 0.8 1 1.2 1.4 1.6 1.8 2 22 24 26 28 30 32 34 36 38Gestational Age (weeks) 0.6 0.8 1 1.2 1.4 1.6 1.8 2 22 24 26 28 30 32 34 36 38
Gestational Age (weeks)
ADC mm2/s ADC mm2/s ADC mm2/s ADC mm2/s
b
0.6 0.8 1 1.2 1.4 1.6 1.8 2 22 24 26 28 30 32 34 36 38Gestational Age (weeks) 0.6 0.8 1 1.2 1.4 1.6 1.8 2 22 24 26 28 30 32 34 36 38
Gestational Age (weeks)
c
0.6 0.8 1 1.2 1.4 1.6 1.8 2 22 24 26 28 30 32 34 36 38Gestational Age (weeks) 0.6 0.8 1 1.2 1.4 1.6 1.8 2 22 24 26 28 30 32 34 36 38
Gestational Age (weeks)
d
0.6 0.8 1 1.2 1.4 1.6 1.8 2 22 24 26 28 30 32 34 36 38Gestational Age (weeks) 0.6 0.8 1 1.2 1.4 1.6 1.8 2 22 24 26 28 30 32 34 36 38
Gestational Age (weeks)
Fig. 4 a–i Correlation between ADC values and gestational age in weeks. A significant linear negative correlation is found in graphs a–c. A significant quadratic polynomial correlation is found in d–i with exception of g (in the frontal deep white matter, where only a trend can be found) a Cerebellum (P<0.001); b pons (P=0.002); c thalamus (P<
0.001); d basal ganglia (P=0.03); e temporal deep white matter (P= 0.046); f occipital deep white matter (P<0.001); g frontal deep white matter (P=0.064); h parietal deep white matter (P=0.011); i centrum semiovale under the central region (P<0.001)
fibres as in the brainstem, but can be seen instead as a loose combination of poorly organized white matter fibres and immature migrating cells. This is especially true in the temporal, occipital, parietal and frontal deep white matter areas. Special attention has to be drawn to the white matter zone in the centrum semiovale, beneath the central region, that is known to be the place of early corticofugal progressive organization and simultaneous myelin deposi-tion in the motor corticospinal tracts. This maturadeposi-tional process begins with a slight delay in comparison with the sensory tracts in the brainstem and their projectional areas. As histological and previous conventional fetal brain MR studies have shown, the intermediate zone of the fetal
brain is a transient layer of immature and migrating cells—
mainly immature oligodendrocytes and glial cells [24]. It is
conceivable that the time-related rise and fall of ADC values in these areas might correlate with the maturational process of this intermediate zone. Even in the presence of migrant cells and a visible increase of cellular density within the white matter due to the presence of the intermediate zone on conventional imaging, mean ADC values increase before the 30th GW. This could be interpreted as a consequence of a loose tissular organiza-tion with larger extracellular spaces allowing cellular migration. One shall recognize nevertheless that after the 30th GW, the progressive decrease of ADC values cannot be explained by one variable alone. As has been already
demonstrated in other studies [10,17,25], a combination of
e
0.6 0.8 1 1.2 1.4 1.6 1.8 2 22 24 26 28 30 32 34 36 38Gestational Age (weeks)
0.6 0.8 1 1.2 1.4 1.6 1.8 2 22 24 26 28 30 32 34 36 38
Ge ta ional Age (weeks)
f
0.6 0.8 1 1.2 1.4 1.6 1.8 2 22 24 26 28 30 32 34 36 38Gestational Age (weeks) 0.6 0.8 1 1.2 1.4 1.6 1.8 2 22 24 26 28 30 32 34 36 38
Gestational Age (weeks)
g
0.6 0.8 1 1.2 1.4 1.6 1.8 2 22 24 26 28 30 32 34 36 38Gestational Age (weeks)
0.6 0.8 1 1.2 1.4 1.6 1.8 2 22 24 26 28 30 32 34 36 38
Gestational Age (weeks)
h
0.6 0.8 1 1.2 1.4 1.6 1.8 2 22 24 26 28 30 32 34 36 38Gestational Age (weeks) 0.6 0.8 1 1.2 1.4 1.6 1.8 2 22 24 26 28 30 32 34 36 38
Gestational Age (weeks)
i
0.6 0.8 1 1.2 1.4 1.6 1.8 2 22 24 26 28 30 32 34 36 38Gestational Age (weeks) 0.6 0.8 1 1.2 1.4 1.6 1.8 2 22 24 26 28 30 32 34 36 38
Gestational Age (weeks) ADC mm2/s ADC mm2/s ADC mm2/s ADC mm2/s ADC mm2/s Fig. 4 (continued)
multiple factors is thought to be involved: a progressive reduction in total water content within the brain, a rise in lipid concentrations, an increase in the concentration of macromolecules within the intracellular compartment and a greater membrane surface-cell volume ratio may all contribute to the progressive diminution of ADC values over time.
Our results suggest a primary rise of ADC values before the 30th GW with a consecutive expected decline in the deep white matter areas, as shown by the quadratic polynomial curve fits. This could be the result of combined maturational tissular processes with a peak of ADC values
at the 30th GW (Fig.4e–g). A limitation of this study and
its interpretation is the relatively small number of of patients before the 30th GW (24 fetuses) and the results need confirmation from a larger cohort. A potential weakness of this study is that it does not integrate the complete degree of diffusion anisotropy, as only three directions, but not the full diffusion tensor, were sampled. These rotationally invariant measures of anisotropy are not affected by variables such as head tilt or orientation of white matter fibers. To date there has been no report on anisotropy in the fetal brain in utero, and such measure-ments are under current investigation at our institution.
On the contrary to the study of Righini et al. [19], and
may be due to the larger number of our cohort, one can identify a clear trend toward a more precocious and rapid fall of ADC values in the occipital regions compared with
the frontal regions. This might well reflect the maturation time shift between these two regions, in accordance with histological data showing an earlier myelination of the occipital cerebral areas in comparison with the frontal cerebral areas.
When considering the region of the BG, ADC values were also found to first slightly rise then decrease with a peak at the 30th GW, although there was only a low significance (P=0.03). The decrease in ADC values after the 30th GW is most probably due similar changes as in the thalamus, reflecting an increase cellularity and beginning myelination. The minimal rise before that period is difficult
to interpret and might be artefactual (Fig.4d).
In conclusion, we have shown variations of the ADC values of fetal brain during maturation in utero which have not been described before. The suggestive primary rise before the 30th GW in most deep white matter areas could be attributable to the cellular structure and transient nature of the intermediate zone containing migrating cells. The decrease of the ADC values afterwards, is the result of the disappearance of this intermediate zone in combination with other sequences of events that are already known to occur, especially the decrease in water content and the beginning of higher-order maturation including myelin-ation. The brainstem and cerebellar hemisphere, as well as the thalamus, are shown on the other hand to undergo a much earlier maturation and myelination, with a strong linear negative age-related correlation of their ADC values.
References
1. Larroche JC (1981) Morphological criteria of central nervous system development in the human foetus. J Neuroradiol 2:93–108
2. Girard N, Raybaud C, Poncet M (1995) In vivo MR study of brain maturation in normal fetuses. AJNR Am J Neuroradiol 2:407–413
3. Girard N, Raybaud C, Gambarelli D, Figarella-Branger D (2001) Fetal brain MR imaging. Magn Reson Imaging Clin N Am 9:19–56, vii
4. Fogliarini C, Chaumoitre K, Chapon F, Fernandez C, Levrier O, Figarella-Branger D, Girard N (2005) Assess-ment of cortical maturation with prenatal MRI. Part I: Normal cortical maturation. Eur Radiol 15:1671–1685
5. Fogliarini C, Chaumoitre K, Chapon F, Fernandez C, Levrier O, Figarella-Branger D, Girard N (2005) Assess-ment of cortical maturation with prenatal MRI: part II: abnormalities of cortical maturation. Eur Radiol 15:1781–1789
6. Kucharczyk W, Macdonald PM, Stanisz GJ, Henkelman RM (1994) Relaxivity and magnetization transfer of white matter lipids at MR imaging: importance of cerebrosides and pH. Radiology 2:521–529
7. Kostovic I, Judas M, Rados M, Hrabac P (2002) Laminar organization of the human fetal cerebrum revealed by histochemical markers and magnetic resonance imaging. Cereb Cortex 5:536–544
8. Engelbrecht V, Scherer A, Rassek M, Witsack HJ, Modder U (2002) Diffu-sion-weighted MR imaging in the brain in children: findings in the normal brain and in the brain with white matter diseases. Radiology 2:410–418
9. Lovblad KO, Schneider J, Ruoss K, Steinlin M, Fusch C, Schroth G (2003) Isotropic apparent diffusion coefficient mapping of postnatal cerebral devel-opment. Neuroradiology 6:400–403 10. Mukherjee P, Miller JH, Shimony JS,
Conturo TE, Lee BC, Almli CR, McKinstry RC (2001) Normal brain maturation during childhood: develop-mental trends characterized with diffu-sion-tensor MR imaging. Radiology 2:349–358
11. Schneider JF, Il’yasov KA, Hennig J, Martin E (2004) Fast quantitative dif-fusion-tensor imaging of cerebral white matter from the neonatal period to adolescence. Neuroradiology 4:258– 266
12. Prayer D, Barkovich AJ, Kirschner DA, Prayer LM, Roberts TP, Kucharczyk J, Moseley ME (2001) Visualization of nonstructural changes in early white matter development on diffusion-weighted MR images: evidence sup-porting premyelination anisotropy. AJNR Am J Neuroradiol 8:1572–1576 13. Wimberger DM, Roberts TP, Barkovich
AJ, Prayer LM, Moseley ME, Kucharczyk J (1995) Identification of“premyelination” by diffusion-weighted MRI. J Comput Assist Tomogr 1:28–33
14. Morriss MC, Zimmerman RA, Bilaniuk LT, Hunter JV, Haselgrove JC (1999) Changes in brain water diffusion during childhood. Neuroradiology 12:929–934 15. Mukherjee P, Miller JH, Shimony JS,
Philip JV, Nehra D, Snyder AZ, Conturo TE, Neil JJ, McKinstry RC (2002) Diffusion-tensor MR imaging of gray and white matter development during normal human brain maturation. AJNR Am J Neuroradiol 9:1445–1456
16. Neil J, Miller J, Mukherjee P, Huppi PS (2002) Diffusion tensor imaging of normal and injured developing human brain-a technical review. NMR Biomed 7–8:543–552
17. Neil JJ, Shiran SI, McKinstry RC, Schefft GL, Snyder AZ, Almli CR, Akbudak E, Aronovitz JA, Miller JP, Lee BC, Conturo TE (1998) Normal brain in human newborns: apparent diffusion coefficient and diffusion anisotropy measured by using diffusion tensor MR imaging. Radiology 1:57– 66
18. Takeda K, Nomura Y, Sakuma H, Tagami T, Okuda Y, Nakagawa T (1997) MR assessment of normal brain development in neonates and infants: comparative study of T1- and diffusion-weighted images. J Comput Assist Tomogr 1:1–7
19. Righini A, Bianchini E, Parazzini C, Gementi P, Ramenghi L, Baldoli C, Nicolini U, Mosca F, Triulzi F (2003) Apparent diffusion coefficient determi-nation in normal fetal brain: a prenatal MR imaging study. AJNR Am J Neuroradiol 5:799–804
20. Huppi PS, Warfield S, Kikinis R, Barnes PD, Zientara GP, Jolesz FA, Tsuji MK, Volpe JJ (1998) Quantitative magnetic resonance imaging of brain development in premature and mature newborns. Ann Neurol 2:224–235
21. Zelenina M, Zelenin S, Aperia A (2005) Water channels (aquaporins) and their role for postnatal adaptation. Pediatr Res 57(5 Pt 2):47R–53R 22. Rozeik C, Von Keyserlingk D (1987)
The sequence of myelination in the brainstem of the rat monitored by myelin basic protein immunohisto-chemistry. Brain Res 2:183–190 23. Dubois J, Hertz-Pannier L,
Dehaene-Lambertz G, Cointepas Y, Le Bihan D (2006) Assessment of the early orga-nization and maturation of infants’ cerebral white matter fiber bundles: a feasibility study using quantitative diffusion tensor imaging and tractogra-phy. Neuroimage 4:1121–1132 24. Jakovcevski I, Zecevic N (2005)
Sequence of oligodendrocyte develop-ment in the human fetal telencephalon. Glia 4:480–491
25. Huppi PS, Maier SE, Peled S, Zientara GP, Barnes PD, Jolesz FA, Volpe JJ (1998) Microstructural development of human newborn cerebral white matter assessed in vivo by diffusion tensor magnetic resonance imaging. Pediatr Res 4:584–590