arXiv:1312.1995v1 [hep-ex] 6 Dec 2013
forward-rapidity production of hadrons in polarized p+p collisions at
s = 200
and
62.4 GeV
A. Adare,14S. Afanasiev,31 C. Aidala,44, 45 N.N. Ajitanand,63 Y. Akiba,57, 58 H. Al-Bataineh,51J. Alexander,63 A. Angerami,15 K. Aoki,36, 57 N. Apadula,64 L. Aphecetche,65 Y. Aramaki,13, 57 J. Asai,57 E.T. Atomssa,37 R. Averbeck,64 T.C. Awes,53 B. Azmoun,8 V. Babintsev,25M. Bai,7 G. Baksay,21L. Baksay,21 A. Baldisseri,17
K.N. Barish,9P.D. Barnes,40,∗ B. Bassalleck,50 A.T. Basye,1 S. Bathe,6, 9, 58 S. Batsouli,53V. Baublis,56 C. Baumann,46 A. Bazilevsky,8 S. Belikov,8,∗ R. Belmont,69 R. Bennett,64 A. Berdnikov,60 Y. Berdnikov,60 J.H. Bhom,73 A.A. Bickley,14 D.S. Blau,35 J.G. Boissevain,40 J.S. Bok,73H. Borel,17K. Boyle,64 M.L. Brooks,40
H. Buesching,8 V. Bumazhnov,25G. Bunce,8, 58 S. Butsyk,40 C.M. Camacho,40 S. Campbell,64 A. Caringi,47 B.S. Chang,73 W.C. Chang,2 J.-L. Charvet,17 C.-H. Chen,64 S. Chernichenko,25C.Y. Chi,15 M. Chiu,8, 26 I.J. Choi,73J.B. Choi,11 R.K. Choudhury,5 P. Christiansen,42T. Chujo,68 P. Chung,63 A. Churyn,25O. Chvala,9
V. Cianciolo,53 Z. Citron,64 B.A. Cole,15 Z. Conesa del Valle,37 M. Connors,64P. Constantin,40M. Csan´ad,19 T. Cs¨org˝o,72T. Dahms,64 S. Dairaku,36, 57 I. Danchev,69 K. Das,22 A. Datta,44 G. David,8 M.K. Dayananda,23
A. Denisov,25 D. d’Enterria,37 A. Deshpande,58, 64 E.J. Desmond,8 K.V. Dharmawardane,51 O. Dietzsch,61 A. Dion,29, 64 M. Donadelli,61 O. Drapier,37A. Drees,64 K.A. Drees,7 A.K. Dubey,71 J.M. Durham,40, 64 A. Durum,25 D. Dutta,5 V. Dzhordzhadze,9 L. D’Orazio,43S. Edwards,22 Y.V. Efremenko,53 F. Ellinghaus,14
T. Engelmore,15 A. Enokizono,39, 53 H. En’yo,57, 58 S. Esumi,68 K.O. Eyser,9 B. Fadem,47 N. Feege,64 D.E. Fields,50, 58 M. Finger,10M. Finger, Jr.,10 F. Fleuret,37 S.L. Fokin,35 Z. Fraenkel,71,∗ J.E. Frantz,52, 64 A. Franz,8 A.D. Frawley,22K. Fujiwara,57 Y. Fukao,36, 57 T. Fusayasu,49I. Garishvili,66 A. Glenn,14, 39 H. Gong,64
M. Gonin,37 J. Gosset,17 Y. Goto,57, 58 R. Granier de Cassagnac,37 N. Grau,3, 15 S.V. Greene,69 G. Grim,40 M. Grosse Perdekamp,26, 58 T. Gunji,13 H.-˚A. Gustafsson,42,∗ A. Hadj Henni,65 J.S. Haggerty,8K.I. Hahn,20 H. Hamagaki,13 J. Hamblen,66 R. Han,55 J. Hanks,15E.P. Hartouni,39K. Haruna,24 E. Haslum,42 R. Hayano,13 X. He,23 M. Heffner,39 T.K. Hemmick,64 T. Hester,9J.C. Hill,29 M. Hohlmann,21 W. Holzmann,15, 63 K. Homma,24
B. Hong,34 T. Horaguchi,13, 24, 57, 67D. Hornback,66 S. Huang,69 T. Ichihara,57, 58 R. Ichimiya,57 H. Iinuma,36, 57 Y. Ikeda,68 K. Imai,30, 36, 57 J. Imrek,18 M. Inaba,68 D. Isenhower,1 M. Ishihara,57 T. Isobe,13, 57 M. Issah,63, 69
A. Isupov,31D. Ivanischev,56 Y. Iwanaga,24B.V. Jacak,64 J. Jia,8, 15, 63 X. Jiang,40J. Jin,15 B.M. Johnson,8 T. Jones,1 K.S. Joo,48 D. Jouan,54 D.S. Jumper,1 F. Kajihara,13S. Kametani,57N. Kamihara,58 J. Kamin,64
J.H. Kang,73 J. Kapustinsky,40 K. Karatsu,36, 57 M. Kasai,57, 59 D. Kawall,44, 58 M. Kawashima,57, 59 A.V. Kazantsev,35T. Kempel,29 A. Khanzadeev,56 K.M. Kijima,24 J. Kikuchi,70 A. Kim,20 B.I. Kim,34 D.H. Kim,48 D.J. Kim,32, 73 E. Kim,62 E.-J. Kim,11 S.H. Kim,73 Y.-J. Kim,26 E. Kinney,14 K. Kiriluk,14 ´
A. Kiss,19 E. Kistenev,8 J. Klay,39 C. Klein-Boesing,46D. Kleinjan,9L. Kochenda,56 B. Komkov,56M. Konno,68 J. Koster,26A. Kozlov,71A. Kr´al,16 A. Kravitz,15G.J. Kunde,40 K. Kurita,57, 59 M. Kurosawa,57M.J. Kweon,34 Y. Kwon,66, 73 G.S. Kyle,51R. Lacey,63Y.S. Lai,15 J.G. Lajoie,29 D. Layton,26A. Lebedev,29D.M. Lee,40J. Lee,20
K.B. Lee,34 K.S. Lee,34 T. Lee,62 M.J. Leitch,40 M.A.L. Leite,61 B. Lenzi,61 X. Li,12 P. Lichtenwalner,47 P. Liebing,58L.A. Linden Levy,14T. Liˇska,16A. Litvinenko,31 H. Liu,40, 51 M.X. Liu,40B. Love,69 D. Lynch,8
C.F. Maguire,69 Y.I. Makdisi,7 A. Malakhov,31 M.D. Malik,50 V.I. Manko,35 E. Mannel,15 Y. Mao,55, 57 L. Maˇsek,10, 28 H. Masui,68F. Matathias,15M. McCumber,64 P.L. McGaughey,40D. McGlinchey,14, 22 N. Means,64
B. Meredith,26 Y. Miake,68 T. Mibe,33 A.C. Mignerey,43 P. Mikeˇs,28K. Miki,57, 68 A. Milov,8 M. Mishra,4 J.T. Mitchell,8 A.K. Mohanty,5H.J. Moon,48 Y. Morino,13 A. Morreale,9D.P. Morrison,8,† T.V. Moukhanova,35 D. Mukhopadhyay,69T. Murakami,36J. Murata,57, 59 S. Nagamiya,33J.L. Nagle,14,‡ M. Naglis,71M.I. Nagy,19, 72 I. Nakagawa,57, 58 Y. Nakamiya,24K.R. Nakamura,36, 57 T. Nakamura,24, 57 K. Nakano,57, 67 S. Nam,20 J. Newby,39
M. Nguyen,64 M. Nihashi,24 T. Niida,68 R. Nouicer,8 A.S. Nyanin,35 C. Oakley,23 E. O’Brien,8 S.X. Oda,13 C.A. Ogilvie,29 M. Oka,68 K. Okada,58 Y. Onuki,57 A. Oskarsson,42 M. Ouchida,24, 57 K. Ozawa,13 R. Pak,8 A.P.T. Palounek,40V. Pantuev,27, 64 V. Papavassiliou,51I.H. Park,20J. Park,62 S.K. Park,34W.J. Park,34 S.F. Pate,51H. Pei,29 J.-C. Peng,26 H. Pereira,17V. Peresedov,31D.Yu. Peressounko,35R. Petti,64 C. Pinkenburg,8
R.P. Pisani,8M. Proissl,64M.L. Purschke,8 A.K. Purwar,40 H. Qu,23 J. Rak,32, 50 A. Rakotozafindrabe,37 I. Ravinovich,71 K.F. Read,53, 66 S. Rembeczki,21 K. Reygers,46 V. Riabov,56 Y. Riabov,56 E. Richardson,43
D. Roach,69 G. Roche,41 S.D. Rolnick,9 M. Rosati,29 C.A. Rosen,14 S.S.E. Rosendahl,42 P. Rosnet,41 P. Rukoyatkin,31P. Ruˇziˇcka,28 V.L. Rykov,57 B. Sahlmueller,46, 64 N. Saito,33, 36, 57, 58T. Sakaguchi,8S. Sakai,68
K. Sakashita,57, 67 V. Samsonov,56 S. Sano,13, 70 T. Sato,68S. Sawada,33 K. Sedgwick,9 J. Seele,14 R. Seidl,26, 58 A.Yu. Semenov,29 V. Semenov,25, 27 R. Seto,9 D. Sharma,71 I. Shein,25 T.-A. Shibata,57, 67 K. Shigaki,24
M. Shimomura,68 K. Shoji,36, 57 P. Shukla,5A. Sickles,8 C.L. Silva,29, 61 D. Silvermyr,53 C. Silvestre,17K.S. Sim,34 B.K. Singh,4 C.P. Singh,4 V. Singh,4 M. Sluneˇcka,10 A. Soldatov,25 R.A. Soltz,39 W.E. Sondheim,40 S.P. Sorensen,66 I.V. Sourikova,8F. Staley,17 P.W. Stankus,53 E. Stenlund,42 M. Stepanov,51 A. Ster,72 S.P. Stoll,8 T. Sugitate,24 C. Suire,54 A. Sukhanov,8 J. Sziklai,72E.M. Takagui,61 A. Taketani,57, 58 R. Tanabe,68
Y. Tanaka,49 S. Taneja,64 K. Tanida,36, 57, 58, 62M.J. Tannenbaum,8 S. Tarafdar,4 A. Taranenko,63P. Tarj´an,18 H. Themann,64 D. Thomas,1 T.L. Thomas,50 M. Togawa,36, 57, 58 A. Toia,64 L. Tom´aˇsek,28 Y. Tomita,68 H. Torii,24, 57 R.S. Towell,1V-N. Tram,37I. Tserruya,71Y. Tsuchimoto,24C. Vale,8, 29 H. Valle,69H.W. van Hecke,40
E. Vazquez-Zambrano,15A. Veicht,26J. Velkovska,69 R. V´ertesi,18, 72 A.A. Vinogradov,35M. Virius,16A. Vossen,26 V. Vrba,28 E. Vznuzdaev,56 X.R. Wang,51 D. Watanabe,24 K. Watanabe,68 Y. Watanabe,57, 58 F. Wei,29 R. Wei,63 J. Wessels,46 S.N. White,8 D. Winter,15 C.L. Woody,8 R.M. Wright,1 M. Wysocki,14 W. Xie,58 Y.L. Yamaguchi,13, 57, 70 K. Yamaura,24 R. Yang,26 A. Yanovich,25 J. Ying,23 S. Yokkaichi,57, 58 Z. You,55 G.R. Young,53 I. Younus,38, 50 I.E. Yushmanov,35W.A. Zajc,15 O. Zaudtke,46 C. Zhang,53 S. Zhou,12and L. Zolin31
(PHENIX Collaboration)
1Abilene Christian University, Abilene, Texas 79699, USA 2Institute of Physics, Academia Sinica, Taipei 11529, Taiwan
3Department of Physics, Augustana College, Sioux Falls, South Dakota 57197, USA 4Department of Physics, Banaras Hindu University, Varanasi 221005, India
5Bhabha Atomic Research Centre, Bombay 400 085, India
6Baruch College, City University of New York, New York, New York, 10010 USA
7Collider-Accelerator Department, Brookhaven National Laboratory, Upton, New York 11973-5000, USA 8Physics Department, Brookhaven National Laboratory, Upton, New York 11973-5000, USA
9University of California - Riverside, Riverside, California 92521, USA 10Charles University, Ovocn´y trh 5, Praha 1, 116 36, Prague, Czech Republic
11Chonbuk National University, Jeonju, 561-756, Korea
12Science and Technology on Nuclear Data Laboratory, China Institute of Atomic Energy, Beijing 102413, P. R. China 13Center for Nuclear Study, Graduate School of Science, University of Tokyo, 7-3-1 Hongo, Bunkyo, Tokyo 113-0033, Japan
14University of Colorado, Boulder, Colorado 80309, USA
15Columbia University, New York, New York 10027 and Nevis Laboratories, Irvington, New York 10533, USA 16Czech Technical University, Zikova 4, 166 36 Prague 6, Czech Republic
17Dapnia, CEA Saclay, F-91191, Gif-sur-Yvette, France 18Debrecen University, H-4010 Debrecen, Egyetem t´er 1, Hungary
19ELTE, E¨otv¨os Lor´and University, H - 1117 Budapest, P´azm´any P. s. 1/A, Hungary 20Ewha Womans University, Seoul 120-750, Korea
21Florida Institute of Technology, Melbourne, Florida 32901, USA 22Florida State University, Tallahassee, Florida 32306, USA
23Georgia State University, Atlanta, Georgia 30303, USA 24Hiroshima University, Kagamiyama, Higashi-Hiroshima 739-8526, Japan
25IHEP Protvino, State Research Center of Russian Federation, Institute for High Energy Physics, Protvino, 142281, Russia 26University of Illinois at Urbana-Champaign, Urbana, Illinois 61801, USA
27Institute for Nuclear Research of the Russian Academy of Sciences, prospekt 60-letiya Oktyabrya 7a, Moscow 117312, Russia 28Institute of Physics, Academy of Sciences of the Czech Republic, Na Slovance 2, 182 21 Prague 8, Czech Republic
29Iowa State University, Ames, Iowa 50011, USA
30Advanced Science Research Center, Japan Atomic Energy Agency, 2-4 Shirakata Shirane, Tokai-mura, Naka-gun, Ibaraki-ken 319-1195, Japan 31Joint Institute for Nuclear Research, 141980 Dubna, Moscow Region, Russia
32Helsinki Institute of Physics and University of Jyv¨askyl¨a, P.O.Box 35, FI-40014 Jyv¨askyl¨a, Finland 33KEK, High Energy Accelerator Research Organization, Tsukuba, Ibaraki 305-0801, Japan
34Korea University, Seoul, 136-701, Korea
35Russian Research Center “Kurchatov Institute”, Moscow, 123098 Russia 36Kyoto University, Kyoto 606-8502, Japan
37Laboratoire Leprince-Ringuet, Ecole Polytechnique, CNRS-IN2P3, Route de Saclay, F-91128, Palaiseau, France 38Physics Department, Lahore University of Management Sciences, Lahore, Pakistan
39Lawrence Livermore National Laboratory, Livermore, California 94550, USA 40Los Alamos National Laboratory, Los Alamos, New Mexico 87545, USA
41LPC, Universit´e Blaise Pascal, CNRS-IN2P3, Clermont-Fd, 63177 Aubiere Cedex, France 42Department of Physics, Lund University, Box 118, SE-221 00 Lund, Sweden
43University of Maryland, College Park, Maryland 20742, USA
44Department of Physics, University of Massachusetts, Amherst, Massachusetts 01003-9337, USA 45Department of Physics, University of Michigan, Ann Arbor, Michigan 48109-1040, USA
46Institut fur Kernphysik, University of Muenster, D-48149 Muenster, Germany 47Muhlenberg College, Allentown, Pennsylvania 18104-5586, USA
48Myongji University, Yongin, Kyonggido 449-728, Korea
49Nagasaki Institute of Applied Science, Nagasaki-shi, Nagasaki 851-0193, Japan 50University of New Mexico, Albuquerque, New Mexico 87131, USA 51New Mexico State University, Las Cruces, New Mexico 88003, USA 52Department of Physics and Astronomy, Ohio University, Athens, Ohio 45701, USA
53Oak Ridge National Laboratory, Oak Ridge, Tennessee 37831, USA 54IPN-Orsay, Universite Paris Sud, CNRS-IN2P3, BP1, F-91406, Orsay, France
55Peking University, Beijing 100871, P. R. China
56PNPI, Petersburg Nuclear Physics Institute, Gatchina, Leningrad region, 188300, Russia 57RIKEN Nishina Center for Accelerator-Based Science, Wako, Saitama 351-0198, Japan 58RIKEN BNL Research Center, Brookhaven National Laboratory, Upton, New York 11973-5000, USA
59Physics Department, Rikkyo University, 3-34-1 Nishi-Ikebukuro, Toshima, Tokyo 171-8501, Japan 60Saint Petersburg State Polytechnic University, St. Petersburg, 195251 Russia
61Universidade de S˜ao Paulo, Instituto de F´ısica, Caixa Postal 66318, S˜ao Paulo CEP05315-970, Brazil 62Seoul National University, Seoul, Korea
63Chemistry Department, Stony Brook University, SUNY, Stony Brook, New York 11794-3400, USA 64Department of Physics and Astronomy, Stony Brook University, SUNY, Stony Brook, New York 11794-3400, USA 65SUBATECH (Ecole des Mines de Nantes, CNRS-IN2P3, Universit´e de Nantes) BP 20722 - 44307, Nantes, France
66University of Tennessee, Knoxville, Tennessee 37996, USA
67Department of Physics, Tokyo Institute of Technology, Oh-okayama, Meguro, Tokyo 152-8551, Japan 68Institute of Physics, University of Tsukuba, Tsukuba, Ibaraki 305, Japan
69Vanderbilt University, Nashville, Tennessee 37235, USA 70Waseda University, Advanced Research Institute for Science and
Engineering, 17 Kikui-cho, Shinjuku-ku, Tokyo 162-0044, Japan 71Weizmann Institute, Rehovot 76100, Israel
72Institute for Particle and Nuclear Physics, Wigner Research Centre for Physics, Hungarian Academy of Sciences (Wigner RCP, RMKI) H-1525 Budapest 114, POBox 49, Budapest, Hungary
73Yonsei University, IPAP, Seoul 120-749, Korea (Dated: August 14, 2019)
Measurements of transverse-single-spin asymmetries (AN) in p+p collisions at √s = 62.4 and 200 GeV with the PHENIX detector at RHIC are presented. At midrapidity, AN is measured for neutral pion and eta mesons reconstructed from diphoton decay, and, at forward rapidities, neutral pions are measured using both diphotons and electromagnetic clusters. The neutral-pion measurement of ANat midrapidity is consistent with zero with uncertainties a factor of 20 smaller than previous publications, which will lead to improved constraints on the gluon Sivers function. At higher rapidities, where the valence quark distributions are probed, the data exhibit sizable asymmetries. In comparison with previous measurements in this kinematic region, the new data extend the kinematic coverage in √s and pT, and it is found that the asymmetries depend only weakly on √s. The origin of the forward AN is presently not understood quantitatively. The extended reach to higher pT probes the transition between transverse momentum dependent effects at low pT and multi-parton dynamics at high pT.
PACS numbers:
I. INTRODUCTION
The proton is a fundamental and stable bound state of quantum chromodynamics. Collinear perturbative quan-tum chromodynamics (pQCD) at leading twist in the op-erator product expansion successfully describes the quark and gluon substructure of the proton observed in high energy scattering experiments [1]. The parton distribu-tion funcdistribu-tions, fi(x, Q2), constitute the number densi-ties of partons of flavor i in the proton. They depend on the partonic momentum fraction, x, and on the
mo-∗Deceased
†PHENIX Co-Spokesperson: morrison@bnl.gov
‡PHENIX Co-Spokesperson: jamie.nagle@colorado.edu
mentum transfer scale, Q2. Two similar sets of distri-bution functions parametrize the spin dependent parton distributions in protons polarized either longitudinally or transversely with respect to the proton momentum direc-tion [2]. The longitudinally polarized structure has been successfully described using pQCD at leading twist [3].
Initially, transverse-single-spin asymmetries or the an-alyzing power (AN) of hadrons h produced in the trans-versely polarized p↑+ p → h + X reaction were expected to be small [4], but experiments instead measured large asymmetries of up to AN ≈ 40%. These asymmetries have been measured at increasing center-of-mass energies √
s over the past three decades, from 4.9 to 200 GeV [5– 10], Recent results from the Relativistic Heavy Ion Col-lider (RHIC) show that large asymmetries persist even up to√s = 200 GeV [11–13]. Unlike at the low to inter-mediate energies, the measured unpolarized cross section
at high energies is well reproduced by pQCD calcula-tions [11, 13], indicating that unpolarized collisions can be described by the standard collinear factorized theory, while transversely polarized collisions cannot.
To better describe the large AN measurements, the theoretical framework has been extended to include transverse momentum dependent (TMD) distributions and multi-parton dynamics (higher twist effects). Be-cause the intrinsic partonic transverse momentum scale is set by the mass of the proton, these effects dominate for hadrons with low momenta transverse to the beam axis, pT <∼ 1 GeV/c. At least two TMD effects have been proposed to explain the observed nonzero asymmetries.
The first of these, known as the Sivers effect, corre-lates the proton spin with the partonic transverse mo-mentum kT [14]. It has been measured in semi-inclusive deep inelastic scattering (SIDIS) experiments with sensi-tivity mainly to the quarks [15, 16]. Previous results in p+p collisions [17] have been used to constrain the gluon Sivers function [18]. Recently, this function has received intense theoretical attention based on questions of uni-versality and an expected sign change of AN in SIDIS compared to Drell-Yan production [19, 20].
A second transverse momentum dependent effect, known as the Collins effect, describes the coupling of a transverse quark polarization (transversity) and a trans-verse spin dependent fragmentation from a struck quark into a hadron [21]. The spin dependent fragmenta-tion part has been measured in e++e− annihilation for charged pions [22, 23] and serves as input for Collins asymmetries in proton scattering to access the transver-sity distribution [24–26]. The full integral over all par-tonic momenta 0 ≤ x ≤ 1 of the transversity distribution can be compared to the flavor-singlet tensor charge δΣ, which is calculable in lattice QCD [27, 28]. This will be a fundamental test of the theory.
At large transverse momenta the collinear higher twist effects are thought to become more important in the cre-ation of transverse spin asymmetries [29, 30]. For Drell-Yan production it has been shown that both initial state TMD and multi-parton dynamics provide equivalent de-scriptions of transverse asymmetries in an overlap region at intermediate transverse momenta [31]. With increas-ing pT the asymmetries are expected to fall off and van-ish in the strictly collinear regime, which has not been observed experimentally yet. It is best probed at high center-of-mass energies, where the range of transverse momenta is wider.
This paper reports on measurements of AN at √s = 62.4 and 200 GeV. The data were taken by the PHENIX experiment at RHIC in the years 2006 (√s = 62.4 GeV) and 2008 (√s = 200 GeV) with integrated luminosi-ties of 42 nb−1 and 4.3 pb−1, respectively. Results are presented for neutral mesons in a midrapidity region (|η| < 0.35) as well as for π0mesons and inclusive electro-magnetic clusters at forward/backward pseudorapidities (3.1 < |η| < 3.8). Section II describes the experimental setup along with the properties of the polarized proton
beams. The formalism of transverse single spin asymme-tries is introduced in Sec. III before details of the analysis procedure are specified. A general discussion of the re-sults and their possible implications for nucleon structure and contributing asymmetry mechanisms concludes this paper in Sec. IV.
II. EXPERIMENTAL SETUP
A. PHENIX Midrapidity and Global Detectors
The PHENIX midrapidity spectrometer is used to de-tect neutral pions and η mesons via their decay into two photons. The spectrometer covers a pseudorapidity range of |η| < 0.35 and is split into two approximately back-to-back arms each covering ∆ϕ = π/2 in azimuth. The electromagnetic calorimeter (EMCal) is highly seg-mented with ∆η × ∆ϕ ≈ 0.01 × 0.01. Events are selected using an EMCal based high tower energy trigger in coin-cidence with a minimum bias trigger. The trigger, digiti-zation electronics, and details of the hardware have been discussed previously [32]. The trigger efficiency starts at about 5% for neutral pions with pT ≈ 1 GeV/c and rises to and saturates at about 90% at pT > 3.5 GeV/c. A multi-wire proportional chamber with pad readout [33] is situated in front of the calorimeter face, and is used to veto charged particles.
The minimum bias trigger was defined as the coinci-dence of signals from two Beam Beam Counters (BBC) covering the full azimuthal angle and the pseudorapid-ity range 3.0 < |η| < 3.9 [34]. The BBCs are used to reconstruct the collision time and the collision (vertex) position along the beam direction. Each BBC is situated 144 cm from the nominal interaction point and comprises an array of 64 counters arranged around the beam pipe. Each counter comprises a ˇCerenkov quartz-radiator of hexagonal cross section with a mesh dynode photomulti-plier tube for read-out.
B. Muon Piston Calorimeter
The PHENIX Muon Piston Calorimeter (MPC) is an electromagnetic calorimeter which was designed to mea-sure photons and neutral mesons at forward-rapidity. The detector comprises two separate devices placed along the beamline to the North and to the South of the nom-inal interaction point, labeled N-MPC and S-MPC. The S-MPC was first installed in 2006 and the N-MPC fol-lowed a year later. Therefore, the analysis of the 2006 data set (√s=62.4 GeV) uses only the S-MPC while the 2008 data set (√s=200 GeV) includes both detectors.
Both MPCs are located in cavities of the steel pis-ton which is part of the PHENIX muon detector magnet yoke. The diameter of each cavity limits the detector’s outer diameter to 45 cm, while the beampipe requires an inner diameter of no less than 8 cm (N-MPC) or
Energy (au)
10 20 30 40 50 60 70 80Counts
1 10 2 10 3 10 4 10 5 10 Data: Inclusive Data: With Cuts FitGaussian Power Law
FIG. 1: (color online) Uncalibrated energy spectra with and without cuts to isolate minimum ionizing particles (MIP) in the MPC. These cuts include: neighboring tower en-ergy deposits and track-matching cuts using the upstream BBCs ˇCerenkov counters. The spectrum with the cut is fit with a power law and a Gaussian. The Gaussian peak po-sition is taken as the most probable MIP energy deposit, E≈ 234 MeV.
10 cm (S-MPC). The MPCs are placed ±220 cm from the nominal interaction point and are composed of 192 (S-MPC) or 220 (N-(S-MPC) towers stacked to form an annu-lus around the beampipe. The detector acceptance cov-ers the full azimuthal angle and a pseudorapidity range of −3.8 < η < −3.1 South and 3.1 < η < 3.9 North of the nominal interaction point.
Each tower combines a PbWO4 scintillating crys-tal wrapped with Tyvek R
, aluminized mylar and MonoKote R
, with a Hamamatsu S8664-55 avalanche photodiode for read-out. Each crystal measures 2.2×2.2×18 cm3, corresponding to a depth of 21.2 radi-ation lengths and 0.844 nuclear interaction lengths. In-dependently of the minimum bias trigger, the MPC is equipped with its own high energy cluster trigger. The trigger and digitization electronics are identical to those of the EMCal and are discussed in detail in [32]. For the presented data, the trigger efficiency starts at 5% for photon energies E ≈ 30 GeV and reaches a plateau at 90% above E > 50 GeV.
A test-beam measurement, carried out at the Meson Test Beam Facility1 at the Fermi National Accelerator
1 now the MT6 area at the Fermilab Test Beam Facility
Laboratory confirmed the calorimeter’s linear energy re-sponse and measured the electromagnetic shower shapes. These shower shapes were then used to tune a geant 3.21 [35] based full detector simulation. The absolute energy scale of the detector is determined in situ using a two-step process. First, minimum ionizing particles are used. Yields of charged tracks in the calorimeter are enhanced by requiring a correlated hit in the BBC that is located in front of the MPC. Additionally, the tower multiplicity of the cluster is required to be small compared to a typical electromagnetic shower to increase the hadronic contributions. A sample minimum ionizing particle peak is shown in Fig. 1 with an expected mean energy of 234 MeV. The initial MIP calibration is then used as the seed in an iterative and converging procedure for individual towers that is based on the π0 peak in the invariant mass distribution. Time dependencies in the tower gains are tracked and corrected for by a monitoring system of LEDs, whose intensities are monitored by PIN diodes. Finally, the overall calibration is verified and the energy resolution is determined by comparing the masses of the π0 and η peaks in the two-cluster invariant mass distributions between data and a Monte-Carlo simula-tion. A set of representative two-cluster invariant mass peaks is shown in Fig. 2. The relative energy resolution (δE/E) of the calorimeter is found to be 13%/√E⊕8% with an overall energy scale uncertainty of 2%.
) 2 (GeV/c invariant M 0 0.1 0.2 0.3 0.4 0.5 Counts 5 10 15 20 25 3 10 ×
Trigger: Minimum Bias (11 < E < 17 GeV) North South ) 2 (GeV/c invariant M 0.3 0.4 0.5 0.6 0.7 0.8 0.9 1 Counts 100 200 300 400 500 600 700 800 Trigger: MPC (40 < E < 80 GeV)
FIG. 2: (color online) Two-cluster invariant mass distribu-tions from the 2008 data set at√s=200 GeV for both the North and South MPC detectors. The left panel shows π0 peak from minimum bias triggered data set at low energy while the right side shows the η meson peak from the MPC triggered data set at high two-cluster energies E. A compari-son of the peak position and widths from data and simulation are used to determine the energy scale uncertainty.
C. Polarized Proton Beams
RHIC accelerates and stores polarized proton beams at energies up to 255 GeV in two independent rings. The beams collide at several interaction points along the ring. Each ring can be filled with up to 120 bunches with differ-ent transverse polarization directions. These directions alternate to reduce systematic effects from slow
varia-tions in luminosity or detector acceptances and efficien-cies. Additionally, the patterns are chosen from four pre-defined basic patterns to reduce time dependent correla-tions and detector effects.
Previous publications describe in detail the necessary accelerator instrumentation for producing the colliding polarized beams [36]. The polarization is measured with a set of polarimeters external to the PHENIX experi-ment using elastic scattering from a hydrogen gas jet or a Carbon fiber target. For the determination of the ab-solute polarization of both proton beams, the hydrogen jet polarimeter with a known polarization of the atomic jet is used [37]. Due to the low density of the gas jet a polarization measurement with good accuracy requires many hours of data taking. Therefore, the relative polar-ization is measured several times per fill with high preci-sion by fast p+C polarimeters for each of the two storage rings [38]. These relative measurements are then normal-ized using results from the jet polarimeter.
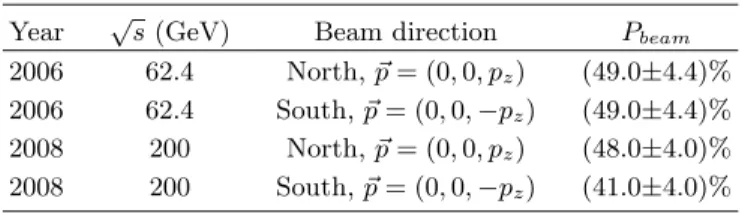
While both of the RHIC beams are polarized dur-ing the measurement of the sdur-ingle spin asymmetries pre-sented in this paper, summation over the bunches of one beam effectively averages the polarization to zero. This procedure is applied to one of the two beams at a time and can therefore be used as a cross check of two uncor-related measurements of the asymmetry. The direction of the polarized beam is commonly referred to as for-ward in the following; backfor-ward is in the direction of the unpolarized beam. Table I summarizes the beam po-larizations for the different data sets and center-of-mass energies, with ~p = (0, 0, pz) pointing North, according to the PHENIX coordinate system.
TABLE I: Polarizations for RHIC proton beams in 2006 and 2008. The polarization uncertainty is a global scale uncer-tainty of the measured asymmetries AN and is not included in any of the figures or data tables.
Year √s(GeV) Beam direction Pbeam
2006 62.4 North, ~p= (0, 0, pz) (49.0±4.4)%
2006 62.4 South, ~p= (0, 0, −pz) (49.0±4.4)%
2008 200 North, ~p= (0, 0, pz) (48.0±4.0)%
2008 200 South, ~p= (0, 0, −pz) (41.0±4.0)%
The stable polarization direction around the accelera-tor is vertical (P↑= (0, P, 0) or P↓= (0, −P, 0)) and can be changed by spin rotators around the collision points. The transverse components of the polarization vector are measured locally in PHENIX. In 2008, the polarization of the North pointing beam was tilted from the verti-cal direction by ϕ0 = 0.263 ± 0.030stat± 0.090syst rad. For the rest of the measurements, all other polarization vectors are found to be consistent with the vertical di-rection within statistical uncertainties [39]. The polar-ization directions are accounted for in the determination of the relevant asymmetries. In addition, the 2006 and 2008 polarization direction measurements have been
in-dependently verified using the analysis techniques from Sec. III A.
III. ANALYSIS
A. Transverse-Single-Spin Asymmetries
The AN that can generally arise in polarized scatter-ing experiments are described in the framework of polar-ization analyzing tensors which gives information about fully polarized initial and final states of the scattering process. The polarization can be aligned along three di-mensions in the scattering frame, i.e., longitudinal in the projectile direction ~L, sideways in the scattering (or pro-duction) plane ~S, or normal to the scattering plane ~N , where ~S = ~N × ~L. In the following, the left side refers to the direction of ~S in this right-handed system, the right side to the opposite direction. For AN, we are only con-sidering a normal polarization for the projectile. Target and final states are unpolarized. The normal space quan-tization can create a transverse asymmetry within the scattering plane. A rotation into the laboratory frame (where the beam polarization P is prepared) then trans-forms this pure left-right asymmetry into an azimuthal (ϕ) modulation of the cross section dσ(ϕ) ∝ AN·P ·cos ϕ. The transverse asymmetry AN can be determined from point-like detectors as:
AN = 1 P · 1 cos ϕ dσ(ϕ) − dσ(ϕ + π) dσ(ϕ) + dσ(ϕ + π). (1) The same result can be achieved with a detector in just one hemisphere by a rotation of the polarization vector P↑→ P↓:
dσ↑(ϕ) = dσ↓(ϕ + π) dσ↓(ϕ) = dσ↑(ϕ + π).
Integrating the cross sections over the detector accep-tance, beam luminosities, and the duration of the mea-surement, AN is experimentally extracted from the geo-metric means of the particle yields:
ǫ(ϕ) = AN · P · cos ϕ = q NL↑· N ↓ R− q NL↓· N ↑ R q NL↑· NR↓ + q NL↓· NR↑ , (2)
where NL, NR refer to particle yields in detector seg-ments ∆ϕ of the left (ϕ) and right (ϕ + π) hemispheres. An alternate estimator is used to study systematic effects
ǫ(ϕ) = AN · P · cos ϕ =
N↑− R · N↓
N↑+ R · N↓, (3) with R being the ratio of luminosities between the two spin states ↑ and ↓. This luminosity is determined using the polarization-sorted counts from the minimum bias
trigger. The asymmetries in this analysis are calculated in 8 or 16 bins in the azimuth, unless noted otherwise, and then fit to the cosine modulation (with and without an additional free phase ϕ0 for consistency checks). Sys-tematic uncertainties are estimated by comparing asym-metries from Eqs. 2 and 3, which may be due to different assumptions in the integration of the cross sections.
B. AπN0 at √
s= 62.4 GeV and High xF Measurements at √s = 62.4 GeV were carried out in 2006 with the South MPC, from a total of 3.6 ×10⁷MPC triggered events. The π0→ γ + γ decay is reconstructed from pairs of clusters in the detector with a selection on the photon shower shape. Clusters which have their cen-tral tower marked as either noisy or inactive are removed from the analysis. The π0 contribution is selected from the cluster pairs by requiring a minimum pair energy, Epair> 6 GeV, and an upper limit of 0.6 on the energy asymmetry α of the two cluster energies E1 and E2,
α = E1− E2 E1+ E2 . (4)
The two cluster invariant mass distributions look qual-itatively similar to those from √s = 200 GeV shown in Fig. 2. The shape of the distributions has been studied in simulations based on the pythia event generator [40] Tune A [41] with a full detector simulation (similar to Sec. II.B). The background is dominated by combinato-rial effects from reconstructing two clusters from different parent sources. The background yield is determined by mixing uncorrelated clusters from different events and normalizing to the invariant mass distribution above the π0 peak, but below any contribution from the η peak. From the integral of the resulting π0 peak one can deter-mine the π0 yields. The final asymmetries are calculated according to Eq. 2 from the geometrical means of the π0 yields. The systematic uncertainties to these asymme-tries are estimated using Eq. 3.
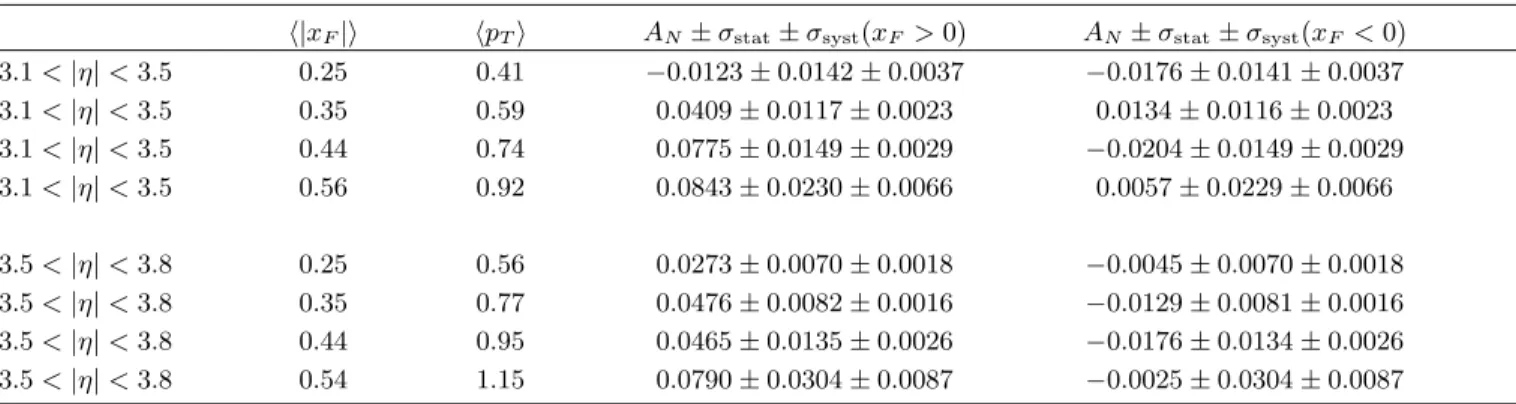
Figure 3 shows AN at√s = 62.4 GeV as a function of xF = 2 · pz/√s, with pz being the longitudinal compo-nent of the momentum along the direction of the polar-ized proton beam. While there is a significant, nonzero asymmetry rising with xF > 0 in the forward direction, no such behavior can be seen at negative xF < 0 where the asymmetries are consistent with zero. Figure 4 shows the pT dependence of AN, up to a range that is largely limited by kinematics due to the low 62.4 GeV center-of-mass energy. No strong pT dependence is observed.
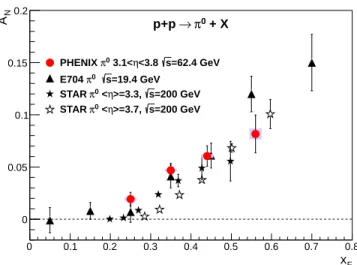
Figure 5 compares the xF-dependence of neutral pion AN of this publication with the world data set [10, 11] at center-of-mass energies from √s = 19.4 to 200 GeV. Although the different measurements were carried out with slightly different detector acceptances, there is a general agreement between the asymmetries in the on-set of nonvanishing asymmetries and the xF dependence.
F x -0.6 -0.4 -0.2 0 0.2 0.4 0.6 N A -0.04 -0.02 0 0.02 0.04 0.06 0.08 0.1 0.12 =62.4GeV s + X, 0 π → p+p |<3.8 η , 3.5<| 0 π PHENIX |<3.5 η , 3.1<| 0 π PHENIX
FIG. 3: (color online) Neutral pion AN at√s= 62.4 GeV as function of xF in two different pseudorapidity ranges (3.1 < |η| < 3.5 and 3.5 < |η| < 3.8) with statistical and systematic uncertainties. Appendix Table III gives the data in plain text. An additional uncertainty from the beam polarization (see Table I) is not included.
T p 0.5 0.6 0.7 0.8 0.9 1 N A 0 0.01 0.02 0.03 0.04 0.05 0.06 0.07 0.08 >0 F =62.4GeV, x s + X, 0 π → p+p
FIG. 4: Neutral pion AN at √s= 62.4 GeV as function of transverse momentum pT Appendix Table IV gives the plain text data. An additional uncertainty from the beam polar-ization (see Table I) is not included.
The asymmetries appear to be independent of the center-of-mass energy, including at high energies where the ap-plicability of pQCD is well established at√s = 200 GeV at pT > 2 GeV/c.
Figure 6 shows the pion isospin dependence of AN at √
s = 62.4 GeV with combined RHIC data from the new π0 PHENIX data and charged pion data from the BRAHMS collaboration [10]. The BRAHMS measure-ments of charged pions were carried out with two detector settings covering different subranges in pseudorapidity which compare well to the acceptance of the MPC. While
F x 0 0.1 0.2 0.3 0.4 0.5 0.6 0.7 0.8 N A 0 0.05 0.1 0.15 0.2 =62.4 GeV s <3.8 η 3.1< 0 π PHENIX =19.4 GeV s 0 π E704 =200 GeV s >=3.3, η < 0 π STAR =200 GeV s >=3.7, η < 0 π STAR + X 0 π → p+p
FIG. 5: (color online) Comparison of neutral pion ANas func-tion of xF from√s= 19.4 to 200 GeV from this publication and [7, 11]. Appendix Table V gives the data in plain text.
π+ and π0 asymmetries are positive, those of π− are of opposite sign. The amplitudes of the charged pion asym-metries are of similar size, with the π− perhaps slightly larger, whereas both are significantly larger than the neu-tral pion asymmetry.
F x 0.2 0.25 0.3 0.35 0.4 0.45 0.5 0.55 0.6 0.65 0.7 N A -0.5 -0.4 -0.3 -0.2 -0.1 0 0.1 0.2 0.3 <3.8 η , 3.1< 0 π PHENIX =3.6 η , + π BRAHMS =3.9 η , + π BRAHMS =3.6 η , -π BRAHMS =3.9 η , -π BRAHMS =62.4GeV s + X, π → p+p
FIG. 6: (color online) Isospin comparison of pion AN as a function of xF at √s = 62.4 GeV from this publication and [10]. Appendix Table V gives the data in plain text.
C. Acluster
N at
√
s= 200 GeV and High xF At energies below Eπ0 <
∼ 20 GeV the MPC is able to resolve the π0
→ γ + γ decay. However, with in-creasing energy, the opening angle between the two pho-tons becomes so small that their electromagnetic clusters fully merge in the detector. This limits the xF range at
√
s = 200 GeV to below 0.2 for π0’s reconstructed via the two-gamma decay mode. To overcome this limitation the data analysis is done for inclusive clusters.
The data set at√s = 200 GeV includes 1.8×10⁸events recorded with a high energy cluster trigger. Clusters in the analysis are required to have fired the corresponding trigger, i.e., N-MPC or S-MPC, and to satisfy a time of flight cut. Clusters whose central tower is either marked noisy or inactive are removed from the analysis. The con-tributions from hadrons to the cluster yields are reduced by selecting for photonic shower shapes. To minimize ef-fects from energy leakage at the detector edges, a radial fiducial cut is applied. The transverse asymmetries are determined with Eq. 2 and systematic uncertainties are estimated using the difference from Eq. 3.
The cluster composition is estimated using Monte Carlo simulations. Again, a full detector simulation is based on input from pythia 6.421 Tune A with separate normalization factors between direct photons (k = 2) and all other particles originating from high energy scat-tering processes (k = 1) with a minimum pT of 2 GeV. The normalization factors are determined by comparing the simulated cross sections with RHIC measurements at√s = 200 GeV [42–45]. The composition analysis dif-ferentiates between electromagnetic clusters originating from photonic decays of π0and η mesons, direct photons, and energy deposited by charged hadrons (h±). Contri-butions from other sources, e.g. fragmentation photons and ω meson decays, are combined in the “other γ” cat-egory.
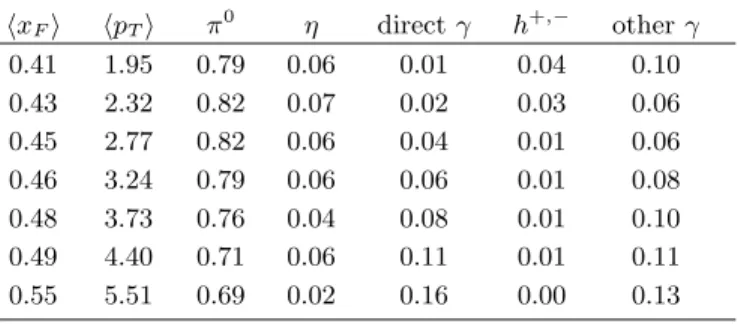
Figure 7 summarizes the cluster composition as func-tion of pT with large xF > 0.4; Table II lists the corre-sponding values in detail. In the context of this pythia study, over the studied kinematic range contributions from decay photons of π0mesons are the dominant source of clusters in the MPC. With increasing pT there is a siz-able increase in contributions from direct and other pho-tons. The relative uncertainty of the composition from this study at pT > 5 GeV/c is less than 20% and signifi-cantly smaller at lower pT.
Figure 8 summarizes the xF-dependence of the clus-ter AN for two different pseudorapidity ranges similar to Fig. 3. Systematic uncertainties again are evaluated by comparison of results from Eqs. 2 and 3. Within statisti-cal uncertainties the asymmetries in the backward direc-tion xF < 0 are found to be consistent with zero, whereas in the forward direction AN rises almost linearly with xF. The asymmetries are of similar size compared to earlier results at different center-of-mass energies as shown in Fig. 5.
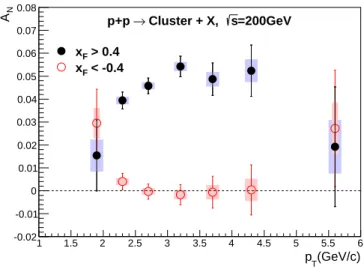
Figure 9 presents AN, as a function of transverse mo-mentum pT for values of |xF| > 0.4 where AN is largest in forward kinematics (compare Fig. 8). The asymme-try rises smoothly and then seems to saturate above pT > 3 GeV/c. A significant decrease of the asymme-try as expected from higher twist calculations is not ob-served [31]. Again, negative xFasymmetries are found to be consistent with zero within statistical uncertainties.
(GeV/c)
T
p
2 3 4 5 6 7
Fractional cluster composition
0 0.1 0.2 0.3 0.4 0.5 0.6 0.7 0.8 0.9 1 γ other +/-h η γ direct 0 π
FIG. 7: Cluster composition from p+p Monte Carlo event generator studies at√s= 200 GeV with a full detector sim-ulation. The kinematic cuts and pT ranges are the same as used in the data analysis and directly comparable to Fig. 9, in particular xF >0.4. F x -0.6 -0.4 -0.2 0 0.2 0.4 0.6 N A -0.04 -0.02 0 0.02 0.04 0.06 0.08 0.1 0.12 =200GeV s Cluster + X, → p+p |<3.8 η 3.5<| |<3.5 η 3.1<|
FIG. 8: (color online) The AN of electromagnetic clusters at √
s= 200 GeV as function of xF and in two different pseu-dorapidity ranges. Appendix Table VI gives the data in plain text. An additional uncertainty from the beam polarization (see Table I) is not included.
Figure 10 shows AN as a function of pT for different ranges of xF. These ranges are chosen to match that of an earlier measurement of π0 asymmetries from the STAR experiment [11]. The two measurements in general dis-play a good agreement. At large xF and high pT there is perhaps a hint that the inclusive cluster asymmetries are smaller, but with present statistics the difference is not yet significant. We note that the STAR measurement is for identified π0’s and the PHENIX measurement is for clusters with a mixed composition. As mentioned previ-ously, these clusters are dominantly from π0’s, but also include contributions from the decays of η and other neu-tral mesons, as well as a contribution from direct photons
(GeV/c) T p 1 1.5 2 2.5 3 3.5 4 4.5 5 5.5 6 N A -0.02 -0.01 0 0.01 0.02 0.03 0.04 0.05 0.06 0.07 0.08 =200GeV s Cluster + X, → p+p > 0.4 F x < -0.4 F x
FIG. 9: (color online) The AN of electromagnetic clusters at √s = 200 GeV at large |xF| > 0.4 in forward/backward directions as function of pT. Appendix Table VII gives the data in plain text. An additional uncertainty from the beam polarization (see Table I) is not included.
0 0.02 0.04 0.06 0.08 0.1 0.12 0.14 < 0.3 F (a) 0.25 < x =200 GeV s Cluster + X → p+p + X (STAR) 0 π → p+p < 0.35 F (b) 0.3 < x 0 0.02 0.04 0.06 0.08 0.1 0.12 0.14 < 0.4 F (c) 0.35 < x < 0.47 F (d) 0.4 < x 0 1 2 3 4 5 0 0.02 0.04 0.06 0.08 0.1 0.12 0.14 < 0.56 F (e) 0.47 < x 0 1 2 3 4 5 < 0.85 F (f) 0.56 < x N A (GeV/c) T p
FIG. 10: (color online) Comparison of ANof electromagnetic clusters and π0 mesons [11] at√s= 200 GeV as function of pT in different ranges of xF. Appendix Table VIII gives the data in plain text. An additional uncertainty from the beam polarization (see Table I) is not included.
D. Aπ0,η
N at
√
s=200 GeV and Small xF The data selection and asymmetry analysis in the midrapidity spectrometer closely follows the procedure of previous analyses [17]. The data set includes 6.9 × 10⁸events triggered by the high p
T photon trigger. Pho-ton clusters are selected using phoPho-tonic shower shape cuts in the electromagnetic calorimeter, the time of flight be-tween the collision point and the calorimeter, a minimum deposited energy of 200 MeV, and a charged particle veto from tracking in front of the calorimeter. Cluster pairs are then chosen with an energy asymmetry (Eq. 4) of less than 0.8 (0.7) for π0 (η) identification, and by requiring that the photon with the higher energy fired the trigger. The yields are taken as the number of cluster pairs in a ±25 MeV/c2window around the mean of the π0 peak in the invariant mass distribution (±70 MeV/c2around the mean of the η mass). The width of the π0peak decreases from 12 to 9 MeV/c2as p
T increases from 1 to 12 GeV/c (35 to 25 MeV/c2 for the η). The background fractions in the signal windows depend on pT and range from 29% to 4% under the π0peak and 75% to 41% for the η peak as pT increases.
To remove a possible background asymmetry, the weighted asymmetry between a low and high mass re-gion around the signal peak is determined and subtracted from the signal region. These regions are defined from 47 to 97 and from 177 to 227 MeV/c2 for the π0, and from 300 to 400 and from 700 to 800 MeV/c2 for the η meson. The signal asymmetry AsignalN can be calculated using yields from the peak region Nincl and from the in-terpolated background yields Nbg:
AsignalN =A incl N − rA bg N 1 − r , (5)
with the background fraction r = Nbg/Ninclunder either the π0 or η signal. The background asymmetries are all consistent with zero.
Due to the limited azimuthal acceptance of the midra-pidity spectrometer the asymmetries are only measured from integrated yields in the whole detector hemispheres to the left and right of the polarization direction. To account for the cosine modulation of the particle produc-tion, the asymmetries need to be corrected by an average factor f = 1/hcos ϕi taken over the detector acceptance. The asymmetries are calculated from Eq. 2, and the cor-responding systematic uncertainties are estimated from differences with Eq. 3.
Both the inclusive and background asymmetries are de-termined for each RHIC fill to test for possible variations with time. The mean values are then used for the cal-culation of the final asymmetries for π0and η mesons as function of pT, see Fig. 11 and Tables IX and X. The fig-ure shows the asymmetries for the whole detector accep-tance (|η| < 0.35) and for two samples selecting slightly forward/backward going particles (0.2 < |η| < 0.35). It is important to note that the data in the restrictive pseu-dorapidity ranges are sub-samples of the larger inclusive
-0.1 -0.05 0 0.05 0.1 + X 0 π → (a) p+p 0 0.002 -0.002 0.004 -0.004 1 2 3 4 5
0
2
4
6
8
10
12
-0.1
-0.05
0
0.05
0.1
0.15
0.2
+ X
η
→
(b) p+p
< 0.35 η -0.35 < > 0 F | < 0.35, x η 0.20 < | < 0 F | < 0.35, x η 0.20 < | N A (GeV/c) T p=200 GeV
s
p+p
FIG. 11: (color online) The AN measured at midrapidity (|η| < 0.35), as function of pTfor π0(a) and η (b) mesons (see Tables IX and X). Triangles are slightly forward/backward go-ing sub-samples of the full data set (circles). These are shifted in pT for better visibility. An additional uncertainty from the beam polarization (see Table I) is not included.
data set. These very precise results are all consistent with zero over the observed pT range.
IV. DISCUSSION
The AN of neutral pions and inclusive charged hadrons have previously been measured with the PHENIX midra-pidity spectrometer [17]. Those asymmetries have been found to be consistent with zero and have been used to constrain the gluon Sivers function [18] despite their limited statistical precision. The new results shown in Fig. 11 exceed the former precision by a factor of 20 for the π0 transverse asymmetries while extending the p
T reach to above 10 GeV/c. Also, this paper reports on AN of η mesons at xF ≈ 0 which extends previous re-sults [46] both in√s and pT. Altogether, no significant deviation from zero can be seen in the results within the
statistical uncertainties in the covered transverse momen-tum range. Any difference in the two meson asymmetries would likely be dominated by fragmentation effects. Ei-ther these are small or suppressed by the contributing transversity distribution in the covered kinematic range. In the forward direction, nonvanishing meson asym-metries persist all the way up to √s = 200 GeV, as shown in Figs. 3 and 8. While there is no asymmetry in the backward direction (xF < 0), AN scales almost linearly with positive xF > 0.2. This behavior is similar to previous experimental results, as summarized in Fig. 5, where no strong center-of-mass energy dependence of the asymmetry is observed. The kinematic coverage of the experiments is not exactly the same and may account for the small differences in the data, but it is striking how well the data match between measurements taken over center-of-mass collision energies that vary by more than an order of magnitude, from√s = 19.4 to 200 GeV. If the same mechanisms are responsible across this entire colli-sion energy range, then these mechanisms seem to have a weak dependence over the interaction scale Q spanned by the world’s data.
At forward rapidity xF is linearly proportional to the polarized parton momentum fraction x1:
xF ≡ 2pL/ √
s ≈ 2hzipjet/ √
s ≈ hzix1, (6) where hzi is the mean momentum fraction of the hadron from the jet fragmentation. This suggests the possibil-ity that these asymmetries are largely created by some intrinsic function of x that is only weakly dependent on the collision energy.
Further, from a comparison of the asymmetries of the pion isospin triplet at√s = 62.4 GeV, see Fig. 6, one can conclude that the Sivers effect is not the dominant source of the observed transverse asymmetries. pythia event generator studies show that the production of π−are al-most equally from unfavored u and favored d quark frag-mentation, while π+ are almost exclusively from favored u quark fragmentation. At the same time, about three in four π0 stem from u quarks, with the other fourth com-ing from d quarks. Because the Sivers effect comes from the initial state quarks, the data can not be explained by these initial state effects alone, under the assumption that the ratio of the u and d quark Sivers functions (es-pecially at high x) are the same as those extracted from SIDIS [47], According to these assumptions, one should naively expect a small Sivers effect asymmetry for the π+, which has roughly equivalent and canceling contri-butions from u and d quarks. Instead a large asymmetry is observed for the π+.
Collinear higher twist calculations predict that AN de-creases with increasing transverse momentum once pT is of the same order as the partonic momentum scale Q and both are much larger than ΛQCD [31]. Where this turnover of the initially rising AN happens is largely unknown, though. The cluster asymmetries in Fig. 9 have an extended pT-range compared to previous mea-surements of π0 mesons [11], but the data still do not
allow for a conclusive answer for the onset of this drop of the asymmetry up to pT > 4 GeV/c.
The electromagnetic cluster contributions at √s = 200 GeV are dominated by π0 decays, as demonstrated in Fig. 7. With rising pT, the fraction of direct and other photons increases while the contribution from η mesons does not change significantly. A comparison of the cluster asymmetries with those of π0mesons from STAR [11] in Fig. 10 is largely consistent at small xF and statistically limited at xF > 0.47, where the direct photon contribu-tion to the inclusive clusters becomes more important. Transverse asymmetries of direct photons are of special interest in the future because they directly relate to the Sivers effect and its process dependence [48].
The data presented in this paper provide crucial in-put to the long-standing question of the source of AN in hadronic collisions. The extended statistics of AN mea-surements for π0 and η at midrapidity, the cluster A
N at 200 GeV, the complete isospin triplet of asymmetries at 62.4 GeV, and the extended range over beam colli-sion energies, all quantitatively test the various theories seeking to explain these asymmetries. In particular, the high statistics midrapidity data strongly constrain the presence of a gluon Sivers effect at midrapidity. The PHENIX data on π0transverse asymmetries, along with the world data, do not allow for a strong evolution with Q2 in the combined effects from whatever causes these asymmetries. Finally, the mix of favored versus unfa-vored fragmentation for the three different pion states, and how these contribute to the asymmetries, also place constraints on the strengths of the contributing effects.
ACKNOWLEDGMENTS
We thank the staff of the Collider-Accelerator and Physics Departments at Brookhaven National Labora-tory and the staff of the other PHENIX participating institutions for their vital contributions. We acknowl-edge support from the Office of Nuclear Physics in the Office of Science of the Department of Energy, the Na-tional Science Foundation, a sponsored research grant from Renaissance Technologies LLC, Abilene Christian University Research Council, Head of Department of Physics, University of Illinois at Urbana Champaign, Re-search Foundation of SUNY, and Dean of the College of Arts and Sciences, Vanderbilt University (U.S.A), Min-istry of Education, Culture, Sports, Science, and Tech-nology, the Japan Society for the Promotion of Science, and Head Investigator, Graduate School of Science, Hi-roshima University (Japan), Conselho Nacional de De-senvolvimento Cient´ıfico e Tecnol´ogico and Funda¸c˜ao de Amparo `a Pesquisa do Estado de S˜ao Paulo (Brazil), Nat-ural Science Foundation of China (P. R. China), Min-istry of Education, Youth and Sports (Czech Repub-lic), Centre National de la Recherche Scientifique, Com-missariat `a l’´Energie Atomique, and Institut National de Physique Nucl´eaire et de Physique des Particules
(France), Bundesministerium f¨ur Bildung und Forschung, Deutscher Akademischer Austausch Dienst, and Alexan-der von Humboldt Stiftung (Germany), Hungarian Na-tional Science Fund, OTKA (Hungary), Department of Atomic Energy and Department of Science and Technol-ogy (India), Israel Science Foundation (Israel), National Research Foundation and WCU program of the Min-istry Education Science and Technology (Korea), Physics Department, Lahore University of Management Sciences (Pakistan), Ministry of Education and Science, Russian Academy of Sciences, Federal Agency of Atomic En-ergy, and Program Coordinator, Russian Research Cen-ter, Kurchatov Institute (Russia), VR and Wallenberg Foundation (Sweden), the U.S. Civilian Research and Development Foundation for the Independent States of the Former Soviet Union, the US-Hungarian Fulbright Foundation for Educational Exchange, and the US-Israel Binational Science Foundation.
APPENDIX
Data tables of measured AN with statistical and sys-tematic uncertainties and cluster composition for cluster asymmetries at forward pseudorapidities.
TABLE II: Fractional composition of electromagnetic clusters in the MPC at√s= 200 GeV for xF >0.4, as shown in Fig. 7.
hxFi hpTi π0 η direct γ h+,− other γ 0.41 1.95 0.79 0.06 0.01 0.04 0.10 0.43 2.32 0.82 0.07 0.02 0.03 0.06 0.45 2.77 0.82 0.06 0.04 0.01 0.06 0.46 3.24 0.79 0.06 0.06 0.01 0.08 0.48 3.73 0.76 0.04 0.08 0.01 0.10 0.49 4.40 0.71 0.06 0.11 0.01 0.11 0.55 5.51 0.69 0.02 0.16 0.00 0.13
TABLE III: The AN at√s= 62.4 GeV as a function of xF for two pseudorapidity ranges, as shown in Fig. 3.
h|xF|i hpTi AN± σstat± σsyst(xF >0) AN± σstat± σsyst(xF <0)
3.1 < |η| < 3.5 0.25 0.41 −0.0123 ± 0.0142 ± 0.0037 −0.0176 ± 0.0141 ± 0.0037 3.1 < |η| < 3.5 0.35 0.59 0.0409 ± 0.0117 ± 0.0023 0.0134 ± 0.0116 ± 0.0023 3.1 < |η| < 3.5 0.44 0.74 0.0775 ± 0.0149 ± 0.0029 −0.0204 ± 0.0149 ± 0.0029 3.1 < |η| < 3.5 0.56 0.92 0.0843 ± 0.0230 ± 0.0066 0.0057 ± 0.0229 ± 0.0066 3.5 < |η| < 3.8 0.25 0.56 0.0273 ± 0.0070 ± 0.0018 −0.0045 ± 0.0070 ± 0.0018 3.5 < |η| < 3.8 0.35 0.77 0.0476 ± 0.0082 ± 0.0016 −0.0129 ± 0.0081 ± 0.0016 3.5 < |η| < 3.8 0.44 0.95 0.0465 ± 0.0135 ± 0.0026 −0.0176 ± 0.0134 ± 0.0026 3.5 < |η| < 3.8 0.54 1.15 0.0790 ± 0.0304 ± 0.0087 −0.0025 ± 0.0304 ± 0.0087
TABLE IV: The AN as a function of pT at√s= 62.4 GeV, as shown in Fig. 4.
hpTi h|xF|i AN± σstat± σsyst(xF >0) AN± σstat± σsyst(xF <0)
3.1 < η < 3.8 0.53 0.29 0.0291 ± 0.0120 ± 0.0025 −0.0091 ± 0.0117 ± 0.0025
3.1 < η < 3.8 0.67 0.34 0.0577 ± 0.0084 ± 0.0019 −0.0055 ± 0.0081 ± 0.0018
3.1 < η < 3.8 0.82 0.39 0.0458 ± 0.0093 ± 0.0019 −0.0227 ± 0.0093 ± 0.0019
3.1 < η < 3.8 1.01 0.45 0.0687 ± 0.0118 ± 0.0014 −0.0112 ± 0.0114 ± 0.0013
TABLE V: The AN at√s= 62.4 GeV as a function of xF, as shown in Figs. 5 and 6.
h|xF|i hpTi AN± σstat± σsyst(xF >0) AN± σstat± σsyst(xF <0)
3.1 < |η| < 3.8 0.25 0.52 0.0193 ± 0.0065 ± 0.0017 −0.0067 ± 0.0065 ± 0.0017
3.1 < |η| < 3.8 0.35 0.71 0.0469 ± 0.0067 ± 0.0013 −0.0017 ± 0.0066 ± 0.0013
3.1 < |η| < 3.8 0.44 0.86 0.0605 ± 0.0099 ± 0.0019 −0.0182 ± 0.0099 ± 0.0019
3.1 < |η| < 3.8 0.56 1.01 0.0817 ± 0.0182 ± 0.0052 −0.0009 ± 0.0181 ± 0.0052
TABLE VI: The AN at√s= 200 GeV as function of pT at forward/backward rapidities in two different pseudorapidity ranges, as shown in Fig. 8.
h|xF|i hpTi (GeV/c) AN± σstat± σsyst(xF >0) AN± σstat± σsyst(xF <0)
3.1 < |η| < 3.5 0.28 2.1 0.0114 ± 0.0023 ± 0.0010 -0.0016 ± 0.0023 ± 0.0010 3.1 < |η| < 3.5 0.32 2.4 0.0219 ± 0.0020 ± 0.0009 0.0022 ± 0.0020 ± 0.0009 3.1 < |η| < 3.5 0.37 2.7 0.0307 ± 0.0022 ± 0.0010 0.0016 ± 0.0023 ± 0.0010 3.1 < |η| < 3.5 0.43 3.1 0.0425 ± 0.0031 ± 0.0014 0.0010 ± 0.0030 ± 0.0014 3.1 < |η| < 3.5 0.50 3.6 0.0588 ± 0.0067 ± 0.0030 -0.0016 ± 0.0065 ± 0.0029 3.1 < |η| < 3.5 0.60 4.3 0.0839 ± 0.0302 ± 0.0136 0.0480 ± 0.0261 ± 0.0117 3.5 < |η| < 3.8 0.28 1.5 0.0045 ± 0.0037 ± 0.0017 0.0015 ± 0.0038 ± 0.0017 3.5 < |η| < 3.8 0.33 1.8 0.0142 ± 0.0029 ± 0.0013 0.0042 ± 0.0029 ± 0.0013 3.5 < |η| < 3.8 0.37 2.0 0.0207 ± 0.0029 ± 0.0013 -0.0010 ± 0.0028 ± 0.0013 3.5 < |η| < 3.8 0.43 2.3 0.0412 ± 0.0034 ± 0.0015 0.0026 ± 0.0033 ± 0.0015 3.5 < |η| < 3.8 0.50 2.7 0.0531 ± 0.0066 ± 0.0030 -0.0015 ± 0.0064 ± 0.0029 3.5 < |η| < 3.8 0.60 3.2 0.0762 ± 0.0259 ± 0.0117 -0.0149 ± 0.0239 ± 0.0108
TABLE VII: The AN at√s= 200 GeV in forward/backward rapidities (|xF| > 0.4), as shown in Fig. 9.
h|xF|i pT (GeV/c) AN± σstat± σsyst(xF >0) AN± σstat± σsyst(xF <0)
3.1 < |η| < 3.8 0.41 1.9 0.0154 ± 0.0155 ± 0.0070 0.0295 ± 0.0148 ± 0.0067 3.1 < |η| < 3.8 0.43 2.3 0.0394 ± 0.0037 ± 0.0017 0.0040 ± 0.0036 ± 0.0016 3.1 < |η| < 3.8 0.44 2.7 0.0458 ± 0.0034 ± 0.0015 -0.0003 ± 0.0033 ± 0.0015 3.1 < |η| < 3.8 0.46 3.2 0.0542 ± 0.0045 ± 0.0020 -0.0017 ± 0.0044 ± 0.0020 3.1 < |η| < 3.8 0.47 3.7 0.0487 ± 0.0071 ± 0.0032 -0.0006 ± 0.0070 ± 0.0031 3.1 < |η| < 3.8 0.49 4.3 0.0524 ± 0.0112 ± 0.0050 0.0004 ± 0.0109 ± 0.0049 3.1 < |η| < 3.8 0.62 5.6 0.0192 ± 0.0261 ± 0.0117 0.0272 ± 0.0254 ± 0.0114
TABLE VIII: The AN as function of pT and xF at forward/backward rapidities, as shown in Fig. 10.
h|xF|i hpTi (GeV/c) AN± σstat± σsyst(xF >0) AN± σstat± σsyst(xF <0)
0.27 1.3 -0.0085 ± 0.0088 ± 0.0039 0.0176 ± 0.0088 ± 0.0040 0.28 1.7 0.0061 ± 0.0029 ± 0.0013 -0.0011 ± 0.0030 ± 0.0013 0.28 2.1 0.0128 ± 0.0032 ± 0.0014 -0.0029 ± 0.0032 ± 0.0014 0.28 2.6 0.0219 ± 0.0058 ± 0.0026 -0.0064 ± 0.0057 ± 0.0026 0.32 1.6 0.0101 ± 0.0053 ± 0.0024 0.0037 ± 0.0053 ± 0.0024 0.32 2.0 0.0161 ± 0.0024 ± 0.0011 0.0052 ± 0.0025 ± 0.0011 0.33 2.4 0.0219 ± 0.0028 ± 0.0013 0.0026 ± 0.0029 ± 0.0013 0.33 3.0 0.0326 ± 0.0045 ± 0.0020 -0.0042 ± 0.0045 ± 0.0020 0.37 1.8 0.0214 ± 0.0060 ± 0.0027 0.0032 ± 0.0058 ± 0.0026 0.37 2.2 0.0207 ± 0.0027 ± 0.0012 -0.0024 ± 0.0027 ± 0.0012 0.37 2.7 0.0330 ± 0.0029 ± 0.0013 0.0018 ± 0.0030 ± 0.0013 0.38 3.2 0.0333 ± 0.0054 ± 0.0024 0.0096 ± 0.0054 ± 0.0024 0.38 3.9 0.0424 ± 0.0137 ± 0.0062 -0.0041 ± 0.0135 ± 0.0061 0.42 2.1 0.0333 ± 0.0063 ± 0.0029 0.0020 ± 0.0061 ± 0.0027 0.43 2.4 0.0368 ± 0.0036 ± 0.0016 0.0003 ± 0.0035 ± 0.0016 0.43 3.0 0.0499 ± 0.0041 ± 0.0018 0.0038 ± 0.0040 ± 0.0018 0.43 3.5 0.0458 ± 0.0073 ± 0.0033 0.0012 ± 0.0071 ± 0.0032 0.44 4.1 0.0459 ± 0.0125 ± 0.0056 -0.0057 ± 0.0122 ± 0.0055 0.48 2.2 0.0463 ± 0.0350 ± 0.0158 0.0723 ± 0.0338 ± 0.0152 0.50 2.6 0.0551 ± 0.0075 ± 0.0034 -0.0058 ± 0.0073 ± 0.0033 0.50 3.1 0.0589 ± 0.0084 ± 0.0038 -0.0043 ± 0.0082 ± 0.0037 0.50 3.7 0.0660 ± 0.0113 ± 0.0051 0.0080 ± 0.0109 ± 0.0049 0.51 4.4 0.0339 ± 0.0186 ± 0.0084 -0.0023 ± 0.0176 ± 0.0079 0.58 3.0 0.0724 ± 0.0270 ± 0.0122 -0.0288 ± 0.0261 ± 0.0117 0.60 3.7 0.0772 ± 0.0221 ± 0.0100 -0.0044 ± 0.0212 ± 0.0095 0.61 4.7 0.0632 ± 0.0389 ± 0.0175 0.0453 ± 0.0375 ± 0.0169
TABLE IX: The ANof π0mesons at√s= 200 GeV at midrapidity as function of pT, as shown in Fig. 11. The data in slightly forward and backward kinematics (0.2 < |η| < 0.35) are subsets of the full data set (|η| < 0.35).
hpTi (GeV/c) AN± σstat± σsyst AN± σstat± σsyst AN± σstat± σsyst
(|η| < 0.35) (0.2 < |η| < 0.35, xF >0) (0.2 < |η| < 0.35, xF <0) 1.5 0.0008 ± 0.0006 ± 0.0002 0.0012 ± 0.0014 ± 0.0003 0.0020 ± 0.0014 ± 0.0003 2.4 0.0006 ± 0.0006 ± 0.0002 0.0021 ± 0.0013 ± 0.0003 0.0012 ± 0.0013 ± 0.0003 3.4 0.0002 ± 0.0011 ± 0.0003 0.0025 ± 0.0025 ± 0.0005 -0.0009 ± 0.0025 ± 0.0005 4.4 0.0013 ± 0.0022 ± 0.0006 0.0030 ± 0.0053 ± 0.0011 -0.0016 ± 0.0053 ± 0.0011 5.4 0.0004 ± 0.0045 ± 0.0009 0.0139 ± 0.0106 ± 0.0021 -0.0072 ± 0.0106 ± 0.0021 6.4 -0.0071 ± 0.0082 ± 0.0016 -0.0368 ± 0.0197 ± 0.0039 -0.0086 ± 0.0198 ± 0.0040 7.4 -0.0062 ± 0.0136 ± 0.0027 -0.0699 ± 0.0337 ± 0.0067 0.0587 ± 0.0337 ± 0.0067 8.4 0.0036 ± 0.0210 ± 0.0052 0.0116 ± 0.0801 ± 0.0160 -0.0026 ± 0.0935 ± 0.0187 9.4 0.0059 ± 0.0318 ± 0.0064 - -10.8 0.0331 ± 0.0387 ± 0.0077 -
-TABLE X: The AN of η mesons at√s= 200 GeV at midrapidity as function of pT, as shown in Fig. 11. The data in slightly forward and backward kinematics (0.2 < |η| < 0.35) are subsets of the full data set (|η| < 0.35).
hpTi (GeV/c) AN± σstat± σsyst AN± σstat± σsyst AN± σstat± σsyst
(|η| < 0.35) (0.2 < |η| < 0.35, xF>0) (0.2 < |η| < 0.35, xF <0) 2.4 -0.0069 ± 0.0049 ± 0.0010 -0.0169 ± 0.0125 ± 0.0025 0.0070 ± 0.0126 ± 0.0025 3.4 -0.0024 ± 0.0057 ± 0.0012 -0.0355 ± 0.0154 ± 0.0031 0.0040 ± 0.0155 ± 0.0031 4.4 -0.0019 ± 0.0099 ± 0.0020 -0.0073 ± 0.0265 ± 0.0053 -0.0336 ± 0.0265 ± 0.0053 5.4 0.0292 ± 0.0171 ± 0.0034 0.0178 ± 0.0452 ± 0.0090 -0.0327 ± 0.0453 ± 0.0091 6.4 -0.0458 ± 0.0285 ± 0.0057 0.0021 ± 0.0987 ± 0.0197 0.0896 ± 0.1131 ± 0.0226 7.4 0.0035 ± 0.0431 ± 0.0086 - -9.1 0.0842 ± 0.0550 ± 0.0110 -
-[1] H.-L. Lai, M. Guzzi, J. Huston, Z. Li, P. M. Nadolsky, et al., Phys. Rev. D 82, 074024 (2010).
[2] J. C. Ralston and D. E. Soper, Nucl. Phys. B 152, 109 (1979).
[3] D. de Florian, R. Sassot, M. Stratmann, and W. Vogel-sang, Phys. Rev. D 80, 034030 (2009).
[4] G. L. Kane, J. Pumplin, and W. Repko, Phys. Rev. Lett. 41, 1689 (1978).
[5] R. D. Klem, J. E. Bowers, H. W. Courant, H. Kagan, M. L. Marshak, et al., Phys. Rev. Lett. 36, 929 (1976). [6] J. Antille, L. Dick, L. Madansky, D. Perret-Gallix,
M. Werlen, A. Donidec, K. Kuroda, and P. Kyberd, Phys. Lett. B 94, 523 (1980).
[7] D. L. Adams et al. (FNAL-E581 and E704 Collabora-tions), Phys. Lett. B 261, 201 (1991).
[8] D. L. Adams et al. (FNAL-E704 Collaboration), Phys. Lett. B 264, 462 (1991).
[9] C. E. Allgower et al. (E925 Collaboration), Phys. Rev. D 65, 092008 (2002).
[10] I. Arsene et al. (BRAHMS Collaboration), Phys. Rev. Lett. 101, 042001 (2008).
[11] B. I. Abelev et al. (STAR Collaboration), Phys. Rev. Lett. 101, 222001 (2008).
[12] L. Adamczyk et al. (STAR Collaboration), Phys. Rev. D 86, 032006 (2012).
[13] L. Adamczyk et al. (STAR Collaboration), Phys. Rev. D 86, 051101 (2012).
[14] D. W. Sivers, Phys. Rev. D 41, 83 (1990). [15] C. Adolph et al., Phys. Lett. B 717, 383 (2012). [16] A. Airapetian et al. (HERMES Collaboration), Phys.
Rev. Lett. 103, 152002 (2009).
[17] S. S. Adler et al. (PHENIX Collaboration), Phys. Rev. Lett. 95, 202001 (2005).
[18] M. Anselmino, U. D’Alesio, S. Melis, and F. Murgia, Phys. Rev. D 74, 094011 (2006).
[19] J. C. Collins, Phys. Lett. B 356, 43 (2002).
[20] Z.-B. Kang, J.-W. Qiu, W. Vogelsang, and F. Yuan, Phys. Rev. D 83, 094001 (2011).
[21] J. C. Collins, Nucl. Phys. B 396, 161 (1993).
[22] K. Abe et al. (Belle Collaboration), Phys. Rev. Lett. 96, 232002 (2006).
[23] R. Seidl et al. (Belle Collaboration), Phys. Rev. D 78, 032011 (2008).
[24] A. Airapetian et al. (HERMES Collaboration), Phys. Lett. B 693, 11 (2010).
[25] C. Adolph et al., Phys. Lett. B 717, 376 (2012). [26] M. Anselmino, M. Boglione, U. D’Alesio, A. Kotzinian,
F. Murgia, et al., Phys. Rev. D 75, 054032 (2007). [27] S. Aoki, M. Doui, T. Hatsuda, and Y. Kuramashi, Phys.
Rev. D 56, 433 (1997).
[28] M. Wakamatsu, Phys. Rev. D 79, 014033 (2009). [29] A. V. Efremov and O. V. Teryaev, Phys. Lett. B 150,
383 (1985).
[30] J.-W. Qiu and G. F. Sterman, Phys. Rev. Lett. 67, 2264 (1991).
[31] X. Ji, J.-W. Qiu, W. Vogelsang, and F. Yuan, Phys. Rev. Lett. 97, 082002 (2006).
[32] L. Aphecetche et al. (PHENIX Collaboration), Nucl. In-strum. Methods A 499, 521 (2003).
[33] K. Adcox et al. (PHENIX Collaboration), Nucl. Instrum. Methods A 499, 489 (2003).
[34] M. Allen et al. (PHENIX Collaboration), Nucl. Instrum. Methods A 499, 549 (2003).
[35] R. Brun et al., CERN-DD/EE pp. 84–1 (1987).
[36] I. Alekseev et al., Nucl. Instrum. Methods A 499, 392 (2003).
[37] I. G. Alekseev et al., Phys. Rev. D 79, 094014 (2009). [38] I. Nakagawa et al., AIP Conf. Proc. 980, 380 (2008). [39] A. Adare et al. (PHENIX Collaboration), Phys. Rev. D
82, 112008 (2010).
[40] T. Sjostrand, S. Mrenna, and P. Skands, j. High Energy Phys. 05 (2006) 026.
[41] P. Z. Skands, Phys. Rev. D 82, 074018 (2010).
[42] J. Adams et al. (STAR Collaboration), Phys. Rev. Lett 97, 152302 (2006).
[43] I. Arsene et al. (BRAHMS Collaboration), Phys. Rev. Lett. 98, 252001 (2007).
[44] S. S. Adler et al. (PHENIX Collaboration), Phys. Rev. Lett. 98, 012002 (2007).
[45] A. Adare et al. (PHENIX Collaboration), Phys. Rev. D 76, 051106 (2007).
[46] D. L. Adams et al. (FNAL-E704 Collaboration), Phys. Lett. B 276, 531 (1992).
[47] M. Anselmino, M. Boglione, U. D. Alesio, A. Kotzinian, S. Melis, F. Murgia, A. Prokudin, and C. Turk, Eur. Phys. J. A 39, 89 (2009).
[48] L. Gamberg, Z.-B. Kang, and A. Prokudin, Phys. Rev. Lett. 110, 232301 (2013).

![Figure 5 compares the x F -dependence of neutral pion A N of this publication with the world data set [10, 11]](https://thumb-eu.123doks.com/thumbv2/123doknet/14070935.462387/7.918.480.841.503.774/figure-compares-dependence-neutral-pion-publication-world-data.webp)