Analysis of the erosive effect of different dietary substances and medications
Adrian Lussi*, Brigitte Megert, Robert Peter Shellis and Xiaojie Wang
Department of Preventive, Restorative and Pediatric Dentistry, School of Dental Medicine, University of Bern, Freiburgstrasse 7, CH-3010 Bern, Switzerland
(Received 15 October 2010 – Revised 15 April 2011 – Accepted 15 April 2011 – First published online 30 June 2011)
Abstract
Excessive consumption of acidic drinks and foods contributes to tooth erosion. The aims of the present in vitro study were twofold: (1) to assess the erosive potential of different dietary substances and medications; (2) to determine the chemical properties with an impact on the erosive potential. We selected sixty agents: soft drinks, an energy drink, sports drinks, alcoholic drinks, juice, fruit, mineral water, yogurt, tea, coffee, salad dressing and medications. The erosive potential of the tested agents was quantified as the changes in surface hardness
(DSH) of enamel specimens within the first 2 min (DSH2 – 0¼ SH2 min2SHbaseline) and the second 2 min exposure (DSH4 – 2¼ SH4 min2
SH2min). To characterise these agents, various chemical properties, e.g. pH, concentrations of Ca, Pi and F, titratable acidity to pH 7·0
and buffering capacity at the original pH value (b), as well as degree of saturation (pK 2 pI) with respect to hydroxyapatite (HAP) and fluorapatite (FAP), were determined. Erosive challenge caused a statistically significant reduction in SH for all agents except for coffee, some medications and alcoholic drinks, and non-flavoured mineral waters, teas and yogurts (P, 0·01). By multiple linear regression analysis, 52 % of the variation in DSH after 2 min and 61 % after 4 min immersion were explained by pH, b and concentrations of F and Ca (P, 0·05). pH was the variable with the highest impact in multiple regression and bivariate correlation analyses. Furthermore, a
high bivariate correlation was also obtained between (pK 2 pI)HAP, (pK 2 pI)FAPand DSH.
Key words:Tooth erosion: Erosive potential: Dietary substances: Medications: Chemical properties: Hardness
There is increasing evidence, from in vitro and in situ studies, that the excessive consumption of acidic drinks and foods
poses a risk to dental hard tissues(1 – 8). Tooth surface is
softened in the early stage, and subsequently bulk material is dissolved, layer by layer, from the tooth surface. This type of tooth wear is defined as tooth erosion and is caused by acids (extrinsic and intrinsic) or chelating agents not involving bacterial action. There is a trend towards the increased con-sumption of acidic drinks and foods. In 2007, the worldwide annual consumption of soft drinks reached 552 billion litres, the equivalent of just under 83 litres/person per year, and this is projected to increase to 95 litres/person per year by 2012. However, the figure had already reached an average
of 212 litres/person per year in the USA in 2009(9). To decrease
extrinsic erosive tooth wear, the emphasis should be on pre-ventive strategies that mainly aim at reducing the exposure of teeth to potentially erosive agents.
As a prerequisite, it is essential for medical personnel and patients to have a thorough knowledge of the erosive potential of popular dietary substances. In the past several decades, studies investigating the erosive potential of different dietary substances and medications have been performed in
different countries(3 – 8,10). A wide range of drinks, foods and
medications, such as soft drinks, sports drinks, juices, salad dressings, candies, herbal teas, alcoholic drinks, vinegar, vitamin C tablets etc., were recognised to be associated with the increase in erosion. Normally, soft drinks are mainly com-posed of filtered water, artificial additives and refined sugar. Thus, they offer limited nutritional benefit, but energy. Sports drinks, which are designed to replenish fluids lost during activity, typically contain water, electrolytes and sugar. Energy drinks are basically soft drinks that contain some forms of vitamins and other chemicals that boost energy for a very short span.
Various chemical properties of a potentially erosive agent, such as pH value, titratable acidity, buffering capacity, the
concentrations of Ca, Piand F, have been identified in the
lit-erature to be potentially important in determining the erosive
potential(4,5,7,11,12). However, to the best of our knowledge, no
thorough analyses of the effects of a wide range of erosive agents have been undertaken. Buffering capacity is associated with the undissociated acid in a solution, and maintains the
Hþ concentration and driving force for demineralisation at
the site of dissolution(13,14). The greater the buffering capacity
* Corresponding author: Professor A. Lussi, fax þ 41 31 632 98 75, email adrian.lussi@zmk.unibe.ch
Abbreviations: FAP, fluorapatite; HAP, hydroxyapatite; pK 2 pI, degree of saturation; DSH, changes in surface hardness; SH, surface hardness.
British Journal of Nutrition (2012), 107, 252–262 doi:10.1017/S0007114511002820
qThe Authors 2011
British
Journal
of
Nutrition
https:/www.cambridge.org/core/terms. https://doi.org/10.1017/S0007114511002820of the solution, the longer it will take for saliva to neutralise the acid, and as a result the more tooth mineral may be dis-solved before a safe pH value is reached and the dissolution ceases. It is important to distinguish buffering capacity from
titratable acidity. The latter measures total available Hþover
a wide range of pH values, whereas the former is defined at a certain pH value.
The aims of the present in vitro study were twofold: (1) to evaluate the erosive potential of different drinks, foods and medications; (2) to determine those chemical properties that have an impact on the erosive potential.
Materials and methods
Preparation of enamel specimens
From a pool of extracted teeth, six hundred caries-free human premolars with no cracks on the buccal sites as viewed under a stereomicroscope were selected. After the crowns of all teeth were separated from the roots, the buccal sites were ground flat under water-cooling on a LaboPol-21 rotating polishing machine (Struers, Ballerup, Denmark) as follows: groups of five enamel slabs were embedded into one resin disk (Paladur, Bad Homburg, Germany) in two planar parallel molds. Once the hardening process was complete, the thinner mold (200 mm thick) was removed. The outer 200 mm of enamel were ground away with a silicon carbide paper disc of 18 mm grade. Thereafter, the exposed buccal sides of enamel slabs in the thicker mold (7 mm thick) were serially polished on the polishing machine under constant cooling with silicon carbide paper discs of 8 mm grade for 30 s and with 5 mm grade for 1 min. Then, after being taken out of the molds, the embedded resin disks, each containing five enamel slabs, were polished for 1 min with 3 mm diamond abrasive on DP-Mol polishing cloth (Struers). After each polishing step, the resin disks were rinsed and sonicated for 2 min in tap water. These preparation steps wore away 200 mm enamel sub-stance in the centre of the window. Then all the resin disks with embedded enamel slabs were stored in a saturated mineral
sol-ution (1·5 mM-CaCl2, 1·0 mM-KH2PO4, 50 mM-NaCl, pH 7·0)(15).
Tested dietary substances and medications
In the present study, sixty popular drinks, foods and medi-cations in Switzerland were included (Table 1). According to their constituents and applications, these agents were divided into twelve groups: soft drinks, an energy drink, sports drinks, alcoholic drinks, juice, fresh fruit, mineral water, yogurt, tea, coffee, salad dressing and medications. Immediately before the experiment started, the fruits were crushed, and the pulps and seeds were removed by centrifu-gation; medication tablets and powders were dissolved in tap water according to the suggestions of the manufacturers.
Chemical analysis of tested agents
The pH value and the amount of base needed to raise the pH to 7·0 (titratable acidity) were measured with a titrator (Toledo
DL 53, Mettler Toledo, Electrode DG 101-SC, Software: LabX pro, Schwerzenbach, Switzerland). To measure titratable acidity, 10 g of each drink or solution were titrated with
0·5M-NaOH in steps of 0·02 ml at a temperature of 308C. The
buffering capacity (b) was calculated by using the following equation: b ¼ 2 DC/DpH, where DC is the amount of base used and DpH is the change in pH caused by the addition of the base. In the present study, the buffering capacity at the original pH of the tested products was calculated.
All the tested agents were further analysed for Ca by standard atomic absorption using an atomic absorption spec-trometer with an air/acetylene flame. Lanthanum was added
to all the products and standards to suppress Piinterference.
Total Pi concentration was analysed by the ammonium
molybdate method of Chen et al.(16). F concentration was
determined using a F ion-specific electrode (Orion 960900, Boston, MA, USA). Before F measurement, all products and standard solutions were mixed with total ionic strength
adjust-ment buffer (TISAB). The concentrations of Ca and Pi are
expressed in mmol/l and those of F in mg/l.
The degree of saturation (pK 2 pI) with respect to hydro-xyapatite (HAP) and fluorapatite (FAP) was calculated from
the pH and the concentrations of Ca, Piand F using a
compu-ter program(17). This program assumes a solubility product for
HAP of 10258·5and for FAP 10259·6(18,19).
Before the experiment, carbonated drinks were degassed by stirring at room temperature to avoid the adherence of bubbles to the enamel surface, which will affect the chemical analyses and hardness measurements. The concentrations of
Ca, Piand F, the pH and the titratable acidity were measured
in duplicate, and for further calculations of buffering capacity and pK 2 pI, the mean was determined.
Surface hardness measurement
Surface hardness (SH) of the enamel specimens was deter-mined with a Vickers diamond under a pressure of 50 mN for
15 s (Fischerscope HM 2000 XYp; Helmut Fischer, Hu¨nenberg,
Switzerland). A total of six baseline indentations were made at intervals of 70 mm. Further indentations next to the previous indentations were made following the experimental procedure. Vickers hardness was calculated from the dimensions of the indentations. The load resolution was # 0·04 mN and the indentation depth was 600 nm for sound enamel and ,1000 nm for most softened specimens. The device allowed fully automatic measurements using a programmable x, y stage. The WIN-HCU software calculated and illustrated SH.
Study design
After polishing the exposed enamel surface of resin disks (five enamel slabs each) with a 3 mm diamond abrasive, six baseline indentations per specimen were made and measured. The mean SH for each resin disk, i.e. the average SH of five enamel samples, was then calculated. According to the SH distribution, two disks, with a total of ten enamel samples, were assigned to one of sixty groups. Thus, the average SH of each pair of disks was similar. Just before the experimental
Erosive effect of dietary substances and medications 253
British
Journal
of
Nutrition
https:/www.cambridge.org/core/terms. https://doi.org/10.1017/S0007114511002820
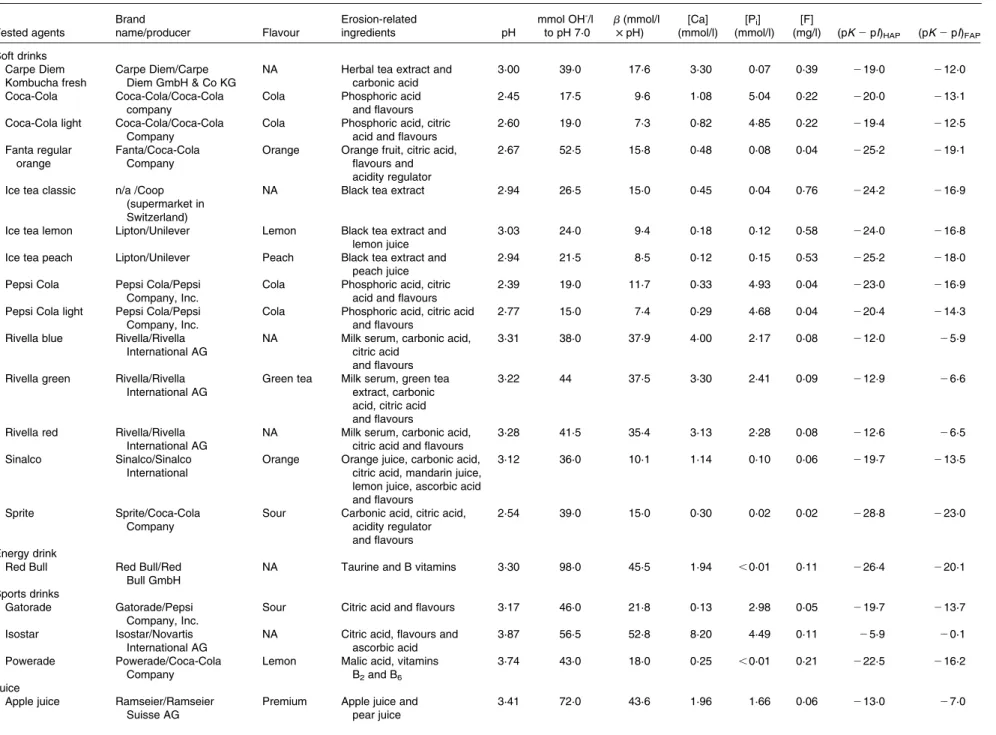
Table 1. Basic information and various chemical parameters of the tested agents, e.g. pH value, titratable acidity to pH 7·0, buffering capacity at the pH value, Ca, Pi, and F concentrations, degree of
saturation with respect to hydroxyapatite and fluorapatite*
Tested agents Brand name/producer Flavour Erosion-related ingredients pH mmol OH-/l to pH 7·0 b(mmol/l £ pH) [Ca] (mmol/l) [Pi] (mmol/l) [F]
(mg/l) (pK 2 pI)HAP (pK 2 pI)FAP
Soft drinks Carpe Diem Kombucha fresh
Carpe Diem/Carpe Diem GmbH & Co KG
NA Herbal tea extract and
carbonic acid
3·00 39·0 17·6 3·30 0·07 0·39 219·0 212·0
Coca-Cola Coca-Cola/Coca-Cola
company
Cola Phosphoric acid
and flavours
2·45 17·5 9·6 1·08 5·04 0·22 220·0 213·1
Coca-Cola light Coca-Cola/Coca-Cola Company
Cola Phosphoric acid, citric acid and flavours
2·60 19·0 7·3 0·82 4·85 0·22 219·4 212·5
Fanta regular orange
Fanta/Coca-Cola Company
Orange Orange fruit, citric acid, flavours and acidity regulator
2·67 52·5 15·8 0·48 0·08 0·04 225·2 219·1
Ice tea classic n/a /Coop (supermarket in Switzerland)
NA Black tea extract 2·94 26·5 15·0 0·45 0·04 0·76 224·2 216·9
Ice tea lemon Lipton/Unilever Lemon Black tea extract and
lemon juice
3·03 24·0 9·4 0·18 0·12 0·58 224·0 216·8
Ice tea peach Lipton/Unilever Peach Black tea extract and
peach juice
2·94 21·5 8·5 0·12 0·15 0·53 225·2 218·0
Pepsi Cola Pepsi Cola/Pepsi Company, Inc.
Cola Phosphoric acid, citric acid and flavours
2·39 19·0 11·7 0·33 4·93 0·04 223·0 216·9
Pepsi Cola light Pepsi Cola/Pepsi Company, Inc.
Cola Phosphoric acid, citric acid and flavours
2·77 15·0 7·4 0·29 4·68 0·04 220·4 214·3
Rivella blue Rivella/Rivella International AG
NA Milk serum, carbonic acid, citric acid
and flavours
3·31 38·0 37·9 4·00 2·17 0·08 212·0 25·9
Rivella green Rivella/Rivella International AG
Green tea Milk serum, green tea extract, carbonic acid, citric acid and flavours
3·22 44 37·5 3·30 2·41 0·09 212·9 26·6
Rivella red Rivella/Rivella International AG
NA Milk serum, carbonic acid, citric acid and flavours
3·28 41·5 35·4 3·13 2·28 0·08 212·6 26·5
Sinalco Sinalco/Sinalco
International
Orange Orange juice, carbonic acid, citric acid, mandarin juice, lemon juice, ascorbic acid and flavours
3·12 36·0 10·1 1·14 0·10 0·06 219·7 213·5
Sprite Sprite/Coca-Cola
Company
Sour Carbonic acid, citric acid, acidity regulator and flavours
2·54 39·0 15·0 0·30 0·02 0·02 228·8 223·0
Energy drink
Red Bull Red Bull/Red
Bull GmbH
NA Taurine and B vitamins 3·30 98·0 45·5 1·94 ,0·01 0·11 226·4 220·1
Sports drinks
Gatorade Gatorade/Pepsi
Company, Inc.
Sour Citric acid and flavours 3·17 46·0 21·8 0·13 2·98 0·05 219·7 213·7
Isostar Isostar/Novartis
International AG
NA Citric acid, flavours and ascorbic acid
3·87 56·5 52·8 8·20 4·49 0·11 25·9 20·1
Powerade Powerade/Coca-Cola
Company
Lemon Malic acid, vitamins B2and B6
3·74 43·0 18·0 0·25 ,0·01 0·21 222·5 216·2
Juice
Apple juice Ramseier/Ramseier Suisse AG
Premium Apple juice and pear juice 3·41 72·0 43·6 1·96 1·66 0·06 213·0 27·0 A. Lussi et al. 254
British Journal of Nutrition
https:/www.cambridge.org/core/terms
.
https://doi.org/10.1017/S0007114511002820
Downloaded from
https:/www.cambridge.org/core
. University of Basel Library
, on
30 May 2017 at 20:21:08
Table 1. Continued Tested agents Brand name/producer Flavour Erosion-related ingredients pH mmol OH-/l to pH 7·0 b(mmol/l £ pH) [Ca] (mmol/l) [Pi] (mmol/l) [F]
(mg/l) (pK 2 pI)HAP (pK 2 pI)FAP
Carrot juice Biotta/Biotta AG Carrot Carrot juice, orange juice,
agave juice, lemon juice and ascorbic acid
4·16 70·5 55·7 4·40 1·20 0·04 26·6 21·4
Grapefruit juice n/a /Coop Grape fruit Grapefruit juice 3·15 168·5 71·4 2·30 2·17 0·03 214·2 28·4
Orange juice, Del Monte
n/a /Migros (supermarket in Switzerland)
Orange Orange juice 3·74 108·0 66·7 2·38 2·36 0·03 29·8 24·5
Orange juice, Hohes C
Hohes C/Eckes AG Orange Orange juice 3·56 121·0 62·5 1·98 2·57 0·03 211·4 25·8
Fruit Apricot NA Apricot NA 3·25 317·0 125·0 1·20 5·95 0·02 213·6 28·0 Kiwi NA Kiwi NA 3·25 206·5 142·9 3·35 4·47 0·02 211·9 26·3 Orange NA Orange NA 3·60 113·0 47·6 2·18 1·27 0·03 211·8 26·3 Alcoholic drinks Bacardi Breezer orange Bacardi/Bacardi & Company Limited
Orange 4·4 % alcohol and orange juice
3·16 60·0 26·1 0·19 0·14 0·03 222·5 216·7
Cynar Cynar/Campari Gruppo NA 16·5 % alcohol 4·00 6·0 5·8 2·01 0·13 0·07 212·0 26·5
Beer, Carlsberg Carlsberg/ Carlsberg Group
NA 5·0 % alcohol 4·20 17·5 8·3 0·74 5·65 0·74 27·9 21·5
Beer, Eichhof Eichhof/Eichhof Getra¨nke AG
NA 4·9 % alcohol 4·07 18·0 8·1 1·94 9·30 0·06 26·3 20·9
Champagner Freixenet/Grupo Freixenet NA 12·0 % alcohol 2·99 78·0 35·8 1·90 1·98 0·26 215·9 29·0
Red wine, Collivo Collivo/Italia NA 13·0 % alcohol 3·43 76·0 54·4 1·25 4·69 0·07 212·5 26·4
Red wine, Montagne
Montagne/France NA 11·7 % alcohol 3·68 63·0 46·5 1·68 2·79 0·11 210·7 24·7
White wine La Coˆte/France NA 12·1 % alcohol 3·60 53·0 50·0 1·30 4·42 0·27 211·3 24·8
Smirnoff ice vodka Smirnoff/Diageo plc Lemon 40·0 % alcohol and lemon juice
3·07 50·0 18·2 0·18 6·54 0·12 218·8 212·4
Medications
Alca-C fizzy tablet Alca-C/Novartis Consumer Health Schweiz AG
Orange Acetylsalicylic acid and ascorbic acid
4·20 53·0 45·5 9·03 0·02 0·07 210·2 24·8
Alcacyl 500 Alcacyl 500/Novartis Consumer Health Schweiz AG
Sour Acetylsalicylic acid 6·93 0·5 3·7 1·89 ,0·01 0·07 0·4 3·1
Alka-Seltzer fizzy tablet
Alka-Seltzer/Bayer (Schweiz) AG
Sour Acetylsalicylic acid and citric acid
6·23 14·0 24·9 2·06 0·03 0·08 1·5 5·0
Aspirine-C fizzy tablet
Aspirine-C/Bayer (Schweiz) AG
Sour Acetylsalicylic acid and vitamin C 5·51 27·5 32·8 2·04 ,0·01 0·08 25·7 21·5 Berocca fizzy tablet Berocca/Bayer (Schweiz) AG Orange Vitamin C 4·24 59·5 57·2 15·20 0·03 0·12 28·9 23·3 Fluimucil 200 fizzy tablet
Zambon Orange Tartaric acid, citric
acid monohydrate and flavours 4·71 19·5 13·5 1·98 ,0·01 0·06 212·5 27·6 Neocitran Neocitran/Novartis Consumer Health Schweiz AG Sour Vitamin C 2·85 73·5 27·5 4·63 1·58 0·09 215·5 20·9 Erosive effect of dietary substances and medications 255
British Journal of Nutrition
https:/www.cambridge.org/core/terms
.
https://doi.org/10.1017/S0007114511002820
Downloaded from
https:/www.cambridge.org/core
. University of Basel Library
, on
30 May 2017 at 20:21:08
Table 1. Continued Tested agents Brand name/producer Flavour Erosion-related ingredients pH mmol OH-/l to pH 7·0 b(mmol/l £ pH) [Ca] (mmol/l) [Pi] (mmol/l) [F]
(mg/l) (pK 2 pI)HAP (pK 2 pI)FAP
Vitamin C fizzy tablet, Actilife
Actilife/Migros Orange Citric acid, vitamin C
and flavours
3·86 93·0 58·8 1·90 0·03 0·06 215·0 29·4
Vitamin C fizzy tablet, Streuli
Streuli/Streuli Pharma AG Sour Vitamin C 3·63 85·0 42·6 1·78 2·01 0·06 211·4 25·6
Siccoral Siccoral/Drossa
Pharma GmbH
NA NA 5·41 2·5 2·0 0·15 0·12 0·03 27·4 23·6
Yogurt
Kiwi Tropicana Hirz/Nestle´ Switzerland Kiwi Kiwi and exotic fruits
3·99 124·5 111·1 45·83 33·82 0·04 0 5·3
Nature n/a /Migros Milky NA 3·91 120·0 95·5 43·33 34·34 0·04 20·6 4·7
Slimline n/a /Migros Milky NA 4·03 133·5 100·0 56·33 38·74 0·03 0·8 5·9
Forest berries n/a /Migros Berries Forest berries 3·77 159·0 200·0 45·50 36·81 0·05 21·4 4·1
Mineral water
Henniez Henniez/Nestle´ Waters NA NA 7·68 N.A 2·0 2·48 ,0·01 0·10 2·4 4·5
Henniez sparkling Henniez/Nestle´ Waters NA NA 6·13 4·0 4·2 2·40 ,0·01 0·09 26·2 22·6
Valser Valser/Valser Mineralquellen AG NA NA 5·63 12·5 10·9 9·93 ,0·01 0·60 22·8 2·1 Valser Viva Lemon Valser/Valser Mineralquellen AG Lemon and herbs Lemon and herbs 3·31 40·0 21·1 9·75 0·08 0·63 214·7 27·6 Tea
Rose hip n/a /Migros Rose hip Rose hip 3·15 19·5 19·7 2·65 0·42 0·05 216·0 210·0
Pepper mint n/a /Migors Pepper mint Pepper mint 7·51 N.A 2·9 1·93 0·35 0·05 11·8 13·8
Black tea n/a /Coop Black tea Black tea 6·59 1·5 2·6 1·10 0·27 1·63 5·6 10·0
Wild berries Lipton/Unilever Berries Hibiscus bloom,
apple, strawberry, currant and blackberry
6·78 1·0 2·6 1·10 0·24 0·78 6·6 10·5
Coffee
Espresso Nestle´ /Nestle´ Switzerland Coffee NA 5·82 3·0 2·2 0·69 0·63 0·07 0·6 4·5 Salad dressing Thomy French Classic Thomy/Nestle´ Switzerland Creamy and sour Vinegar and lemon juice 4·04 141·0 111·1 20·50 0·46 0·11 26·1 20·5 Thomy French Light
Thomy/Nestle´ Switzerland Creamy and sour
Vinegar 3·85 145·0 100·0 40·00 1·14 0·11 25·3 0·5
pK 2 pI, degree of saturation; HAP, hydroxyapatite; FAP, fluorapatite; NA, not available.
* Titratable acidity, mmol OH-/l to pH 7·0; b, buffering capacity at the pH value; pK 2 pI with respect to HAP and pK 2 pI with respect to FAP.
A.
Lussi
et
al.
256
British Journal of Nutrition
https:/www.cambridge.org/core/terms
.
https://doi.org/10.1017/S0007114511002820
Downloaded from
https:/www.cambridge.org/core
. University of Basel Library
, on
30 May 2017 at 20:21:08
procedures, the resin disks were further polished with a 1 mm diamond abrasive for 1 min (LaboPol-6, DP-Mol Polishing, DP-Stick HQ; Struers, Copenhagen, Denmark), which assured the removal of the possible remnants from storage.
Before the erosive challenge, enamel specimens were immersed in 20 ml of freshly collected human saliva for 3 h to form a salivary pellicle. The saliva, stimulated by paraffin wax (Fluka; Sigma-Aldrich Chemie GmbH, Munich, Germany), was collected in an ice-cooled tube from a single healthy
donor at least 1 h after any intake of drink or food(20,21). She
gave informed consent, and saliva collection was performed in accordance with the protocol approved by the University of Bern (Bern, Switzerland). After being carefully rinsed with tap water for 50 s, with deionised water for 10 s and then dried for 5 s with oil-free air, the SH baseline of the samples was measured. Afterwards, the resin disks with five enamel specimens each were individually placed in 60 ml (or g) of the appropriate solution under constant agitation (95 rpm) at 308C (shaking bath Salvis; Renggli AG, Rotkreuz, Switzerland). After immersion for 2 and 4 min, the resin disks were taken out of the solution, and the SH measurement was performed once again.
Statistics
Wilcoxon’s signed rank tests were calculated in an attempt to compare the SH values before and after immersion. The relationship between the changes in SH (DSH) within the
first 2 min (DSH2 – 0¼ SH2 min2SHbaseline) and the second
2 min (DSH4 – 2¼ SH4 min2SH2 min) immersion (dependent
variables) and pH, buffering capacity, and Ca, Piand F
con-centrations (independent variables) was investigated using multiple linear regression (backward selection) analyses. Only variables independent from each other were included. The pK 2 pI and the titratable acidity were not eligible for inclusion. To assess the bivariate associations between differ-ent chemical properties and DSH after 2 or 4 min exposure, Spearman’s correlation coefficients were used. The statistical calculations were performed using SAS Enterprise Guide 4.1 software. The significance level was set at 0·01 in Wilcoxon’s signed rank tests and at 0·05 in multiple linear regression and Spearman’s correlation analyses.
Results
Changes in the surface hardness of enamel
In Table 2, Wilcoxon’s signed rank tests revealed a significant
reduction (P, 0·01) of DSH2 – 0for soft drinks, sports drinks,
the energy drink (Red Bull), juices (except for carrot juice), fruits and salad dressings. Except for Isostar (sports drink) and Thomy French Classic salad dressing, these substances
pre-sented a trend towards further decrease in DSH4 – 2. On the
con-trary, no statistically significant change was found for coffee,
most mineral waters, teas and yogurts in both DSH2 – 0 and
DSH4 – 2. Exceptions were rose hip tea, forest berries yogurt
and Valser Viva Lemon mineral water that had a similar erosive effect as soft drinks. A complicated erosive pattern was observed in the medication and alcoholic drink groups. For
example, Alca-C, Alcacyl 500 and Berocca fizzy tablets did not induce a significant decrease in SH, while the reduction was observable within the first 2 min for Aspirine-C fizzy tablet and within the second 2 min for Siccoral, Alka-Seltzer and Flui-mucil 200 fizzy tablets. In the alcoholic drink group, by the end of the experiment, Cynar, Carlsberg beer and Montagne red wine did not produce any significant changes in SH of enamel specimens, whereas Eichhof beer demonstrated erosive poten-tial within the second 2 min. It is worth noting that as no adjust-ment for multiple testing was done, the present results can only be taken into exploratory consideration.
Influence of different chemical properties on changes in surface hardness
Table 1 also gives an overview of the chemical properties of all tested agents.
Coffee, teas (except for rose hip tea), mineral waters (except for Valser Viva Lemon mineral water) and some medi-cations (Alcacyl 500, Alka-Seltzer and Aspirine-C fizzy tablets) had the highest pH values, above 5·5. The lowest pH values, varying between 2·4 and 3·3, were mostly found in the soft drinks and the energy drink (Red Bull).
The larger titratable acidity was found for fruits, salad dres-sings, yogurts as well as for grapefruit and orange juices (. 100 mmol/l). The buffering capacity ranged from 2·0 to 200 mmol/l £ pH. The highest values were observed for yogurts, fruits (except for orange) and salad dressings (. 95 mmol/l £ pH), the lowest values for Siccoral, Henniez mineral water, coffee and tea (except for rose hip tea) (, 3 mmol/l £ pH).
Yogurts contained the highest concentrations of Ca
(. 43 mmol/l) and Pi(. 33 mmol/l). Black tea contained the
highest concentration of F (1·63 mg/l), whereas F concen-tration in other agents normally varied between 0 and 1 mg/l. Many of the test agents under study were undersaturated with respect to both HAP and FAP. Exceptionally, Henniez mineral water, Alcacyl 500 and Alka-Seltzer fizzy tablets, Kiwi and Slimline yogurts, coffee and teas (except for rose hip tea) were supersaturated with respect to both minerals. Valser mineral water, natural and forest berries yogurts, Thomy French Light salad dressing were undersaturated with respect to HAP but supersaturated with respect to FAP.
Table 3 shows the chemical properties with a significant impact on DSH after a 2 and 4 min immersion in the multiple linear regression analysis. In this analysis, 52 % of the variation of DSH after 2 min immersion and 61 % of the variation after 4 min immersion could be explained by pH, buffering capacity, Ca and F concentrations (P, 0·05).
There were high bivariate correlations between DSH and the
pH, the (pK 2 pI)HAPand (pK 2 pI)FAP(Table 4). However, the
concentrations of Ca, Piand F, the titratable acidity and the
buf-fering capacity showed small bivariate correlations with DSH.
Discussion
In agreement with previous studies(4,5,22,23), the present study
indicated that soft drinks, energy drinks (Red Bull), sports
Erosive effect of dietary substances and medications 257
British
Journal
of
Nutrition
https:/www.cambridge.org/core/terms. https://doi.org/10.1017/S0007114511002820
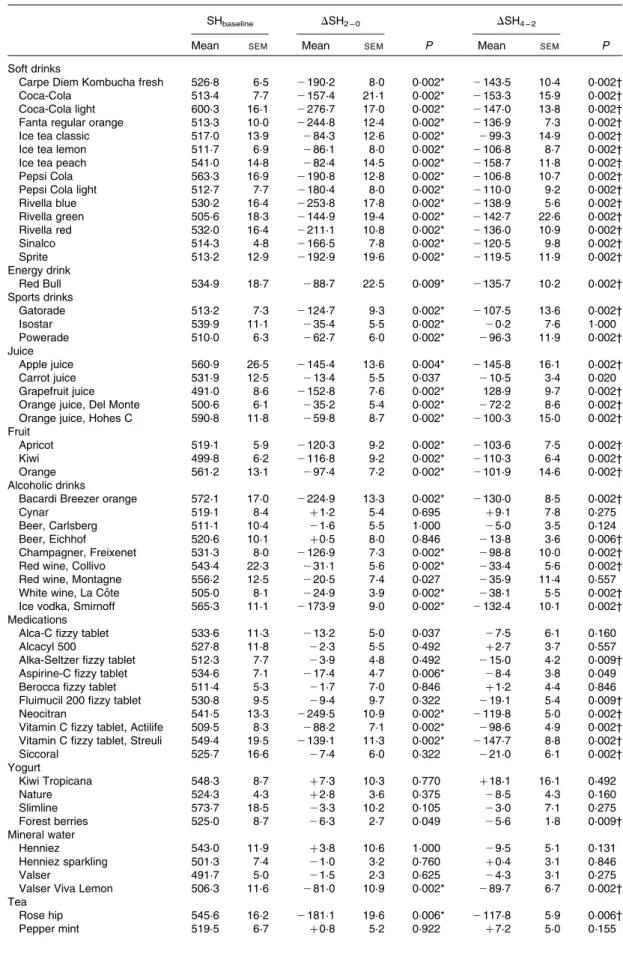
Table 2. Original surface hardness (SHbaseline) of specimens, and the changes within the first 2 min (DSH2 – 0¼ SH2 min2
SHbaseline) and the second 2 min (DSH4 – 2¼ SH4 min2SH2 min) incubation in different dietary agents and medications
(Mean values with their standard errors)
SHbaseline DSH2 – 0 DSH4 – 2
Mean SEM Mean SEM P Mean SEM P
Soft drinks
Carpe Diem Kombucha fresh 526·8 6·5 2190·2 8·0 0·002* 2143·5 10·4 0·002†
Coca-Cola 513·4 7·7 2157·4 21·1 0·002* 2153·3 15·9 0·002†
Coca-Cola light 600·3 16·1 2276·7 17·0 0·002* 2147·0 13·8 0·002†
Fanta regular orange 513·3 10·0 2244·8 12·4 0·002* 2136·9 7·3 0·002†
Ice tea classic 517·0 13·9 284·3 12·6 0·002* 299·3 14·9 0·002†
Ice tea lemon 511·7 6·9 286·1 8·0 0·002* 2106·8 8·7 0·002†
Ice tea peach 541·0 14·8 282·4 14·5 0·002* 2158·7 11·8 0·002†
Pepsi Cola 563·3 16·9 2190·8 12·8 0·002* 2106·8 10·7 0·002†
Pepsi Cola light 512·7 7·7 2180·4 8·0 0·002* 2110·0 9·2 0·002†
Rivella blue 530·2 16·4 2253·8 17·8 0·002* 2138·9 5·6 0·002† Rivella green 505·6 18·3 2144·9 19·4 0·002* 2142·7 22·6 0·002† Rivella red 532·0 16·4 2211·1 10·8 0·002* 2136·0 10·9 0·002† Sinalco 514·3 4·8 2166·5 7·8 0·002* 2120·5 9·8 0·002† Sprite 513·2 12·9 2192·9 19·6 0·002* 2119·5 11·9 0·002† Energy drink Red Bull 534·9 18·7 288·7 22·5 0·009* 2135·7 10·2 0·002† Sports drinks Gatorade 513·2 7·3 2124·7 9·3 0·002* 2107·5 13·6 0·002† Isostar 539·9 11·1 235·4 5·5 0·002* 20·2 7·6 1·000 Powerade 510·0 6·3 262·7 6·0 0·002* 296·3 11·9 0·002† Juice Apple juice 560·9 26·5 2145·4 13·6 0·004* 2145·8 16·1 0·002† Carrot juice 531·9 12·5 213·4 5·5 0·037 210·5 3·4 0·020 Grapefruit juice 491·0 8·6 2152·8 7·6 0·002* 128·9 9·7 0·002†
Orange juice, Del Monte 500·6 6·1 235·2 5·4 0·002* 272·2 8·6 0·002†
Orange juice, Hohes C 590·8 11·8 259·8 8·7 0·002* 2100·3 15·0 0·002†
Fruit
Apricot 519·1 5·9 2120·3 9·2 0·002* 2103·6 7·5 0·002†
Kiwi 499·8 6·2 2116·8 9·2 0·002* 2110·3 6·4 0·002†
Orange 561·2 13·1 297·4 7·2 0·002* 2101·9 14·6 0·002†
Alcoholic drinks
Bacardi Breezer orange 572·1 17·0 2224·9 13·3 0·002* 2130·0 8·5 0·002†
Cynar 519·1 8·4 þ 1·2 5·4 0·695 þ 9·1 7·8 0·275
Beer, Carlsberg 511·1 10·4 21·6 5·5 1·000 25·0 3·5 0·124
Beer, Eichhof 520·6 10·1 þ 0·5 8·0 0·846 213·8 3·6 0·006†
Champagner, Freixenet 531·3 8·0 2126·9 7·3 0·002* 298·8 10·0 0·002†
Red wine, Collivo 543·4 22·3 231·1 5·6 0·002* 233·4 5·6 0·002†
Red wine, Montagne 556·2 12·5 220·5 7·4 0·027 235·9 11·4 0·557
White wine, La Coˆte 505·0 8·1 224·9 3·9 0·002* 238·1 5·5 0·002†
Ice vodka, Smirnoff 565·3 11·1 2173·9 9·0 0·002* 2132·4 10·1 0·002†
Medications
Alca-C fizzy tablet 533·6 11·3 213·2 5·0 0·037 27·5 6·1 0·160
Alcacyl 500 527·8 11·8 22·3 5·5 0·492 þ 2·7 3·7 0·557
Alka-Seltzer fizzy tablet 512·3 7·7 23·9 4·8 0·492 215·0 4·2 0·009†
Aspirine-C fizzy tablet 534·6 7·1 217·4 4·7 0·006* 28·4 3·8 0·049
Berocca fizzy tablet 511·4 5·3 21·7 7·0 0·846 þ 1·2 4·4 0·846
Fluimucil 200 fizzy tablet 530·8 9·5 29·4 9·7 0·322 219·1 5·4 0·009†
Neocitran 541·5 13·3 2249·5 10·9 0·002* 2119·8 5·0 0·002†
Vitamin C fizzy tablet, Actilife 509·5 8·3 288·2 7·1 0·002* 298·6 4·9 0·002† Vitamin C fizzy tablet, Streuli 549·4 19·5 2139·1 11·3 0·002* 2147·7 8·8 0·002†
Siccoral 525·7 16·6 27·4 6·0 0·322 221·0 6·1 0·002† Yogurt Kiwi Tropicana 548·3 8·7 þ 7·3 10·3 0·770 þ 18·1 16·1 0·492 Nature 524·3 4·3 þ 2·8 3·6 0·375 28·5 4·3 0·160 Slimline 573·7 18·5 23·3 10·2 0·105 23·0 7·1 0·275 Forest berries 525·0 8·7 26·3 2·7 0·049 25·6 1·8 0·009† Mineral water Henniez 543·0 11·9 þ 3·8 10·6 1·000 29·5 5·1 0·131 Henniez sparkling 501·3 7·4 21·0 3·2 0·760 þ 0·4 3·1 0·846 Valser 491·7 5·0 21·5 2·3 0·625 24·3 3·1 0·275
Valser Viva Lemon 506·3 11·6 281·0 10·9 0·002* 289·7 6·7 0·002†
Tea Rose hip 545·6 16·2 2181·1 19·6 0·006* 2117·8 5·9 0·006† Pepper mint 519·5 6·7 þ 0·8 5·2 0·922 þ 7·2 5·0 0·155 A. Lussi et al. 258
British
Journal
of
Nutrition
https:/www.cambridge.org/core/terms. https://doi.org/10.1017/S0007114511002820drinks, juices, fruits, and some medications and alcoholic drinks caused statistically significant decrease in SH of enamel samples. Yogurts, teas, mineral waters and coffee, except for those that were flavoured with acidic additives, did not have a detrimental effect on enamel SH.
The results highlight the role of acidic additives in increas-ing erosive capacity of potentially erosive agents. The fruit-based or other acidic flavourings added to ‘plain’ or ‘flat’ drinks and foods, which are intended to stimulate taste, con-tribute to lower acidity and, consequently, induce erosion. Yogurt is a good example for demonstrating the effect of acidic additives. Natural yogurt caused no erosion in spite of its low pH value (3·91). This can be attributed to its high
(pK 2 pI)HAP resulting from high concentrations of Ca and
Pi. The addition of berries (forest berries yogurt) caused a
clinically not relevant reduction in SH within the second 2 min exposure. Even though this brand had higher Ca and
Piconcentrations than natural yogurt, its pH of 3·77 was too
low for it to be supersaturated with respect to HAP. These
findings are in accordance with other studies(24,25). Similarly,
compared with plain mineral water or tea, flavoured products, such as Valser Viva Lemon mineral water and rose hip tea, had
much lower pH and negative (pK 2 pI)HAP, and hence caused
a statistically significant reduction in SH. Moreover, it has been suggested that fruit-based acids might enhance the buffering
capacity(12), which perhaps explains the higher buffering
capacity and titratable acidity for the flavoured liquids (Table 1). Therefore, the above-mentioned flavoured products, from the chemical composition point of view, should be classified as soft drinks. Their erosive potential would be expected to be much closer to erosive drinks than to plain
products(6,26).
The pK 2 pI with respect to tooth mineral, determined by
the pH value and the concentrations of Ca, Pi and F in a
solution, is the driving force for mineral dissolution. When
(pK 2 pI)HAP,0, the solution is undersaturated with respect
to HAP, which chemically and structurally resembles natural
tooth(27). In acidic media, the value of the ion activity product
for HAP was a good predictor of enamel lesion(28,29).
There-fore, this solution may induce demineralisation of the
enamel. When (pK 2 pI)HAP.0, the solution is
supersatu-rated, so favours remineralisation(30). Previous studies have
observed that (pK 2 pI)HAPplays an important role in tooth
dissolution. A small change in (pK 2 pI)HAPmight result in a
marked difference in the dissolution rate of enamel(13,31,32).
As (pK 2 pI)HAPis dependent on pH and Ca and Pi
concen-trations, it was not included in the multiple regression anal-ysis. However, there was a negative and strong bivariate
correlation between both (pK 2 pI)HAP and (pK 2 pI)FAP
and DSH after both 2 and 4 min. In general, bivariate analyses may be misleading because possible interactions between variables are neglected. Interestingly, the concentrations of
Ca, Pi and F alone had a weak correlation with DSH[0],
whereas the pK 2 pI defined by the combination of these variables (and the pH) showed a strong correlation.
Many studies have demonstrated that pH is a good predictor of dental erosion: as the pH of the investigated product decreases, there is an increased amount of erosion,
indepen-dent of the way in which erosion is measured(22,33). The
buffer properties (buffering capacity or titratable acidity)
have also been considered to be important(5), even more
than pH(34,35), in predicting the erosive potential because it
maintains the Hþ concentration available for the interaction
with the tooth surface(1). The effect of buffering might,
how-ever, vary with pH. Because erosive demineralisation takes place at least partly beneath the enamel surface, buffering capacity may become increasingly important as pH falls, since this is accompanied by an increase in dissolution rate. Consequently, while diffusion may be capable of supplying
sufficient Hþions at higher pH (slow dissolution), increased
buffering will be required at lower pH in order to maintain
the supply of Hþ ions(36). However, the relative importance
of pH and buffering properties could depend on factors such as exposure time and the ratio of the volume of solution to the area of exposed tooth surface. In an in vitro study using
a low ratio of solution to specimen area, Jensdottir et al.(23)
reported a significant correlation between buffer properties, titratable acidity, buffering capacity and tooth tissue dissol-ution after exposure to selected soft drinks for a long time (24 h), while after a short-term exposure (3 min), erosion
was associated with pH but not with titratable acidity(37).
They speculated, therefore, that titratable acidity was the better predictor of erosive potential during longer erosive challenges and pH was better for short challenges. However,
Hara & Zero(7) observed that after 2 h exposure, titratable
acidity showed a low-to-moderate correlation with enamel demineralisation, while pH value was the best predictor for erosion. They ascribed this result to the relatively high
Table 2. Continued
SHbaseline DSH2 – 0 DSH4 – 2
Mean SEM Mean SEM P Mean SEM P
Black tea 507·4 8·5 21·2 5·7 1·000 þ 2·4 2·8 0·625
Wild berries 603·7 9·5 þ 2·1 7·4 0·846 þ 5·3 5·3 0·322
Coffee
Espresso 516·5 7·1 þ 3·7 5·0 0·492 þ 0·5 5·8 0·846
Salad dressing
Thomy French Classic 548·6 9·5 221·2 5·8 0·002* 24·0 6·7 0·492
Thomy French Light 509·1 14·1 232·6 4·0 0·002* 261·4 8·5 0·002†
* Mean values were significantly different in SH within the first 2 min of erosive challenge. † Mean values were significantly different in SH within the second 2 min of erosive challenge.
Erosive effect of dietary substances and medications 259
British
Journal
of
Nutrition
https:/www.cambridge.org/core/terms. https://doi.org/10.1017/S0007114511002820
volume (30 ml) used in their study. Buffering properties are likely to be relatively more important when a low volume of solution is used, as the pH would be raised more easily by
mineral dissolution(7). The dependence of tooth erosion on
both pH value and buffering capacity observed in the present study, and the lack of a significant effect of titratable acidity could thus be due to our use of short erosive challenges and an adequate, well-stirred volume of the test product.
The literature is contradictory with regard to the erosive
potential of acidic drinks and foods containing F(4,5,22).
Pre-vious studies have shown that the erosive capacity of different drinks was significantly and negatively associated with their
original F concentration(4,5). This observation was confirmed
in the present study. In contrast, Larsen & Nyvad(22)reported
that F concentration in eighteen soft drinks had no effect on the depth of tooth erosion. Furthermore, a study by Larsen
& Richards(38)showed that in drinks with pH above 3, F
con-centrations reduced the in vitro development of erosion by 28 %; in drinks with pH below 3, erosion was not affected, despite total F concentrations of 20 parts per million and satur-ation with calcium fluoride. It is worth noting that in those studies, severe acid attacks with surface loss was chosen, while in the present study initial erosion (softening) caused by various agents was assessed.
A higher concentration of the Ca and/or Piin a solution will
increase the pK 2 pI with respect to dental mineral, so that the
presence of suitable concentrations of Ca and Pimay
counter-act tooth erosion caused by acidic drinks and foods. Some studies have proved that lower levels of enamel demineralisa-tion were found in Ca-containing drinks than in those without Ca(23,39 – 41). The relatively higher concentrations of Ca and Pi
are most probably responsible for the less erosive effect of Iso-star compared with other sports drinks. IsoIso-star does not con-tain other protective ingredients, such as casein. The results of multiple linear regression analyses indicated a significant relationship between Ca concentration and erosion. However,
there was no evidence of a relationship between Piand tooth
erosion. There are four species of inorganic Pi, namely H3PO4,
H2PO42, HPO422 and PO432, in a given solution and their
pro-portions depend on the pH(42). At the pH of erosive drinks
(approximately 2 – 4), only a minute fraction of the total Pi
(of the order of 10213) is in the form of PO
4
32 ions(42),
which are the only important Pispecies in the ion activity
pro-duct of HAP and FAP. Therefore, enormous quantities of Piare
required to raise the degree of saturation of the solution. This
may be the reason why Piis ineffective in the present study.
The formation of a pellicle with human saliva as well as the exposure time scale of a few minutes used in the present study is of particular physiological relevance and clinical interest. First, this exposure time is comparable with clearance time
of acids in the mouth(23). Second, in the early stage, acids
diffuse into the tooth and remove Ca and Pifrom the outer
few micrometres of hard tissues, forming a demineralised, weakened layer. Remineralisation is possible in this stage, since the remaining enamel can serve as framework in
which minerals can be deposited again(43).
The present in vitro study, however, cannot totally repro-duce the clinical conditions, and should only be interpreted as a prediction of the relative erosive potential of a dietary substance or a medication. Erosion is a multifactorial con-dition, and its occurrence and development depend on many risk and protective factors as well as on their
inter-play(44). In addition to the erosive potential of dietary
sub-stances and medications, a variety of factors, for example frequency of acid intake, individual dietary habits (sipping,
gulping, frothing or use of a straw)(45), the physical properties
(the adhesiveness and displacement) of these agents(46), the
flow rate, composition and clearing capability of the saliva,
may influence the progress of tooth erosion(47). However, an
investigation of the parameters associated with the erosive potential of dietary substances and medications could act as a significant screening test through which dentists can provide instructional recommendations for patients at high risk of dental erosion. In addition, the present study covered a wide range of tested agents with various chemical and physi-cal properties. Some components in these agents may have an
Table 4. Spearman’s correlation coefficients: all chemical properties v. the changes in surface hardness (DSH) and the respective P values
DSH2 – 0* DSH4 – 0† Chemical property R2 P R2 P pH 20·83 ,0·0001 20·86 ,0·0001 Titratable acidity 0·14 0·0006 0·16 0·0001 Buffering capacity 0·04 0·321 0·06 0·154 Ca concentration 20·27 ,0·0001 20·28 ,0·0001 Piconcentration 20·13 0·0009 20·14 0·0005 F concentration 20·11 0·006 20·11 0·005 (pK 2 pI)HAP‡ 20·75 ,0·0001 20·78 ,0·0001 (pK 2 pI)FAP§ 20·70 ,0·0001 20·73 ,0·0001
pK 2 pI, degree of saturation; HAP, hydroxyapatite; FAP, fluorapatite. * DSH2 – 0¼ SH2 min2SHbaseline.
† DSH4 – 0¼ SH4 min2SHbaseline.
‡ pK 2 pI with respect to HAP. § pK 2 pI with respect to FAP.
Table 3. Multiple linear regression analysis of the changes in surface hardness (DSH) of all specimens after immersion in all agents for 2 and 4 min* (b Coefficients)
pH Buffering capacity Ca concentration F concentration Intercept
DSH P b P b P b P b P b
DSH2 – 0(R20·52)† ,0·0001 246·5 ,0·0001 20·5 ,0·0001 21·2 0·0006 234·2 ,0·0001 300·3
DSH4 – 0(R20·61)‡ ,0·0001 281·0 ,0·0001 20·6 ,0·0001 22·6 0·0055 239·9 ,0·0001 521·1
* P values (b: estimate) are listed for those variables with a significant impact on DSH. † DSH2 – 0¼ SH2 min2SHbaseline. ‡ DSH4 – 0¼ SH4 min2SHbaseline. A. Lussi et al. 260
British
Journal
of
Nutrition
https:/www.cambridge.org/core/terms. https://doi.org/10.1017/S0007114511002820influence on salivary pellicle and thus interfere in the correct assessment of tooth erosion. For example, black tea and red wine have been shown to have a profound effect on in vitro pellicle maturation, causing thickened layers of stained material to build up, which were not readily removed. The mechanism behind this effect was ascribed to the polyphenols
contained(48). Salivary proline-rich proteins, particularly
basic proline-rich proteins, via the proline rings(49), have a
particularly high affinity for dietary polyphenols(50,51), as do
histatins(52,53).
In conclusion, the present study confirmed the erosive potential of a wide range of dietary substances and medi-cations. Tooth erosion had a significant relationship with pH, with buffering capacity, F and Ca concentrations. The degree of saturation with respect to HAP and FAP, illustrating the combined effect of these parameters, showed a high bivariate correlation with tooth erosion.
Acknowledgements
The present study was supported by a grant from the Swiss Society of Odontology (project no. 222-05). A. L. designed the protocol. B. M. conducted the experiments. X. W., R. P. S. and A. L. analysed the data and wrote the manuscript. A. L. had primary responsibility for the final content. All authors read and approved the final manuscript. None of the authors reported a conflict of interest. We thank Stefanie Hayoz, Insti-tute of Mathematical Statistics and Actuarial Science, University of Bern, for the statistical analysis, and also Thiago Saads Car-valho, Faculdade de Odontologia da Universidade de Sa˜o Paulo, for the help in the revision of this manuscript.
References
1. Zero DT (1996) Etiology of dental erosion – extrinsic factors.
Eur J Oral Sci 104, 162 – 177.
2. Dugmore CR & Rock WP (2003) Awareness of tooth erosion
in 12 year old children and primary care dental practitioners. Community Dent Health 20, 223 – 227.
3. Ehlen LA, Marshall TA, Qian F, et al. (2008) Acidic beverages
increase the risk of in vitro tooth erosion. Nutr Res 28, 299 – 303.
4. Lussi A, Jaggi T & Scharer S (1993) The influence of different factors on in vitro enamel erosion. Caries Res 27, 387 – 393. 5. Lussi A, Jaeggi T & Jaeggi-Scharer S (1995) Prediction of the erosive potential of some beverages. Caries Res 29, 349 – 354.
6. Parry J, Shaw L, Arnaud MJ, et al. (2001) Investigation of
mineral waters and soft drinks in relation to dental erosion. J Oral Rehabil 28, 766 – 772.
7. Hara AT & Zero DT (2008) Analysis of the erosive potential
of calcium-containing acidic beverages. Eur J Oral Sci 116, 60 – 65.
8. Phelan J & Rees J (2003) The erosive potential of some
herbal teas. J Dent 31, 241 – 246.
9. Packer CD (2009) Cola-induced hypokalaemia: a super-sized
problem. Int J Clin Pract 63, 833 – 835.
10. Jager DH, Vieira AM, Ruben JL, et al. (2008) Influence of
beverage composition on the results of erosive potential measurement by different measurement techniques. Caries Res 42, 98 – 104.
11. Owens BM (2007) The potential effects of pH and buffering
capacity on dental erosion. Gen Dent 55, 527 – 531.
12. Edwards M, Creanor SL, Foye RH, et al. (1999) Buffering
capacities of soft drinks: the potential influence on dental erosion. J Oral Rehabil 26, 923 – 927.
13. Gray JA (1962) Kinetics of the dissolution of human dental
enamel in acid. J Dent Res 41, 633 – 645.
14. Featherstone JD & Rodgers BE (1981) Effect of acetic, lactic
and other organic acids on the formation of artificial carious lesions. Caries Res 15, 377 – 385.
15. Zero DT, Rahbek I, Fu J, et al. (1990) Comparison of the
iodide permeability test, the surface microhardness test, and mineral dissolution of bovine enamel following acid challenge. Caries Res 24, 181 – 188.
16. Chen PS, Toribara TY & Warner H (1956)
Microdetermina-tion of phosphorus. Anal Chem 28, 1756 – 1758.
17. Larsen MJ (1986) An investigation of the theoretical
back-ground for the stability of the calcium-phosphate salts and their mutual conversion in aqueous solutions. Arch Oral Biol 31, 757 – 761.
18. McDowell H, Gregory TM & Brown E (1977) Solubility of
Ca5(PO4)3OH in the system Ca(OH)2– H3PO4– H2O at 5, 25 and 378C. J Res Natl Bur Stand 81, 273 – 281.
19. McCann HG (1968) The solubility of fluorapatite and its
relationship to that of calcium fluoride. Arch Oral Biol 13, 987 – 1001.
20. Stiefel DJ (1976) Characteristics of an in vitro dental pellicle. J Dent Res 55, 66 – 73.
21. Wetton S, Hughes J, West N, et al. (2006) Exposure time of
enamel and dentine to saliva for protection against erosion: a study in vitro. Caries Res 40, 213 – 217.
22. Larsen MJ & Nyvad B (1999) Enamel erosion by some soft
drinks and orange juices relative to their pH, buffering effect and contents of calcium phosphate. Caries Res 33, 81 – 87.
23. Jensdottir T, Bardow A & Holbrook P (2005) Properties and
modification of soft drinks in relation to their erosive poten-tial in vitro. J Dent 33, 569 – 575.
24. Caglar E, Lussi A, Kargul B, et al. (2006) Fruit yogurt: any
erosive potential regarding teeth? Quintessence Int 37, 647 – 651.
25. Lussi A & Jaeggi T (2006) Chemical factors. In Dental
Erosion: from Diagnosis to Therapy, pp. 77 – 87 [A Lussi, editor]. Basel: Karger.
26. Brown CJ, Smith G, Shaw L, et al. (2006) The erosive
poten-tial of flavoured sparkling water drinks. Int J Paediatr Dent 17, 86 – 91.
27. Yamagishi K, Onuma K, Suzuki T, et al. (2005) Materials
chemistry: a synthetic enamel for rapid tooth repair. Nature 433, 819.
28. Shellis RP, Wahab FK & Heywood BR (1993) The
hydroxya-patite ion activity product in acid solutions equilibrated with human enamel at 37 degrees C. Caries Res 27, 365 – 372.
29. Shellis RP (1996) A scanning electron-microscopic study of
solubility variations in human enamel and dentine. Arch Oral Biol 41, 473 – 484.
30. Lussi A & Jaeggi T (2008) Erosion – diagnosis and risk
factors. Clin Oral Invest 12, S5 – S13.
31. Margolis HC, Zhang YP, Lee CY, et al. (1999) Kinetics of
enamel demineralization in vitro. J Dent Res 78, 1326 – 1335.
32. Tanaka M & Kadoma Y (2000) Comparative reduction
of enamel demineralization by calcium and phosphate in vitro. Caries Res 34, 241 – 245.
33. Mistry M & Grenby TH (1993) Erosion by soft drinks of rat
molar teeth assessed by digital image analysis. Caries Res 27, 21 – 25.
Erosive effect of dietary substances and medications 261
British
Journal
of
Nutrition
https:/www.cambridge.org/core/terms. https://doi.org/10.1017/S0007114511002820
34. Grobler SR, Senekal PJ & Laubscher JA (1990) In vitro demi-neralization of enamel by orange juice, apple juice, Pepsi Cola and Diet Pepsi Cola. Clin Prev Dent 12, 5 – 9.
35. Milosevic A (1997) Sports drinks hazard to teeth. Br J Sports
Med 31, 28 – 30.
36. Shellis RP, Barbour ME, Jones SB, et al. (2010) Effects of pH
and acid concentration on erosive dissolution of enamel, dentine, and compressed hydroxyapatite. Eur J Oral Sci 118, 475 – 482.
37. Jensdottir T, Holbrook P, Nauntofte B, et al. (2006)
Immedi-ate erosive potential of cola drinks and orange juices. J Dent Res 85, 226 – 230.
38. Larsen MJ & Richards A (2002) Fluoride is unable to reduce
dental erosion from soft drinks. Caries Res 36, 75 – 80.
39. West NX, Hughes JA, Parker DM, et al. (2003) Development
of low erosive carbonated fruit drinks 2. Evaluation of an experimental carbonated blackcurrant drink compared to a conventional carbonated drink. J Dent 31, 361 – 365.
40. West NX, Hughes JA, Parker DM, et al. (1999) Development
and evaluation of a low erosive blackcurrant juice drink. 2. Comparison with a conventional blackcurrant juice drink and orange juice. J Dent 27, 341 – 344.
41. Hughes JA, West NX, Parker DM, et al. (1999) Development
and evaluation of a low erosive blackcurrant juice drink in vitro and in situ. 1. Comparison with orange juice. J Dent 27, 285 – 289.
42. Dawes C (2003) What is the critical pH and why does a tooth
dissolve in acid? J Can Dent Assoc 69, 722 – 724.
43. Lussi A (2006) Erosive tooth wear – a multifactorial
condition of growing concern and increasing knowledge.
In Dental Erosion: from Diagnosis to Therapy, pp. 1 – 8 [A Lussi, editor]. Basel: Karger.
44. Lussi A, Hellwig E, Zero D, et al. (2006) Erosive tooth wear:
diagnosis, risk factors and prevention. Am J Dent 19, 319 – 325.
45. Zero D & Lussi A (2006) Behavioral factors. In Dental
Erosion: from Diagnosis to Therapy, pp. 100 – 105 [A Lussi, editor]. Basel: Karger.
46. Ireland AJ, McGuinness N & Sherriff M (1995) An
investi-gation into the ability of soft drinks to adhere to enamel. Caries Res 29, 470 – 476.
47. Hara AT, Lussi A & Zero DT (2006) Biological factors. In
Dental Erosion: from Diagnosis to Therapy, pp. 88 – 99 [A Lussi, editor]. Basel: Karger.
48. Joiner A, Muller D, Elofsson UM, et al. (2003) Adsorption
from black tea and red wine onto in vitro salivary pellicles studied by ellipsometry. Eur J Oral Sci 111, 417 – 422.
49. Williamson MP (1994) The structure and function of
proline-rich regions in proteins. Biochem J 297, 249 – 260.
50. Hagerman AE & Butler LG (1981) The specificity of
proanthocyanidin – protein interactions. J Biol Chem 256, 4494 – 4497.
51. Lu Y & Bennick A (1998) Interaction of tannin with human
salivary proline-rich proteins. Arch Oral Biol 43, 717 – 728.
52. Yan Q & Bennick A (1995) Identification of histatins as
tannin-binding proteins in human saliva. Biochem J 311, 341 – 347.
53. Wroblewski K, Muhandiram R, Chakrabartty A, et al. (2001)
The molecular interaction of human salivary histatins with polyphenolic compounds. Eur J Biochem 268, 4384 – 4397. A. Lussi et al. 262
![Table 1. Continued Tested agents Brand name/producer Flavour Erosion-relatedingredients pH mmol OH - /lto pH 7·0 b (mmol/l£pH) [Ca] (mmol/l) [P i ] (mmol/l) [F]](https://thumb-eu.123doks.com/thumbv2/123doknet/14893475.650301/4.1191.99.1090.92.782/table-continued-tested-agents-producer-flavour-erosion-relatedingredients.webp)
![Table 1. Continued Tested agents Brand name/producer Flavour Erosion-relatedingredients pH mmol OH - /lto pH 7·0 b (mmol/l£pH) [Ca] (mmol/l) [P i ] (mmol/l) [F]](https://thumb-eu.123doks.com/thumbv2/123doknet/14893475.650301/5.1191.96.1106.124.678/table-continued-tested-agents-producer-flavour-erosion-relatedingredients.webp)