HAL Id: hal-01167099
https://hal.archives-ouvertes.fr/hal-01167099
Submitted on 23 Jun 2015HAL is a multi-disciplinary open access archive for the deposit and dissemination of sci-entific research documents, whether they are pub-lished or not. The documents may come from teaching and research institutions in France or abroad, or from public or private research centers.
L’archive ouverte pluridisciplinaire HAL, est destinée au dépôt et à la diffusion de documents scientifiques de niveau recherche, publiés ou non, émanant des établissements d’enseignement et de recherche français ou étrangers, des laboratoires publics ou privés.
Volume measurement by using super-resolution MRI:
application to prostate volumetry
Estanislao Oubel, Hubert Beaumont, Antoine Iannessi
To cite this version:
Estanislao Oubel, Hubert Beaumont, Antoine Iannessi. Volume measurement by using super-resolution MRI: application to prostate volumetry. ECR 2015 - European Congress of Radiology, European Society of Radiology, Mar 2015, Vienna, Austria. �hal-01167099�
1
Volume measurement by using super-resolution MRI: application to
prostate volumetry
Estanislao Oubel, PhD1 , Hubert Beaumont, PhD 1, Antoine Iannessi, MD2
1 MEDIAN Technologies, Valbonne, France 2 Centre Antoine Lacassagne, Nice, France
Purpose Accuracy and precision of measurements are important for patient follow up in oncology but, unfortunately, partial volume effects introduce an undesired variability between observers. Super resolution techniques (SR) combine multiple acquisitions of an object into a single image richer in details. Herein, the use of SR for reducing variability is investigated in the specific context of prostate measurements. Prostate is typically imaged by T2-weighted MRI in three perpendicular low resolution images, each of them presenting partial volume effects in the direction of the slice selection gradient. SR techniques allow to combine these images into an image presenting the same level of details in all directions. This is expected to increase the accuracy and reproducibility of volume measurements, which in turn improves other derived measurements like PSA density [1][2]. Figure 1 shows an example of reconstruction and the images used as input.
2
Materials and Methods Experiments were performed on phantom and prostate images. A spherical MRI phantom (General Electric) was imaged to obtain axial, coronal, and sagittal T2 images by using a SE sequence. Image resolution was 0.4mm x 0.4mm x 3mm. Five sets of prostate images freely available from the National Alliance for Medical Image Computing [3] were also employed. Isotropic SR images (1mm x 1mm x 1mm) were created from the three perpendicular acquisitions by using BTK, an open source software originally developed for the processing of fetal MRI images that provides these capabilities [4]. Figure 2 shows a comparison between these two images. Two observers performed repeated volume measurements by using a semiautomatic method (Median Technologies, Valbonne, France) on SR images and original axial acquisitions (N=11 and N=8 respectively). Only one observer segmented prostate images (N=12). A comparison of intra/inter-observer variability for both images was performed by applying a Bartlett’s test [5], after verification of normality by using a Shapiro-Wink test [6]. All statistical analyses were performed by using R [7].
Results Figure 3 and Figure 4 show some examples of segmentations of the phantom and prostate images respectively. For phantom images, the intra- and inter-observer variability were significantly lower (p<=0.05) for the SR image (8.81ml vs. 16.17ml and 9.39ml vs. 16.26ml respectively). For prostate images, the relative differences were also lower for the SR image (1.6% vs. 3.1%) with p=0.09. A paired t-test showed a significantly higher volume for this image (p < 0.05).
3
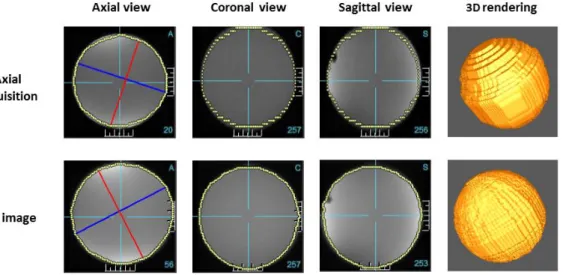
Figure 3. Segmentations of the original axial acquisition (top row) and the
reconstruction (bottom row) of the phantom. Blue and red lines show respectively the longest and the shortest diameters of the sphere. 3D renderings show that SR images provide better approximations of the real
shape.
Figure 4. Segmentations of the original axial acquisition (top row) and the
4
Conclusions SR allowed reducing the variability of volume measurements in phantoms and prostate images. This method could also be applied for lesion measurement, which would be of great importance in clinical trials. Finally, the presented technique allows to obtain images of arbitrary orientations from only three perpendicular acquisitions, which may help medical doctors provide a diagnosis.
References
[1] M. C. Benson, I. S. Whang, A. Pantuck, K. Ring, S. A. Kaplan, C. A. Olsson, and W. H. Cooner, “Prostate specific antigen density: a means of distinguishing benign prostatic hypertrophy and prostate cancer.,” J. Urol., vol. 147, no. 3 Pt 2, pp. 815–6, Mar. 1992.
[2] S. Sfoungaristos and P. Perimenis, “PSA density is superior than PSA and Gleason score for adverse pathologic features prediction in patients with clinically localized prostate cancer.,”
Can. Urol. Assoc. J., vol. 6, no. 1, pp. 46–50, Mar. 2012.
[3] K. Camphausen, A. Kaushal, and P. A. Pinto, “MIDAS Prostate Database,” 2010. [Online]. Available: http://insight-journal.org/midas/community/view/25.
[4] F. Rousseau, E. Oubel, J. Pontabry, M. Schweitzer, C. Studholme, M. Koob, and J.-L. Dietemann, “BTK: an open-source toolkit for fetal brain MR image processing.,” Comput
Methods Programs Biomed, vol. 109, no. 1, pp. 65–73, 2013.
[5] M. S. Bartlett, “Properties of Sufficiency and Statistical Tests,” Proc. R. Soc. A Math. Phys. Eng.
Sci., vol. 160, no. 901, pp. 268–282, May 1937.
[6] J. P. Royston, “An Extension of Shapiro and Wilk ’ s W Test for Normality to Large Samples,”
Appl. Stat., vol. 31, pp. 115–124, 1982.
[7] R Development Core Team, “R: A Language and Environment for Statistical Computing,” R