i
UNIVERSITÉ DU QUÉBEC
INRS- ÉNERGIE, MATÉRIAUX ET TÉLÉCOMMUNICATIONS
Role of Atomic and Molecular Resonances in High-order
Harmonic Generation from Laser-ablated Plumes
par
Muhammad Ashiq Fareed Thèse présentée pour l’obtention
du grade de PhilosophiæDoctor (Ph.D.) en Sciences de l’Énergie et des Matériaux
Jury d’évaluation
Président du jury Dr. François Légaré (INRS-EMT)
et examinateur interne
Examinateur externes Dr. Thomas Brabec
University of Ottawa, Ottawa, ON, Canada Dr. Louis DiMauro Ohio State University, Columbus, OH, USA
Directeur de recherche Dr. Tsuneyuki Ozaki (INRS-EMT)
ii
Abstract
High-order harmonic generation (HHG) process is explained with the so-called three-step model, where the valance electron is tunnel ionized, accelerates and photorecombines with the parent ion. In this model, it is assumed that electron’s motion is not perturbed from the atomic and molecular resonances. However, several experiments have shown that in the HHG process, the electron quantum path is perturbed from the atomic and molecular resonances that change the high-order harmonic properties. As the natural resonances are of different types (e.g., autoionizing, Giant resonance), their response for HHG is also observed differently. Several theoretical models have been proposed to explain the HHG mechanism from these resonances, but, in many cases of HHG from laser-ablated plumes (LAP), the information of the exact quantum path that the electron follows in the vicinity of these resonances was uncertain because of the lack of experimental proofs.
In this thesis, we use different elements containing different types of resonances and study their role in HHG. Tin, manganese and diatomic carbon are used as nonlinear media, as these elements contain strong resonance at different energies. The resonance of tin exists at energy ~ 26.35 eV, which appears from the autoionizing state (AIS) lying above the ionization threshold. Manganese contains an inner-shell giant resonance at energy ~ 51 eV that appears mainly from 3p-3d transitions. The resonance from diatomic carbon molecules could come from molecular dissociation, or involve an AIS or bound excited state.
In the first step, tin is used as a nonlinear medium for HHG to study electron interaction with the autoionizing 4d105s25p state. This AIS perturbs the HHG process and increases the intensity of a single harmonic, called the resonant harmonic (RH), at energy ~26.35 eV. The RH intensity is observed to be about 20 times higher than the intensity of neighboring harmonics generated with the conventional three-step process, when driven with 0.8 µm lasers. The physics involved behind this RH generation was unknown. We investigate electron dynamics in the vicinity of AIS with tunable long-wavelength laser pulses and explain the exact mechanism involved in RH generation. Further, in past, it was assumed that during RH generation, the continuum electron is perturbed by the AIS only. However, we have found for the first time that when continuum
iii
electron accelerates in the vicinity of the AIS, this electron is actually perturbed from three states; the AIS and its two dressed states of Sn+ lying at frequency ±2Ω (where Ω is the frequency of the driving laser). The perturbation from the dressed AIS appears in the form of two satellite harmonics generated at frequency ±2Ω around the RH. The contribution of dressed AIS in satellite harmonic generation is further confirmed by solving the time-dependent Schrödinger equation (TDSE).
In the second step, manganese is used as a nonlinear medium for HHG. It is well known that from manganese two high-order harmonic series are generated. The first high-order harmonic series consists of harmonics up to 48 eV. After that, the second harmonic series (SHS) starts around 51 eV and high-order harmonics up to very high energy (~156 eV) are generated, with driving laser of 0.8 µm wavelength. The physical phenomenon of this SHS generation was circumstantial and lacked experimental proof. We used different experimental schemes to investigate the physical phenomenon involved and found that the inner-shell 3p-3d transitions of Mn+ contribute to SHS generation. These results provide the routes to use inner-shell electrons for HHG and generate harmonics up to very high energy, with elements having low ionization potential (e.g., IpMn+=15.64 eV) and also to study the multi-electron dynamics in atomic media, as at least two electrons (inner-shell and valance electron) contribute in HHG.
Finally, we study high-order harmonics from laser-ablated graphite plume. We observed that intensity of carbon harmonics is surprisingly high, and that these harmonics contain a strong redshift. However, the physics behind these properties was unknown. In graphite ablation, different types of carbon species can be ablated with the laser-matter interaction, and because of this, the active species responsible for HHG from laser-ablated graphite plume was unsure. Therefore, first we used time-resolved plasma emission spectroscopy to check the species contributing to HHG. From the spectroscopic results, it is revealed that laser-ablated graphite plume contains an abundance of diatomic carbon molecules. The contribution of these diatomic molecules to HHG is studied by comparing the harmonic spectra with their photoionization cross-section (PICS). A good agreement is found between the PICS of C2 with the high-order harmonic spectrum. The spectroscopic results confirm that in laser-ablated graphite plume, high-order harmonics are generated from C2, and harmonic yield is high because of the large PICS of C2 in the XUV region.
iv
For the redshift, recent theoretical models predict that this redshift could appear because of two reasons. It could be either due to the involvement of the resonant excited states or molecular dissociation might be involved in HHG. We perform different experiments and investigate the exact physical reason involved behind this redshift.
v
Contents
List of Figures ………..……….…..………. vii
List of Tables ……….……….………. ix List of Abbreviations ……… x Acknowledgement ………..……….………. xii Chapter 1………...………... 1 Introduction…..………...………..……….. 1 1.1 Motivation ………. 1 1.2 Frequency Conversion ………. 2 1.3 Laser ablation ………... 3
1.4 High-order Harmonic Generation ……….. 5
1.4.1 Ionization ………..7
1.4.2 Propagation in the Continuum ……….. 8
1.4.3 Recombination ……… 9
1.5 Propagation Effects ... 11
1.5.1 Propogation Length ... 11
1.5.2 Phase Mismatch Factors ... 12
1.5.3 Photon Flux... 13
1.6 Role of Different Resonances in HHG ... 15
Chapter 2 ... 19
Experimental Setup ……….………...19
2.1 Ti:sapphire Laser System... 19
2.1.1 Pulse Compression ... 20
2.2 Optical Parametric Amplifier ... 21
2.2.1 Amplification Stage of OPA ... 22
2.2.2 Hollow-core Fiber Compression ... 23
2.3 High-order Harmonic Generation Setup ... 24
Chapter 3 ... 26
vi
3.1 Introduction ... 26
3.2 High-order Harmonic Generation from Sn+ ... 28
3.2.1 Resonant-Harmonic Response within the Driving Laser Bandwidth ... 30
3.3 Theoretical Calculations ... 33
3.4 Coherence ... 36
Chapter 4 ... 40
Role of Inner-shell 3p-3d Resonances in High-order Harmonic Generation………..…..….40
4.1 Introduction ... 40
4.2 High-order Harmonic Generation from Manganese ... 43
4.2.1 High-order Harmonic Cutoff Scaling with the Ionization Potential ... 44
4.2.2 Role of Inner-shell Resonances in HHG ... 45
4.3 Harmonic Generation with Long-wavelength Driving Lasers ... 50
Chapter 5 ... 54
Carbon Molecules for Intense High-order Harmonics from Laser-ablated Graphite Plume……….54
5.1 High-order Harmonics from Laser-ablated Graphite Plume ... 54
5.2 Time Resolved Laser-induced Breakdown Spectroscopy ... 56
5.3 Comparison between the High-order Harmonic Spectrum and the Photo-ionization Cross-section ... 61
Chapter 6 ... 66
Properties of High-order Harmonics Generated from Diatomic Carbon Molecules…...….66
6.1 Introduction ... 66
6.2 High-order Harmonics from Laser-ablated Graphite Plumes Containing Different Carbon Compositions ... 67
6.3 Wavelength Scaling of High-order Harmonics ... 69
6.4 Tunable Redshift ... 70
6.4.1 Role of Resonant-excited States ... 72
6.4.2 Redshift due to Molecular Dissociation ... 75
Chapter 7 ... 78
vii
List of Figures
Figure 1.1: Plasma evolution at different time scales of laser pulse interaction ……….……. 4
Figure 1.2: Schematic illustration of high-order harmonic generation …..………...…. 5
Figure 1.3: A typical high-order harmonic spectrum ……… 6
Figure 1.4: Trace of different electron trajectories at different phases ………... 9
Figure 1.5: Kinetic energy of electron at different phase angles ……….. 10
Figure 1.6: Harmonic flux variation as a function of medium length ……… 15
Figure 2.1: Schematic diagram of the laser system installed at ALLS ……….….. 20
Figure 2.2: Schematic diagram of the double grating laser compressor ……… 21
Figure 2.3: Configuration of the HE-TOPAS OPA installed at ALLS ………. 22
Figure 2.4: Schematic diagram of the setup used to increase the energy of the OPA ……...…. 22
Figure 2.5: Schematic illustration of the setup used for few-cycle laser pulses ………... 23
Figure 2.6: Schematic diagram of the experimental setup used for HHG ………... 24
Figure 3.1: High-order harmonic spectra of Sn+ at 1.84 µm driving laser ... 28
Figure 3.2: The RH response at different driving laser wavelengths ……….... 30
Figure 3.3: High-order harmonic spectra of Sn+ with 1.75 µm ……….………….….... 31
Figure 3.4: Energy diagram of the dressed autoionizing state of Sn+ ………...… 33
Figure 3.5: The spectrum calculated via 3D TDSE ………..…. 34
Figure 3.6: The gabor transforms showing the temporal envelopes of the emission ……….... 35
Figure 3.7: Random spectra showing collimated harmonic emission ………....…... 37
Figure 4.1: Experimental photoabsorption spectra of 3d metals (Sc to Cu) ……….…. 43
viii
Figure 4.3: High-order harmonic cutoff scaling with the ionization potential ………...… 45
Figure 4.4: Photoabsorption spectra of Mn and Mn+ ……….. 46
Figure 4.5: Comparison of the photoionization cross-section of manganese with the HHG spectrum ………...… 48
Figure 4.6: High-order harmonic spectra from manganese plume ………...……..… 50
Figure 5.1: HHG spectra generated from laser-ablated In+, Mg and C2 plumes …….……..…. 55
Figure 5.2: The spectrum of graphite plasma emission ………..… 57
Figure 5.3: Variation of the Swan bands for tsa of 30 to 90 ns ………...…. 58
Figure 5.4: Variation of high-order harmonic yield ………...… 59
Figure 5.5: Spectrally integrated images of carbon plasma plume expansion ………... 60
Figure 5.6: Comparison of the high-order harmonic spectra ………..…...…. 62
Figure 6.1: HHG spectra generated from three laser-ablated graphite plumes ……….…. 67
Figure 6.2: XRD pattern and SEM image of Graphite-91 target ………... 68
Figure 6.3: High-order harmonic spectra generated from carbon molecules ………. 69
Figure 6.4: High-order harmonic spectrum of C2 at 1.5 µm wavelength ………... 71
ix
List of Tables
Table 4.1: Spectroscopic parameters of Mn+ such as the energy, oscillator strength, line width
and the lifetime of the 3p53d64s and 3p53d54s2 resonances ……… 47
Table 5.1: The parameters, σi (Mb) and β (asymmetry parameter) used for the calculation of
photoionization cross-section ……….. 62
Table 6.1: Laser parameters used for high-order harmonic generation from diatomic carbon
x
List of Abbreviations
ADK Amonosov, Delone, and Krainov AIS Autoionizing state
ALLS Advanced laser light source
BS Beam splitter
DM Dichroic mirror
EDS Energy dispersive X-ray spectroscopy
HCF Hollow-core fiber
HFA Hartee-Fock Approximation
HHG High-order harmonic generation
IR Infrared
LAP Laser-ablated plume
LIBS Laser-induced breakdown spectroscopy MCP Multi-channel plate
MP Main pulse
MWP Macroscopic wave packet OPA Optical parametric amplifier PICS Photoionization cross-section
PP Prepulse
QRS Quantitative rescattering
RH Resonant harmonic
SEM Scanning electron microscope SFA Strong field approximation SHS Second harmonic series
xi
TDSE Time-dependent Schrödinger equation
THz Terahertz
TR-LIBS Time-resolved laser-induced breakdown spectroscopy
WLC White light continuum
XRD X-ray diffraction XUV Extreme ultra-violet
xii
Acknowledgement
I would like to thank my supervisor Prof. Tsuneyuki Ozaki for his constant support and guideline to achieve all the tasks that I have completed throughout my doctoral work. His excellent guidance, motivation and immense knowledge always inspired me. What I like the most is that he always has an easy solution of all complicated things, either related to experiment or general stuff. This work would not have taken its present shape without his help.
I would also like to thank Dr. Sudipta Mondal who helped me during initial period of my PhD. Besides him, I am thankful to Prof. François Légaré, Dr. Bruno Schmidt and Dr. Nicolas Thiré for providing me intense infrared laser source that did a magical job for me and I succeeded to obtain these wonderful results. I am also thankful to Prof. Andre D. Bandrauk, Dr. Vasily Strelkov and Dr. Xue-bin Bian for providing me useful information regarding to my experimental data.
Finally, I am very thankful to Antoine Laramée and Philippe Lassonde. They were always ready to help me during the critical moments of my experiments. I am also thankful to all the technicians working in the machine shop for solving my problems.
1
Chapter 1
Introduction
1.1 Motivation
The revolution of photonics started in 1960, when Maiman developed the first laser. This laser was capable of producing laser pulses of pulse duration around millisecond (10-3 sec), but with very low peak power. This laser source opened the path to study the fast dynamics lying within the millisecond time scale. Many researchers in the world immediately got involved in this field and laser technology advanced very rapidly. Just after one year, the discovery of Q-switching and mode-locking techniques helped to improve the pulse duration and the laser intensity. In 1985, we were able to generate femtosecond laser pulses [1], with peak intensity ~1015 Wcm-2. This short pulse duration enabled us to study ultrafast phenomena occurring at femtosecond time scale, for example, the rotational and vibrational motion of molecules [2].
The current trend is to capture and control even faster motion of particles occurring at attosecond
[1,3] or even zeptosecond [4] time scale, for example to capture and control the ultrafast motion
of electrons inside atoms [5,6], molecules [7], and solids [8]. In atomic media, e.g., for the hydrogen atom, the natural time scale of an electron revolving around the nucleus is about 157 attoseconds in order to complete one cycle around the nucleus. Therefore, we need laser pulses shorter than 157 as to capture this electron on its natural time scale.
In ultrafast theory, the shortest possible laser pulse duration is estimated from the bandwidth of the generated pulses [5]. According to this theory, the spectral bandwidth of linearly chirped Gaussian pulse can be estimated from the relation,
2
Here τ and a (a=2ln2 (1/τ2)) are the pulse duration and pulse width, and b is the chirp of the pulse. For a transformed limited Gaussian pulse, this equation can be written as,
(1.2)
Eq. 1.2 shows that in order to generate laser pulses with pulse duration ~ 157 as, laser pulses
with a bandwidth larger than 11.6 eV are required. Usually, femtosecond laser pulses are generated within the visible or infrared (IR) region of the electromagnetic spectrum. For example, the typical bandwidth of the Ti: sapphire laser is within the range of about 600 nm to 1000 nm [5]. As laser pulses of bandwidth around 11.6 eV or beyond are required in order to control the electron motion in hydrogen atom, it is hard to generate such a broad-bandwidth in the visible or infrared region. Therefore, laser pulses beyond the limit of the visible or IR region are required. This broad-bandwidth can be achieved by generating pulses in the soft ray or X-ray region. This can be achieved by several techniques, for example, with stimulated emission from laser produced plasmas [9] and free electron lasers [10]. However, the major problem of both techniques is that the time period of the generated X-ray pulses is in the picosecond or femtosecond range. Another possibility is to use nonlinear frequency conversion of ultrashort laser pulses in the XUV range. The details of this method are described below.
1.2 Frequency Conversion
In laser-matter interaction, when laser pulses interact with the medium, the response of the medium is usually categorized into three categories, known as linear, non-linear and extremely non-linear. The type of the response mainly depends on the laser intensity. The linear response occurs when low-intensity laser pulses interact with the medium and linear polarization (P) is induced by the material. This linear polarization can be expressed as,
(1.3)
In this equation, ε0 and χ represent the permittivity and susceptibility of the medium and E is the
electric field of the driving laser. At laser intensities lower than 1012 Wcm-2, this polarization
3
(1.4)
In nonlinear laser-matter interaction, the higher orders of susceptibility, such as χ2 and χ3 are induced. The initial orders of this susceptibility are perturbed when laser pulses at intensity < 1012 Wcm-2 interact with the medium.
When driving laser intensity increases from 1012 Wcm-2, higher orders of nonlinearities are induced. One such process is known as HHG. High-order harmonics are generated at laser intensities ranging from 1013 Wcm-2 to 1015 Wcm-2. In HHG, the fundamental laser light, with a certain frequency (ωL), is converted into a series of odd harmonics. These odd harmonics have a
wavelength range where the intensities are similar (details given later), and thus this method is highly suitable to generate broad-bandwidth laser pulses required for attosecond or zeptosecond pulse generation. Complete details of HHG are given in section 1.3.
High-order harmonics are generated with different types of material, such as using gaseous medium [11], LAP [12] and solid surfaces [13]. We are using LAP for HHG. The advantages of this technique for HHG are; (i) Variety of materials can be used as the nonlinear medium, (ii) High conversion efficiency (~10-4), and (iii) Generation of intense, narrow bandwidth XUV harmonics (resonant harmonic; details are given in chapter 3) [14,15].
To study HHG from LAP, it is important to understand the plasma properties to better understand the dynamics of HHG. In the following section, the properties of the LAP, such as its ablation and evolution with time are described.
1.3 Laser ablation
In HHG from low-density plasma plumes, the nonlinear medium is ablated from a solid target. This is achieved by focusing laser pulses of ~ 1010 Wcm-2 intensity on solid targets. High-order harmonic properties, such as efficiency and divergence strictly depend on the plasma properties. Plasma plumes with moderate density and volume are desirable to generate high-order harmonics with good specifications [16,17]. Generally, plasma plumes are ablated with laser pulses with nanosecond to femtosecond pulse duration [18]. The heat dissipation and energy absorption of the solid target is different for these lasers, and plasma plumes with different properties are
4
ablated with different lasers. When nanosecond laser pulses are used for ablation, the sample heating, ionization and vaporization all occur during the laser pulse interaction because of large laser pulse duration. However, in the case of picosecond or femtosecond laser pulses, the ablation starts after the pulse heating and complete energy is used for the ablation only [19]. The time evolution of plasma with nanosecond and femtosecond laser pulses is shown in the following figure.
Figure 1.1: Plasma evolution at different time scales of laser pulse interaction [19].
We use picosecond laser pulses for the plume ablation and then laser-induced breakdown spectroscopy is usually used to study the plasma properties. First, the spatial and temporal properties of this plume are optimized for the efficient HHG and then the atomic/molecular density is controlled with the heating pulse intensity (details given below). It is observed that efficient harmonics are generated with laser intensity ~ 1010 Wcm-2 that is used to ablate few micrograms of material per pulse [20]. This low ablation of material from the target surface provides an opportunity to generate stable harmonics up to few minutes at same target position
[21].
Plasma plumes with relatively low free carrier density are required for efficient HHG [16]. This is because high free carrier density will increase phase mismatch, thus reducing the high-order
5
harmonic efficiency. From Fig. 1.1, we can see that when heating pulse interact with the solid target, thermal evaporation starts after few nanoseconds of interaction, and then the plasma plume expands in the perpendicular direction. The lifetime of this plasma plume is usually from microseconds to milliseconds (Fig. 1.1). For harmonic generation, plasma is expanded for 30 ns to 100 ns and then an orthogonal laser pulse is introduced for HHG. This period is maintained to expand the plasma and cool it down so that the number of free carriers are reduced in the plasma. The second important parameter for efficient HHG is the medium density. Efficient harmonics are generated when the density of the medium becomes moderate during plasma plume expansion. This parameter is usually controlled by changing the heating pulse intensity. For the laser parameters used for efficient HHG, the medium density is estimated to be from 1016 to 1017 cm-3 [22].
1.4 High-order Harmonic Generation
HHG is known as an extremely high nonlinear process that occurs when intense laser field (≥1013 Wcm-2) interact with an atom or molecule. This HHG process is usually explained with the quasi-classical three-step model [23]. According to this model, when ultrafast laser pulses interact with an electron, this electron is tunnel ionized from an atom. In the second step, this electron accelerates in the continuum by the applied laser field and then finally recombines with the parent ion by emitting a high-energy photon. The schematic illustration of this three-step process is shown in Fig. 1.2 below.
Figure 1.2: Schematic illustration of high-order harmonic generation. In the three-step model, an electron is ionized (via tunneling) from an atom (step 1). Then, this electron is accelerated by the applied laser field (step 2) and finally recombines to the atom by emitting an XUV photon (step 3) [24].
6
Several numerical methods based on the three-step process are used to model the high-order harmonic spectrum. The most popular methods are TDSE, strong field approximation (SFA), and quantitative rescattering (QRS) theory [23,25,26]. The typical high-order harmonic spectrum calculated with SFA model is given in the following figure.
Figure 1.3: A typical high-order harmonic spectrum calculated with the strong field approximation.
This high-order harmonic spectrum is usually divided into three parts, known as the perturbative, plateau, and cutoff. The perturbative part of the harmonic spectrum consists of low-order harmonics, which are usually generated with low intensities (≤1012 Wcm-2). The plateau of the harmonic spectrum contains a series of harmonics with similar peak intensity. Finally, the cutoff of the harmonic spectrum represents the highest kinetic energy that the recombining electron gains during the three-step process. This cutoff energy is the sum of the maximum ponderomotive energy that electron gains in the continuum during acceleration and the ionization potential of the element (details are given in the next section).
Only odd harmonics of the fundamental frequency are generated because of the inversion symmetry in the conversion medium. However, this inversion symmetry can be broken by introducing an additional second harmonic laser pulse. Further details of these three steps, such as ionization, acceleration and recombination are described below.
0 20 40 60 80 100 120 140 10-20 10-10 100 Energy (eV) In te n s it y ( a .u .)
Strong Field Approximation Log Scale
Cutoff Plateau
7
1.4.1 Ionization
The first step of the three-step model is ionization. When high-intensity laser pulses interact with an atom, the atomic potential can be written as,
⃗ (1.5) At certain laser intensity, when the electric field strength becomes comparable to the interatomic field strength, the tunneling process occurs and the electron is ionized. The schematic diagram of this tunneling process is shown in Fig. 1.2.
High-order harmonic efficiency depends on the number of atoms participating in HHG. In 1965, Keldysh [27] introduces a model to calculate the ionization rate from a specific element. The rate equation that he introduced is given as,
√ ( ) (
) ,
- (1.6) Here Eion and ω are the ionization potential and frequency of the driving laser. The parameter γ is
known as the Keldysh parameter and is given as,
(
)
Here, Up is the ponderomotive energy of electron and γ is used to differentiate the process of tunneling ionization and the multi-photon ionization. The tunneling process occurs when γ<<1
[27].
In 1986, Amonosov, Delone, and Krainov [28] improved the accuracy of this method and introduced the ADK model. The ionization rate equation of this model is given as,
| | ( ) ,
8
The parameters, | | , , and n* are given below,
; | | √ ; ( ) ⁄ | | ∫ ; ≡ gamma function (Γ(n)=(n-1)!)
Here Z is the net resulting charge of the atom and represents the ionization potential of the hydrogen atom.
Both models given in Eq. 1.6 and 1.7 show that the ionization rate from the medium increases exponentially with the driving laser frequency and is wavelength independent. The ADK model gives more accurate values of ionization rate and is commonly used for the ionization rate calculation to model the high-order harmonic spectrum [23,25]. However, ADK model only holds when gamma goes to zero. Perelomov et al. introduced PPT model that include the Coulomb interaction at larger internuclear distances [29,30].
1.4.2 Propagation in the Continuum
The second step of the three-step model is the acceleration of the tunnel-ionized electron [23]. We use the classical picture to understand the motion of this electron in the driving laser field. When the driving laser field interacts with the electron, the velocity and the position of this free electron at an arbitrary phase ϕ can be written as,
̇ (1.8)
{ } (1.9) Here and is given as
9
If we consider an electron located at position x=0 and appear in the continuum at time zero with zero initial velocity, the trace of the electron trajectories at different phases can be calculated as,
Figure 1.4: Trace of different electron trajectories at different phases in the position-velocity plane.
Fig. 1.4 shows the different trajectories of an electron at different phases of applied electric field.
This figure shows that a few electron trajectories return back at position x=0 and electrons from these trajectories only participate in HHG. Most of the electrons are produced at unfavorable phases and never return back. This figure also indicates that the maximum kinetic energy is obtained at 17o, which gives the cutoff of the high-order harmonics. The kinetic energy that electron can experience in the continuum is given below,
=9.33×10⁻¹⁴ IL [Wcm-2] λL2 [µm] (1.10)
1.4.3 Recombination
The final step of the three-step model is the recombination. When electron recombines with the parent ion, a high energy photon is emitted. The maximum energy of this electron can be estimated with the equation,
10
Here Ip is the ionization potential of the element and Kmax represents the maximum kinetic energy
that a recombining electron can experience in the continuum. The trend of the kinetic energy can be obtained by solving Eq. 1.9 numerically at x=0, and calculating the kinetic energy for various laser field phases. The variation of kinetic energy at different phase angles is shown in Fig. 1.5. This figure shows that the maximum kinetic energy obtained at 170 is 3.17Up.
Figure 1.5: Kinetic energy of electron at different phase angles. Therefore, Eq. 1.11 can be written as,
Emax = Ip + 3.17Up (1.12)
This relation is known as the cutoff rule of the three-step model and gives the approximate value of harmonic cutoff that can be observed from a specific element.
This equation shows that the harmonic cutoff can be increased by increasing the ponderomotive energy of the electron that depends on the driving laser intensity and wavelength (Eq. 1.10). However, it is observed that the saturation intensity limits the high-order harmonic cutoff [1]. This is because the high laser intensities increase the number of free carriers in the plasma that introduce a phase mismatch in HHG. In the following section, we will see how this phase mismatch affects the HHG process.
11
1.5 Propagation Effects
The three-step model can only predict high-order harmonic cutoff, but this model cannot estimate the harmonic yield. High-order harmonic spectrum is generated due to the coherent sum of the radiated fields produced from a large number of atoms/molecules in the generation medium. Therefore, propagation effects are important to be considered to obtain the high-order harmonic strength [31]. In this section, we will study the properties of driving field when it propagates through the nonlinear medium for HHG and its limits for high-order harmonic efficiency.
1.5.1 Propagation Length
For coherent harmonic build up, the generated harmonics should propagate parallel to the driving laser field. When laser pulse propagates in the medium, there is a certain length over which both the laser field and the harmonic wave can remain in phase [32]. This length is called the coherence length and is given as,
(1.13) Here Δk=qk0-kq is the phase mismatch that depends on the wave vector of both driving laser field
(k0) and harmonic order (kq; q represent the harmonic order). This equation shows that coherence
length depends on the phase matching conditions. Optimal phase matching is achieved when Δk=0 condition is achieved. Usually, phase matching is improved by choosing appropriate laser conditions and geometry of the medium. Complete details of the parameters involved in phase matching are described in the next section.
The other limitation of this propagation effect is the limited absorption length of the medium. When harmonic photon energy exceeds the binding energies of the medium, the generated harmonics can be absorbed by the medium itself [32]. This absorption length is given as
12
Here ρ is the medium density and ϭ represents the photoionization cross-section. This parameter limits the cutoff of the harmonics [32].
The phase mismatch factors that can occur during laser propagation in the medium are described in the following section.
1.5.2 Phase Mismatch Factors
In LAP, phase mismatch mainly comes from four factors [33] that are known as atomic dispersion (Δkatm), plasma dispersion (Δkplasma), Gouy phase shift (ΔkGouy) and dynamical phase
shift (ΔkDyn).
Therefore, phase mismatch due to these factors can be written as,
Δk = Δkatm + Δkplasma + ΔkGouy + ΔkDyn (1.15) The phase mismatch due to the atomic dispersion is given as,
(1.16) Here, nLaser and nHarmonic represents the refractive indices of the driving laser and qth harmonic
order. The refractive index for the driving laser field at frequency ωL can be written as,
∑
Here, , N, , ωk and Ak are the ionization fraction (Nelectron/Natomic; usually considered
from 5 to 10%), atomic density, ratio of the statistical weights, transition frequencies and Einstein’s coefficient respectively. The value of nHarmonic is usually assumed as one.
Using this relation of refractive index, Eq. 1.16 becomes,
(1.17) The phase mismatch due to the plasma dispersion is written as,
13
(1.18) This phase mismatch is introduced due to the production of free carriers in the medium. The third phase mismatch factor that could appear during HHG is the Gouy phase shift. When laser pulses are focused in the medium, the Gouy phase shift is introduced because of the phase change. For the Gaussian laser beam, Gouy phase at position z can be written as,
Here d is the distance of the focus from the target position and zR ( ) represents the
Rayleigh length. The phase mismatch in the qth harmonic, occurring due to Gouy phase can be written as,
*
+ (1.19)
The final phase mismatch that could appear in HHG from LAP is the dynamical phase shift that comes from the laser intensity. This phase mismatch at focusing distance d is written as,
(1.20) Here IL represents the laser intensity and C1,2 is a constant that depend on the trajectory of the
harmonic (long and short trajectories) that electron follows for HHG (Fig. 1.4).
1.5.3 Photon Flux
For this limited propagation length and phase mismatch (discussed above), the photon flux that can build up during HHG can be estimated [32]. For a certain medium length (Lmed), the field
amplitude of the harmonic radiation can be written as,
14
Here d(qωL) represents the dipole moment for the qth harmonic. This dipole moment can be
calculated with the SFA model. Including phase mismatch factors and reabsorption limit ( ) the
Eq. 1.21 can be written as,
∫ (1.22) Here and are the phase mismatch and reabsorption terms of harmonics at position z. As we know from Eq. 1.13 and Eq. 1.14 that
and
Using these two equations and total phase mismatch Δk, given in Eq. 1.15, the equation of field amplitude becomes, ∫ ( ) [ ] Or [ ] ∫ ( ) * + ( ) ( ) (1.23)
For qth harmonic, number of photons are given as, | | Or | | * ( ) ( ) ( )+ (1.24)
15
This equation gives us the photon flux that can be produced from a specific element.
The evaluation of Nq as a function of medium length was calculated by Constant et al. [32],
which is presented in the following figure. From this evaluation, Constant et al. found that the overall optimizing conditions in the absorption medium are,
Lmed > 3Labs and Lcoh > 5Labs
Figure 1.6: Harmonic flux variation as a function of medium length [32].
1.6 Role of Different Resonances in HHG
In the three-step model, it is assumed that only ground state electron participates in HHG, and the contribution from the inner shells and resonant-excited states are ignored. Contrary to that, several experimental results have been shown that the HHG process is perturbed from the atomic and molecular resonances. In laser-ablation technique of HHG, this was first observed by Ganeev et al. [34] in the harmonics from In+. He observed a dramatic change in a single harmonic intensity and attributed this change due to the involvement of AIS in HHG, lying above the ionization threshold. Later, the perturbation in HHG process has been observed in several media appearing from inner-shell [35], below ionization-threshold [36,37] and above ionization-threshold resonances [38].
16
The HHG mechanism from these resonances is different than the three-step process. In this thesis we have used different elements containing different types of resonances and studied that how these resonances contribute in HHG and the exact mechanism involved in resonant HHG is investigated.
17
References
[1] P. Corkum and F. Krausz, Nat. Phys. 3, 381 (2007). [2] A. H. Zewail, J. Phys. Chem. A 104, 5660 (2000).
[3] T. Popmintchev, M.-C. Chen, D. Popmintchev, P. Arpin, S. Brown, S. Alisauskas, G. Andriukaitis, T.
Balciunas, O. D. Mücke, A. Pugzlys, A. Baltuska, B. Shim, S. E. Schrauth, A. Gaeta, C. Hernández-García, L. Plaja, A. Becker, A. Jaron-Becker, M. M. Murnane, and H. C. Kapteyn, Science 336, 1287 (2012).
[4] C. Hernandez-Garcia, J. A. Perez-Hernandez, T. Popmintchev, M. M. Murnane, H. C. Kapteyn, A. Jaron- Becker, A. Becker, and L. Plaja, Phys. Rev. Lett. 111, 033002 (2013).
[5] Z. Chang, Fundamentals of Attosecond Optics (CRC Press, 2011).
[6] T. Popmintchev, M.-C. Chen, P. Arpin, M. M. Murnane, and H. C. Kapteyn, Nat. Photonics 4, 822 (2010). [7] G. Sansone, F. Kelkensberg, J. F. Pérez-Torres, F. Morales, M. F. Kling, W. Siu, O. Ghafur, P. Johnsson, M. Swoboda, E. Benedetti, F. Ferrari, F. Lépine, J. L. Sanz-Vicario, S. Zherebtsov, I. Znakovskaya, A. L’Huillier, M. Y. Ivanov, M. Nisoli, F. Martín, and M. J. J. Vrakking, Nature 465, 763 (2010).
[8] M. Schultze, K. Ramasesha, C. D. Pemmaraju, S. A. Sato, D. Whitmore, A. Gandman, J. S. Prell, L. J. Borja, D. Prendergast, K. Yabana, D. M. Neumark, and S. R. Leone, Science 346, 1348 (2014).
[9] M. M. Murnane, H. C. Kapteyn, M. D. Rosen, and R. W. Falcone, Science 251, 531 (1991). [10] V. Ayvazyan, N. Baboi, J. Bähr Eur. Phys. J. D 37, 297 (2006).
[11] S. Kazamias, D. Douillet, F. Weihe, C. Valentin, A. Rousse, S. Sebban, G. Grillon, F. Augé, D. Hulin, and P. Balcou, Phys. Rev. Lett. 90, 193901 (2003).
[12] R. A. Ganeev, J. Phys. B At. Mol. Opt. Phys. 40, R213 (2007).
[13] P. Norreys, M. Zepf, S. Moustaizis, A. Fews, J. Zhang, P. Lee, M. Bakarezos, C. Danson, A. Dyson, P. Gibbon, P. Loukakos, D. Neely, F. Walsh, J. Wark, and A. Dangor, Phys. Rev. Lett. 76, 1832 (1996). [14] R. A. Ganeev, T. Witting, C. Hutchison, F. Frank, P. V. Redkin, W. A. Okell, D. Y. Lei, T. Roschuk, S. A. Maier, J. P. Marangos, and J. W. G. Tisch, Phys. Rev. A 85, 015807 (2012).
[15] R. A. Ganeev, High-Order Harmonic Generation in Laser Plasma Plumes (World Scientific, 2013). [16] M. A. Fareed, S. Mondal, Y. Pertot, and T. Ozaki, J. Phys. B. 49, 035604 (2016).
[17] R. A. Ganeev, L. B. Elouga Bom, and T. Ozaki, Phys. Plasmas 18, 083101 (2011).
[18] A. W. Miziolek, V. Palleschi, and I. Schechter, Laser-Induced Breakdown Spectroscopy (LIBS): Fundamentals and Applications (Cambridge, 2006).
[19] Sergio Musazzi, Umberto Perini (eds), Laser -Induced Breakdown Spectroscopy: Theory and Applications (Springer Series in Optical Sciences, 2014).
[20] S. Rajendiran, A. K. Rossall, A. Gibson, and E. Wagenaars, Surf. Coatings Technol. 260, 417 (2014). [21] L. B. Elouga Bom, Y. Pertot, V. R. Bhardwaj, and T. Ozaki, Opt. Express 19, 3077 (2011).
[22] R. A. Ganeev, L. B. Elouga Bom, T. Ozaki, and P. V. Redkin, J. Opt. Soc. Am. B 24, 2770 (2007). [23] P. Corkum, Phys. Rev. Lett. 71, 1994 (1993).
[24] C. Winterfeldt, C. Spielmann, and G. Gerber, Rev. Mod. Phys. 80, 117 (2008).
[25] M. Lewenstein, P. Balcou, M. Y. Ivanov, A. L’Huillier, and P. B. Corkum, Phys. Rev. A 49, 2117 (1994). [26] A. T. Le, R. R. Lucchese, S. Tonzani, T. Morishita, and C. D. Lin, Phys. Rev. A. 80,
013401 (2009).
[27] L. V. Keldysh, J. Exp. Theor. Phys. 20, 1307 (1965).
[28] M. V. Ammosov, N. B. Delone, and V. P. Krainov, Sov. Phys. JETP 64, 1191 (1986). [29] A. M. Perelemov V. S. Popov and M. V. Terent'ev, Soviet Phys. JETP, 23 924 (1966). [30] A. M. Perelemov and V. S. Popov Soviet Phys.JETP, 25 336 (1967).
[31] C. Winterfeldt, C. Spielmann, and G. Gerber, Rev. Mod. Phys. 80, 117 (2008).
[32] E. Constant, D. Garzella, P. Breger, E. Mével, C. Dorrer, C. Le Blanc, F. Salin, and P. Agostini, Phys. Rev. Lett. 82, 1668 (1999).
18
[33] H. Singhal, V. Arora, B. Rao, P. Naik, U. Chakravarty, R. Khan, and P. Gupta, Phys. Rev. A 79, 023807 (2009).
[34] R. A. Ganeev, M. Suzuki, M. Baba, H. Kuroda, and T. Ozaki, Opt. Lett. 31, 1699 (2006).
[35] A. D. Shiner, B. E. Schmidt, C. Trallero-Herrero, H. J. Wörner, S. Patchkovskii, P. B. Corkum, J.-C. Kieffer, F. Légaré, and D. M. Villeneuve, Nat. Phys. 7, 464 (2011).
[36] X.-B. Bian and A. D. Bandrauk, Phys. Rev. A 83, 041403 (2011). [37] M. Gaarde and K. Schafer, Phys. Rev. A 64, 013820 (2001).
[38] T. Ozaki, R. A. Ganeev, M. Suzuki, and H. Kuroda, High-order Harmonic Generation from Low-Density Plasma, in (In Tech, 2010).
19
Chapter 2
Experimental Setup
Experiments are performed at the Advanced Laser Light Source (ALLS, Varennes (QC) Canada). This is a high power multi-beam Ti:sapphire based laser system, providing laser pulses in a wide range of electromagnetic spectrum, ranging from terahertz (THz) to Soft X-rays [1–5]. At this laser facility, two laser lines are used for the HHG from LAP. These two laser lines are capable of producing laser pulses of energies 350 mJ and 80 mJ, at repetition rates of 10 Hz and 100 Hz, respectively. The central wavelength of these laser pulses is ~ 0.8 µm and pulse duration before compression is ~ 210 ps. These laser pulses are then seeded to different optical systems to generate laser pulses at variable wavelengths ranging from 0.266 µm to 2.3 µm. Finally, these laser pulses with different specifications are used to generate order harmonics. On the high-order harmonic setup, XUV pulses of multi-µJ energy are produced. Complete details of the XUV beam line are given below.
2.1 Ti:sapphire Laser System
The schematic diagram of the Ti:sapphire laser system developed at ALLS is shown in Fig. 2.1. In this laser system, the femtosecond oscillator produces laser pulses of energy ~4 nJ at wavelength ~795 nm. These laser pulses are then seeded to different optical systems for energy amplification. After amplification, this laser system produces laser pulses of energy ~25 mJ, at 100 Hz repetition rate. These laser pulses are then divided into two parts, to generate laser pulses at two different repetition rates of 10 Hz and 100 Hz. One part of the 10 Hz line is passed through two amplification stages and laser pulses of energy ~410 mJ are produced. The second part of the beam (at 100 Hz repetition rate) is passed through different amplification stages (shown in Fig. 2.1) and laser pulses of energy ~80 mJ are produced.
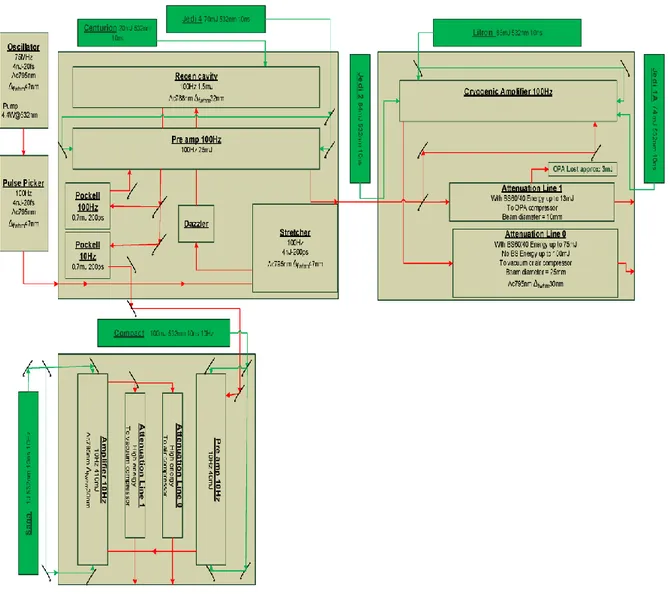
20
Figure 2.1: Schematic diagram of the laser system installed at ALLS. This is a Ti:sapphire based laser system that produces laser pulses of energy 410 mJ and 80 mJ at two different repetition rates of 10 Hz and 100 Hz respectively. The pulse duration of these laser pulses is ~210 ps and wavelength is centered at ~ 800 nm.
2.1.1 Pulse Compression
The pulse duration of this laser system (described above) is ~210 ps. These laser pulses have bandwidth around 30 nm at FWHM. To achieve high intensity, these laser pulses are further compressed with double grating compression technique. The schematic diagram of this double grating compression is shown in Fig. 2.2. In this technique, the path of the long-wavelength and short-wavelength components is varied to compress these pulses. With this compression technique, laser pulses as short as 40 fs are produced at both lines of ALLS laser system.
21
Figure 2.2: Schematic diagram of the double grating laser compressor.
2.2 Optical Parametric Amplifier
The optical parametric amplifier (OPA) installed at ALLS is the HE-TOPAS model from Light Conversion Ltd. This is a white light OPA based on the two-stage parametric amplifier. The schematic diagram of HE-TOPAS is given in Fig. 2.3. The configuration of this OPA comprises several subunits consisting of beam delivery, white light continuum (WLC) generation, and amplification stages. All subunits are arranged in a single unit and are computer controlled, which allow the precise control of the optics for efficient light conversion.
Compressed laser pulses of energy ~ 5 mJ and pulse duration ~ 40 fs are seeded to this OPA. A small part of this beam (about 1-3 µJ) is used to produce WLC in a sapphire plate. After that, this WLC along with a small fraction of the beam with energy ~30-50 µJ are focused into the pre-amplifier crystal. Non-collinear geometry is used to temporally overlap these pulses, as this configuration is suitable to separate the amplified signal beam. This signal beam is further amplified with a second amplification stage.
Wavelength tuning is achieved in the pre-amplifier stage by changing the delay of the white-light pulse with respect to the pump pulse and adjusting the crystal angle for optimal phase-matching. After that second amplification stage is optimized to amplify the power of these pulses.
22
Figure 2.3: Configuration of the HE-TOPAS OPA installed at ALLS.
2.2.1 Amplification Stage of OPA
The output energy of the signal and idler beams from the OPA is low. The maximum output energy of both beams is ~1 mJ only. This low energy limits the application of this infrared laser source. Therefore, we use an amplification stage to increase the output energy of this laser system. The schematic diagram of this amplification stage is given below.
Figure 2.4: Schematic diagram of the setup used to increase the energy of the OPA; BS: Beam splitter; DM: Dichroic mirror; Pol: Polarizer; υ: Pinhole diameter used for spatial filtering; Autocorrelator: Homebuilt all reflective second harmonic generation autocorrelator; λI: central wavelength of the Idler of the optical parametric
23
Fig. 2.4 shows the schematic diagram of the amplification stage used to increase the energy of
the conventional OPA (HE-TOPAS, Light Conversion, Ltd.). This setup is installed on the 100 Hz line, which can produce 80 mJ of energy at 0.8 µm wavelength. A small part of 100 Hz line (with energy ~5 mJ) is separated using a beam splitter (BS) and then seeded to the OPA after compression. This OPA has two outputs known as Signal (λsig = 1.45 µm) and Idler (λIdl = 1.80 µm), and the energies of these beams at specified wavelengths are ~1.1 mJ and 0.9 mJ respectively. The Idler beam is separated from the Signal using a dichroic mirror (DM), and then spatially filtered by focusing it through a 250 µm diameter pinhole, installed under vacuum. The transmission of this spatial filter is observed to be around 75%–80%. The remaining energy of the Ti:sapphire laser is compressed first with another double grating compressor and is then used to amplify the Idler beam using a type-II phase matching BBO crystal (22×22×2 mm). This laser system can produce 10 mJ of energy at 1.8 µm wavelength and the minimum pulse duration achieved is ~50 fs. The wavelength tuning range of Idler beam is from 1.6 µm to 2.2 µm. Further details of this intense femtosecond laser system are given in Ref. [3].
2.2.2 Hollow-core Fiber Compression
The pulse duration of the laser system after amplification is about 50 fs, at wavelength ~1.8 µm. This pulse duration is further reduced to 12 fs with the hollow-core fiber compression technique. The details of this hollow-core fiber compression setup are given below.
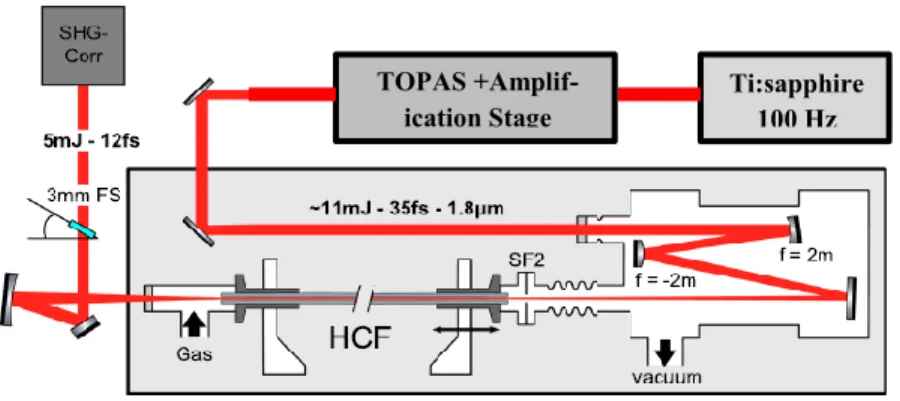
Figure 2.5: Schematic illustration of the setup used for few-cycle laser pulse generation at ALLS. Three meters long hollow-core fiber, with an inner diameter of 1mm, is used for pulse broadening and laser pulses of energy ~5 mJ and pulse duration ~12 fs are produced. Here, HCF and SHG-Corr represent the hollow-core fiber and second harmonic auto-correlator respectively [6].
Ti:sapphire 100 Hz TOPAS +Amplif-
24
For few-cycle laser pulse generation, the amplified Idler beam (discussed in section 2.2.1) are focused inside the three-meter long hollow-core fiber (HCF) with a beam coupling telescope. This telescope consists of two concave mirrors with separation around 105 cm. This beam is first passed through a spatial filtering pinhole (FS2) and then sent to the HCF. The inner diameter of this three-meter long HCF is ~1mm. Two fiber holders are connected with this fiber system for the gas input. All this setup is installed under vacuum and pressure is monitored at different input and output of the HCF system. Different gasses such as Ar, Kr, Ne or He are used for the pulse broadening. Finally, the output of this HCF system is compressed with a fused silica window. This laser system is capable of producing 0.42 TW laser pulses with pulse duration around 12 fs, at 1.8 µm wavelength. Complete details of this laser system are given in Ref. [6].
2.3 High-order Harmonic Generation Setup
Figure 2.6: Schematic diagram of the experimental setup used for HHG from laser-ablated plumes.
For the HHG from laser-ablated plasma plume, we use two laser beams. We call these beams the prepulse (PP) and the main pulse (MP). The PP is used for the plasma ablation from the solid target, and the MP of different specification discussed in section 2.2 is used for HHG. The PP is usually separated from the laser beam before compression and is then focused on to a solid target for plume ablation. The solid target is placed inside a vacuum chamber and the pressure of this chamber is maintained at ~10-5 Torr. The PP intensity is maintained at ~1010 Wcm-2 and plasma plume is ablated over the circular spot of ~200 µm. After a certain delay of few tens of nanoseconds, the MP is focused on to this LAP for harmonic generation. The delay is required between the PP and the MP so that the plasma can expand vertically from the surface. The generated harmonics are then sent to a soft X-ray spectrometer, consisting of a flat-field Hitachi grating (1200 lines/mm) and a multi-channel plate (MCP) followed by a phosphor screen.
25
Finally, the harmonic spectrum detected by the MCP is then captured by a 16-bit camera (CMOS, PCO-edge).
We also use time-resolved laser-induced breakdown spectroscopy (LIBS) for the visible plasma emission spectroscopy. In this technique, a computer-controlled triple grating spectrometer (Newport, MS260i; Spectral range from 200 nm to 1350 nm) is used for collecting the plasma emission. The spectral resolution of this spectrometer is ≈0.2 nm for the 1200 lines/mm grating, with a wavelength accuracy of 0.35 nm. The plasma emission is imaged on to the entrance slit of the spectrometer by an achromatic lens of 10 cm focal length and a magnification of ~2.5. Then an ICCD camera (Andor, iStar 720) is used to record the images in a storage device. The minimum gate speed of this time-resolved system is < 2 ns, and it covers the spectral region from 115 nm to 920 nm wavelength.
References
[1] L. B. Elouga Bom, Y. Pertot, V. R. Bhardwaj, and T. Ozaki, Opt. Express 19, 3077 (2011). [2] T. Ozaki, J. C. Kieffer, R. Toth, S. Fourmaux, and H. Bandulet, Laser Part. Beams 24, 101 (2006).
[3] N. Thiré, S. Beaulieu, V. Cardin, A. Laramée, V. Wanie, B. E. Schmidt, and F. Légaré, Appl. Phys. Lett. 106, 091110 (2015).
[4] X. Ropagnol, F. Blanchard, T. Ozaki, and M. Reid, Appl. Phys. Lett. 103, 161108 (2013).
[5] F. Blanchard, B. E. Schmidt, X. Ropagnol, N. Thiré, T. Ozaki, R. Morandotti, D. G. Cooke, and F. Légaré, Appl. Phys. Lett. 105, 241106 (2014).
26
Chapter 3
Resonant Harmonic Generation from the Dressed Autoionizing
States of Sn
+Summary
In this chapter, we study properties of the RH of tin with mid-IR tunable driving laser pulses. These tunable pulses are used to investigate the physical phenomenon involved in RH generation. We have found that when harmonics from tin are driven with the mid-IR pulses, the RH of tin is a combination of two harmonics known as the RH, that is generated from the AIS, and the non-resonant harmonic, generated due to the normal three-step process. Further, we have observed that the RH’s emission is bound within the linewidth of the AIS, whereas, the frequency of the non-resonant harmonic depends on the central wavelength of the driving laser pulses. The non-resonant harmonic is separated from the RH by carefully detuning the driving laser wavelength. This wavelength tuning exposes a new feature of the AIS of Sn+. We have found for the first time that the AIS of Sn+ responds like a dressed AIS, and two coherent satellite harmonics from the dressed states are generated around the RH. The contribution of the dressed AIS in HHG is confirmed by solving the TDSE with different driving laser wavelengths.
3.1 Introduction
HHG process is explained with the semi-classical three-step model [1]. Complete details of this three-step model are described in chapter 1 (section 1.4). In this model, it is assumed that only ground state electron contributes in HHG and perturbation of atomic and ionic resonances is ignored [1,2]. The high-order harmonic spectrum, shown in Fig. 1.3 (chapter 1), indicates that harmonic plateau consists of a series of harmonics having similar intensity. In 2006, Ganeev et al. [3] first observed that in harmonics from In+, intensity of a single harmonic in the plateau is increased. This intense single harmonic is named RH, and intensity of this RH has been observed to be about two orders of magnitude higher than the intensity of neighboring harmonic, generated with the conventional three-step process [3]. The reason behind this intensity enhancement of RH was attributed to the continuum AIS perturbing the RH intensity [3]. After that this RH has been observed in several laser-ablated media, used for HHG [4–6].
27
These RHs are the promising source for developing intense XUV pulses. These intense, monochromatic and narrow bandwidth XUV pulses are useful for many applications, e.g., for the spectroscopy of highly charged ions [7] and the coherent diffractive imaging of nanoscale objects [8]. Also, it has been expected that these RHs might be used to produce an intense attosecond light source, by combining several resonant harmonics together [4,9].
The experimental studies of this RH generation have lacked the complete information about the physical phenomenon involved. This is because the properties of these RHs have been explored mainly to increase their photon flux [6,10,11]. Limited experiments have been performed to understand the RH generation mechanism and results of these experiments have shown that the RH intensity depends strongly on the ellipticity of the driving laser [6] and also RH follows phase matching conditions similar to other harmonics, generated with the three-step process
[12].
Several theoretical models have been proposed to explain the mechanism of harmonic intensity enhancement in RH. For example, Faria et al. [13] proposed that this resonant enhancement might be due to the bound-bound transitions of an electron. However, bound-bound transition alone cannot explain the experimentally observed ellipticity dependence of the RH [5]. To allow ellipticity dependence in their models, other theories that consider the acceleration of the electron and the bound-bound transition have been introduced [9,14–16]. A theoretical model that has been compared with experimental observations is the four-step model, proposed by Strelkov [9]. In this model, steps 1 and 2 are the same as for the three-step model. However, in step 3, the electron accelerated in the continuum is trapped by the parent ion, so that the system lands in the AIS, and in step 4 the AIS relaxes to the ground state by emitting the harmonic photon. Experimentally observed intensity enhancements of RH have been compared with theory for several materials, and the relative phase between RH and non-RH have been experimentally measured and compared with theory [9]. However, intensity and phase measurements of the harmonics are still indirect evidence of the four-step model [17], and thus there currently lacks direct and concrete evidence that the AIS is involved in RH generation.
28
3.2 High-order Harmonic Generation from Sn
+We use long-wavelengths tunable driving laser pulses (1.75 ~ 1.90 µm) to expose the physical mechanism involved in RH generation. Experimental details are described in the Chapter 2. In short, long-wavelength lasers are used to reduce the enhancement effect of the RH, compared to 0.8 µm laser pulses where RH intensity is very high. Sn+ is used for these investigations, as Sn+ contains a strong resonance at energy ~26.3 eV. The high-order harmonic spectrum observed with 1.84 µm driving lasers is shown in Fig. 3.1.
Figure 3.1: High-order harmonic spectrum of Sn+ at 1.84 µm driving laser wavelength, showing that the RH and the non-resonant harmonic are overlapped with each other. This spectrum is recorded at laser intensity of ~1.43×10¹⁴ Wcm-2.
Fig. 3.1 shows the high-order harmonic spectrum from tin plume with 1.84 µm driving laser
wavelength. This wavelength is selected, as RH is only observable when driving laser wavelength is centered at exact or nearly exact multi-photon resonance with the atomic or ionic transition [5,6]. The driving laser pulses, centered at 1.84 µm wavelength are exactly 39-photon resonant with the 4d95s25p2 → 4d105s25p transition, and thus the RH of significant intensity is observed even at this high-order multiphoton interaction.
This figure also shows that around energies of 26 eV, there are actually two harmonics closely overlapped to each other. The harmonic with the higher intensity is the RH, and the other is the 39th order non-resonant harmonic from Sn+. This non-resonant harmonic is generated due to the conventional three-step model, where the electrons in the continuum recombine to the ground state of Sn+. This is in contrast to past works, which have shown that the intense RH always dominates over the much weaker non-resonant harmonic. One reason is because most of the
29
experimental studies on RH in the past have used driving lasers at 0.8 µm wavelength. At this laser wavelength, the intensity of the RH from Sn+ is ~ 20 times higher than that of the non-resonant harmonic intensity [5], which makes it very difficult to distinguish the much weaker non-resonant harmonic from the RH. However, when 1.84 µm wavelength driving laser is used to generate tin harmonics, the intensity enhancement of the RH is reduced, and its intensity is observed to be only ~ 6 times higher than that of neighboring non-resonant harmonics. Therefore, the use of a long-wavelength driving laser allows one to identify this non-resonant harmonic alongside the RH. The presence of the non-resonant harmonic at the resonant energy level was actually theoretically predicted by Strelkov et al. [18], but no experimental signature has been revealed in the past. Therefore, our experimental observation confirms the theoretical model proposed by Strelkov, where he explains that the RH is the result of a single electron response, and the actual harmonic is a combination of the RH and the non-resonant harmonic
[9,18].
Another interesting feature observed in this spectrum is that the divergence of the RH and the non-resonant harmonic is different. The divergence of the RH is observed to be smaller than the non-resonant harmonics. This different divergence of the RH and the non-resonant harmonic also helps to differentiate the non-resonant harmonic from the RH. The reason for this difference in the divergence of the two harmonics could be explained by phase matching conditions. For the non-resonant harmonics, it is the dynamics of the free electrons accelerated in the continuum that determines the wavelength shift of the harmonics. In this case, the short trajectory results in well-collimated harmonics located at the core frequencies of the harmonics, while the long trajectory results in spectrally shifted harmonics that are better phase matched off axis [19]. On the other hand, in the case of RH, the most intense harmonic emission is locked at the resonant wavelength of the strong radiative transition. Therefore, when the driving laser wavelength is in exact multiphoton resonance with the resonant wavelength, the RH is better phase matched, and the resonance forces the harmonics to be emitted at the core harmonic frequency [20], thus favoring harmonics with small divergence.
30
3.2.1 Resonant-Harmonic Response within the Driving Laser
Bandwidth
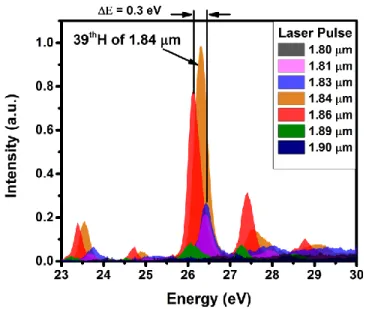
As the driving lasers used for RH generation are broadband, the RH responds within a certain bandwidth of these laser pulses [5,17]. The RH intensity is higher when the central wavelength of the driving laser is tuned at the exact multiphoton resonance. The intensity of the RH decreases rapidly as the central wavelength is tuned away from the resonant wavelength. In our case, at laser wavelength centered at 1.84 µm, the driving laser bandwidth is ~100 nm. RH response at laser wavelength from 1.80 µm to 1.90 µm is investigated and results are shown in the figure below.
Fig. 3.2: The RH response at different driving laser wavelengths ranging from 1.80 µm to 1.90 µm. Maximum harmonic intensity is observed at 1.84 µm, as this wavelength is exactly 39-photon resonant with the 4d105s25p → 4d95s25p2 transition of Sn+, and then decreases rapidly as the driving laser wavelength is detuned. The RH disappears completely when the driving laser wavelengths are tuned at 1.80 µm and 1.90 µm. The driving laser intensity for these spectra is maintained at ~1.3 ×10¹⁴ Wcm-2.
Fig. 3.2 shows the high-order harmonic spectra from tin plume around the resonance, when the
central wavelength of the driving laser is varied from 1.80 µm to 1.90 µm. High RH intensity is observed at wavelength ~1.84 µm, as this wavelength is exactly 39-photon resonant with the 26.3 eV radiative transition of Sn+. The RH intensity decreases as we increase the detuning of the driving laser wavelength from this resonance. Only weak RH is observed at laser wavelengths of
31
1.81 µm and 1.89 µm, which disappears completely at 1.80 µm and 1.90 µm wavelengths. Therefore, these results show that when using driving lasers of ~100 nm bandwidth, the RH of Sn+ responds well for at least ±30 nm of bandwidth, around the resonant wavelength of ~1.84 µm. A small energy shift of 0.3 eV is also observed in the RH when the driving laser is tuned from 1.83 µm to 1.86 µm.
As the wavelength of the RH is locked within the linewidth of the AIS, and this harmonic responds at least at 60% of the laser bandwidth, the non-resonant harmonics, which are generated due to the normal three-step process, are separated from the RH. This is done by carefully detuning the driving laser wavelength of the OPA, whose results are presented in Fig. 3.3.
Figure 3.3: (a) High-order harmonic spectra of Sn+ using a driving laser with 1.75 µm central wavelength, showing that the RH and the non-resonant harmonic are overlapped at 26.3 eV. (b) High-order harmonic spectrum of Sn+ using a driving laser with 1.785 µm central wavelength. This spectrum indicates that the RH and the non-resonant harmonic can be separated by detuning the driving laser wavelength. In this spectrum two additional coherent harmonics are observed at ±2Ω around the RH, which are generated from the dressed AIS. The laser intensity of both spectra is maintained at ~1.4×10¹⁴ Wcm-2.
![Figure 1.1: Plasma evolution at different time scales of laser pulse interaction [19]](https://thumb-eu.123doks.com/thumbv2/123doknet/5006243.125000/16.918.221.695.322.648/figure-plasma-evolution-different-scales-laser-pulse-interaction.webp)


![Figure 1.6: Harmonic flux variation as a function of medium length [32].](https://thumb-eu.123doks.com/thumbv2/123doknet/5006243.125000/27.918.259.655.289.606/figure-harmonic-flux-variation-function-medium-length.webp)