18F9 (4-(3,6-bis (ethoxycarbonyl)-4,5,6,7-tetrahydrothieno (2,3-c)
pyridin-2-ylamino)-4-oxobutanoic acid) enhances insulin-mediated
glucose uptake in vitro and exhibits antidiabetic activity in vivo
in db/db mice
Rathinasabapathy Anandharajan, Sufyan G. Sayyed, Lalit S. Doshi, Pooja Dixit,
Prakash G. Chandak, Amol V. Dixit, Manoja K. Brahma, Nitin J. Deshmukh,
Ravindra Gupte, Anagha Damre, Jaspreet Suthar, Muralidhara Padigaru,
Somesh D. Sharma, Kumar V.S. Nemmani
⁎
Department of Pharmacology, Piramal Life Sciences Limited, Goregaon (E), Mumbai–400 063, India Received 26 November 2008; accepted 20 April 2009
Abstract
Insulin resistance is central to the pathogenesis of type 2 diabetes mellitus. Previous studies have demonstrated that compounds that cause adipogenesis and improve glucose uptake in 3T3-L1 cells are potential insulin sensitizers. Therefore, we evaluated one such compound, 18F9, for (1) adipogenesis in human subcutaneous preadipocyte (SQ) cells, (2) glucose uptake in human skeletal muscle myotubes and SQ cells, and (3) antidiabetic activity in db/db mice. We also investigated its effect on ex vivo glucose uptake in soleus muscle isolated from continuously treated db/db mice. Gene expression profiling in soleus muscle and epididymal fat of db/db mice was performed to understand its effect on glucose metabolism, lipid metabolism, and thermogenesis. 18F9 enhanced adipogenesis in SQ cells and increased glucose uptake in SQ and human skeletal muscle myotubes cells. In db/db mice, 18F9 exhibited dose-dependent reduction in plasma glucose and insulin level. Interestingly, 18F9 was as efficacious as rosiglitazone but did not cause body weight gain and hepatic adverse effects. In addition, 18F9 demonstrated no change in plasma volume in Wistar rats. Furthermore, it enhanced ex vivo glucose uptake in soleus muscles in these mice, which substantiates our in vitro findings. Human peroxisome proliferator activated receptor–γ transactivation assay revealed a weak peroxisome proliferator activated receptor–γ transactivation potential (44% of rosiglitazone at 10 μmol/L) of 18F9. Gene expression profiling indicated that 18F9 increased insulin sensitivity mainly through a phosphoinositide 3-kinase–dependent mechanism. 18F9 also up-regulated genes involved in lipid transport and synthesis at par with rosiglitazone. Unlike rosiglitazone, 18F9 elevated the expression of Pdk4. In addition, 18F9 elevated the expression of glycogen synthase and adiponectin significantly higher than rosiglitazone. Taken together, these observations suggest that 18F9 is a safer and potent insulin sensitizer that demonstrates promising antidiabetic activity and is worth further development. © 2009 Elsevier Inc. All rights reserved.
1. Introduction
Insulin resistance in peripheral tissues, namely, liver, skeletal muscle, and adipose tissue, plays a pivotal role in the pathogenesis of type 2 diabetes mellitus. Insulin resistance in association with hyperglycemia and dyslipidemia is mainly responsible for the early onset of cardiovascular disorder,
hypertension, and coronary artery disease[1,2]. Therefore, amelioration of insulin resistance is an effective way not only to treat type 2 diabetes mellitus but also to prevent development of further complication. Among the currently available pharmacologic agents, thiazolidinediones (TZDs) are one of the widely used drugs to treat insulin resistance. However, these agents are associated with adverse effects like plasma volume expansion, anemia, edema, weight gain, and hepatic failure[3]. Hence, efforts are being directed toward the development of insulin sensitizers, which are devoid of such adverse effects. Recently, a non-TZD compound, 18F9, has been reported to enhance adipogenesis and increase
Metabolism Clinical and Experimental 58 (2009) 1503–1516
www.metabolismjournal.com
⁎ Corresponding author. Tel.: +91 22 3081 8404; fax: +91 22 3081 8411.
E-mail address:[email protected](K.V.S. Nemmani). 0026-0495/$– see front matter © 2009 Elsevier Inc. All rights reserved. doi:10.1016/j.metabol.2009.04.036
glucose uptake in 3T3-L1 cells[4], suggesting it might be an insulin sensitizer.
Adipogenesis of human subcutaneous preadipocytes (SQs) and insulin-mediated glucose uptake in differentiated human adipocytes and myotubes have been used to study insulin sensitizers[5-7]. In the present study, we evaluated 18F9 for its adipogenicity and glucose uptake in human SQ cells. We also studied its effect on glucose uptake in human myotubes. Our results demonstrate that 18F9 caused adipogenesis in human SQ cells along with increased insulin-mediated glucose uptake in human SQ and human skeletal muscle myoblasts/myotubes (HSMM) cells. Sub-sequent to these in vitro findings, we investigated 18F9 for its antidiabetic activity in diabetic (db/db) mice. 18F9 exhibited reduction in plasma glucose and insulin compar-able with rosiglitazone. Interestingly, 18F9 did not show significant body weight gain or hepatic adverse effects. In addition, a 28-day repeated-dose study in normal Wistar rats indicated that 18F9 did not cause an increase in plasma volume or heart weight.
In agreement with the fact that skeletal muscle accounts for approximately 80% of glucose utilization, we performed ex vivo–based glucose uptake study in soleus muscle isolated from continuously treated db/db mice. 18F9 exhibited significant ex vivo insulin sensitization in soleus muscle, similar to that of rosiglitazone, in addition to its effect on cultured human adipocytes and myotubes. To understand its molecular mechanism, we attempted to elucidate the gene expression profile of 18F9 in diabetic soleus muscle and epididymal fat. Accordingly, we studied an array of genes involved in glucose transport and disposal; lipid transport, synthesis, and oxidation; and thermogenesis. 18F9 preferentially up-regulated key genes involved in glucose homeostasis, lipid metabolism, and thermogenesis in soleus muscle in addition to increased adiponectin expres-sion in epididymal fat. On the basis of the above results, we conclude that 18F9 appears to be a safe and effective insulin sensitizer, which improves glucose metabolism, lipid metabolism, and thermogenesis.
2. Materials and methods 2.1. Reagents and chemicals
18F9 (4-(3,6-bis (ethoxycarbonyl)-4,5,6,7-tetrahy-drothieno (2,3-c) pyridin-2-ylamino)-4-oxobutanoic acid; molecular weight, 399.98) was synthesized at the Piramal Healthcare, Ennore. Of the 10 000 diverse compounds library screened by Choi et al [4], 4 compounds—92D8,
99D5, 18F9, and 124D8—exhibited insulin-sensitizing activity stronger than pioglitazone at 10μmol/L. According to Choi et al, 124D8 was the best among the 4 compounds. However, in preliminary studies in our laboratory, 18F9 exhibited better activity as compared with 124D8; hence, it was selected for further studies. Rosiglitazone was synthesized in-house at the Department of Chemistry,
Piramal Life Sciences, Mumbai. Human SQ cells, pre-adipocyte medium (PM-1), differentiation medium (DM2), adipocyte medium (AM1), and basal medium required for SQ cells were obtained from Zenbio, Research Triangle Park, NC. The HSMM cells, skeletal muscle growth medium (SkGM2), skeletal muscle basal medium (SkBM2), and fusion medium (Dulbecco modified Eagle medium; F12, 1:1) required for HSMM and the AdipoRed assay reagent required for adipocyte staining were obtained from Lonza, Basel, Switzerland. Ninety-six–well white plate required for fluorimetry reading (adipocyte staining) and other tissue culture plastic wares were procured from Nalgene, Rochester, NY. Tissue culture grade trypsin, EDTA, dimethylsulfoxide, human insulin, HEPES, bovine serum albumin (radioimmunoassay [RIA] grade), Bradford reagent, chloroform, and sodium pyruvate buffer were obtained from Sigma (St Louis, MO). Glucose, triglyceride (TG), cholesterol, aspartate transaminase (AST), and alanine transaminase (ALT) kits were procured from DiaSys, Holzheim, Germany. Enzyme-linked immunosor-bent assay kits for mouse insulin were obtained from Linco Research, St. Charles, MO; and isoflurane was from Piramal Health Care, Mumbai. 2-Deoxy-D-[3H] glucose
and 2-deoxy-D-[14C]-glucose were procured from
Amer-sham Biosciences. TRIzol, Oligo(dT), dNTPs, reverse transcriptase, dithiothreitol, RNaseOUT, and 5× strand buffer were procured from Invitrogen (Carlsbad, CA). Primer3 software and Genome browser were used to design all the oligonucleotide primers (Table 1) synthesized by Sigma, Bangalore, India. RNeasy mini kit was from Qiagen (Hilden, Germany). QuantiFast SYBR Green Master Mix for real-time polymerase chain reaction (PCR) was procured from Qiagen. All other chemicals were procured from Sigma.
2.2. Cell culture
Subcutaneous preadipocyte and HSMM cells were cultured and grown as per supplier's protocol. In brief, SQ cells were grown in PM-1 in T75culture flask. A total of 4 ×
104/cm2SQ cells were plated in 24-well plate and in 96-well white plate in PM-1. Preadipose SQ cells were fed with DM2 after confluence. Peroxisome proliferator activated receptor–γ (PPARγ) agonist in DM2 was replaced by rosiglitazone or 18F9 for 6 days. After the differentiation, cells were maintained in AM1 until the day of experiment. All the cells were replenished with the respective medium on alternative days. On day 11, the rate of adipogenesis was measured using fluorimetry. In the gene expression study, cells were lysed in TRIzol for RNA extraction after 4 days of treatment. For glucose uptake study in human SQ cells, they were maintained in AM1 until day 17. For glucose uptake in HSMM, cells were grown in SkGM2 in T75culture flask; 4 ×
104/cm2 HSMM cells were plated in 24-well plate in SkGM2. On subconfluence, differentiation was initiated by the addition of fusion medium supplemented with 2% horse serum for 5 days. More than 90% of cells were converted
into multinucleated (4-10 nuclei) myotubes. Myotubes were maintained in SkGM2 until the initiation of glucose uptake study. Both SQ and HSMM cells were grown at 37°C humidified with 5% CO2.
2.3. Animals
Female Wistar rats (6 weeks of age), male db/db and C57BL/6J mice (7-9 weeks of age) were procured from the central animal facility, Piramal Life Sciences Limited, Mumbai. Animals were housed in individually ventilated cages at a room temperature of 22°C ± 2°C, humidity at 55% ± 5%, with a 12:12-hour light-dark cycle and throughout the study period had access to water and standard chow ad libitum. The guidelines of the Committee for the Purpose of Control and Supervision of Experiments on Animals, Government of India, were followed; and the in-house animal ethics committee approved all experimental procedures. 2.4. Pharmacokinetic studies
Overnight-fasted (16 hours) db/db mice weighing 30 to 40 g were randomized into 4 groups (n = 4). 18F9 (30, 50, and 100 mg/kg) or vehicle (0.5% carboxymethylcellulose [CMC]) was administered orally, and 50 μL blood was withdrawn from retroorbital sinus under isoflurane anesthe-sia at different time intervals. Plasma was separated by centrifugation at 6000g for 7 minutes at 4°C. Plasma level of 18F9 was determined by a high-performance liquid chromatographic (HPLC) method developed in-house. Briefly, the chromatographic system consisted of a
Thermo-Finnigan Surveyor LC pump with a photodiode array detector (Thermo Electron, San Jose, CA). Compound was separated at 40°C on a Thermo BDS Hypersil C18 column of 250 × 4.6 mm internal diameter and particle size of 5μm. The mobile phase composed of 2 solvents—solvent a: 100% HPLC-grade acetonitrile; solvent B: 0.01 mol/L ammonium acetate containing 0.5% vol/vol triethylamine, pH adjusted to 2.5 with orthophosphoric acid. The mobile phase was run at a flow rate of 1 mL/min using the following gradient program (time [minutes]/percentage solvent A): 0/ 20, 20/80, 20.01/20, and 25/20. Absorbance was measured at 312 nm. Unknown concentrations of 18F9 in the plasma samples were determined using a calibration curve in mouse plasma at concentrations ranging from 1 to 500 μg/mL. A linear relationship for 18F9 (r2= 0.999) was obtained when peak areas were plotted against plasma concentration. Coefficients of variation were always lower than 10%, whereas accuracy ranged from 90% to 110%.
2.5. Biochemical estimation
Blood was collected from the retroorbital sinus of db/db mice after 4-hour fasting under isoflurane anesthesia (3% isoflurane anesthesia in O2 using anesthesia apparatus
[SurgiVet; Smiths Medical, Waukesha, WI]). Plasma was separated by centrifugation at 6000g at 4°C for 7 minutes; and glucose, TG, cholesterol, and liver enzymes AST and ALT levels were estimated immediately using a biochemistry autoanalyzer (Hitachi Science Systems Limited, Ibaraki, Japan). Plasma insulin was estimated using enzyme-linked
Table 1
Primers and probes used for real-time PCR
Assay Forward primer Reverse primer Accession no.
Glut1 CCTATGGCCAAGGACACACT GGGCGAATCCTAAAATGGAG NM_011400
Glut4 GACGGACACTCCATCTGTTG CTCAAAGAAGGCCACAAAGC NM_009204
Glut12 CATCGCTGGCTTTTGTTGT TGGCACTAATTCTTCCTGGTG NM_178934
Hk2 CAAGATAAGAGAGAACCGTGGA GAAGGACACGTCACATTTCG NM_013820
Rab5a TGGAGACATCAGCTAAGACATCA GCTGTGCAGGCTCAGTAAGG NM_025887
Cap2 TGCACTAGACTGTGAGATCGTG ATCTCTGCAGGTTCGGTGAC NM_026056
Gys1 AAGGCCTTTCCAGACCACTT TTCCTCATCCTCACTCTGGTG NM_030678
Lcb1 GATAAGGGCATCGCATTGAC GCCTCCCTGATGGTGGAT NM_009269
Lcb2 TGGTGTAGTTGTGGTGGGATT ACTTTAGCTGCAGCAGATCC NM_011479
Fasn GCACCTATGGCGAGGACTT ATGGATGATGTTGATGATGGA NM_007988
Thiolase1 AATTCCTGCAGAGAAGGTGAA ATGGACACCACGCCGTAAG NM_130864
Thiolase2 GTCAGGCCGTCTACTGTGTG GGCGCTTCAGTTCATTGAGT NM_146230
Hmgcs2 AGACGCATGTCCCCTGAG TGCATCTCATCCACTCGTTC NM_008256
Dgat1 GTTCCCCTGCGGATGTTC ACCGGTTGCCCAATGATG NM_010046
CD36 TCTGAAGAGACCTTACATTGTACCTA CAATCCCAAGTAAGGCCATC NM_007643
Fabp3 GGACGGAGGCAAACTCATC ACGCCTCCTTCTCATAAGTCC NM_010174
Fabp4 ACGACAGGAAGGTGAAGAGC ACACATTCCACCACCAGCTT NM_024406
mCpt-1 CATGATCGCAGGAGAAAACA TCAGCTGTCTGTCTTGGAAA NM_009948
Acc2 ATCAATTATCTGAAGCGGGACT AGCAGCTGAGCCACCTGTAT NM_133904
Acox1 CTTTAAGGATGTGACCCTTGG GACTGCAGGGGCTTCAAGT NM_015729
Pdk4 GGAGATCTGAATCTCTACTCTATGTCA CAGCTTCGGAGCTCATCTG NM_013743
Adiponectin CAGGACATCCTGGCCACA CCCTTCAGCTCCTGTCATTC NM_009605
Ucp2 ACTGTGCCCTTACCATGCTC GCAGCCATTAGGGCTCTTTT NM_011671
Ucp3 CCTCTGCACTGTATGCTGAA ATTAAGGCCCTCTTCAGTTGC NM_009464
immunosorbent assay kit (Linco Research) as per manufac-turer's protocol.
3. Experiments
In all our experiments, rosiglitazone was used as a standard insulin sensitizer for comparison.
3.1. Study 1: effect of 18F9 on adipogenesis in human preadipose SQ cells
To measure the effect of 18F9 on accumulation of intracellular TG (marker of adipocyte differentiation), we performed Nile red–based staining [8]. Cultured preadipo-cytes on confluence were induced to differentiate in the presence of 18F9 (1, 10, and 100μmol/L) and rosiglitazone (1 μmol/L) in 96-well white plate. In an earlier study, rosiglitazone caused dose-dependent adipogenesis with max-imum effect at 1μmol/L (data not shown). Therefore, we used 1μmol/L of rosiglitazone for all of our adipogenesis studies. After 11 days, cells were washed in phosphate-buffered saline (PBS) at room temperature. Cells were then treated with 5μL of AdipoRed assay reagent in 200μL of PBS per well and incubated at room temperature for 10 minutes. After incubation, fluorescence was measured using high-through-put screening fluorimetry analyzer (Tecan-Safire, Durham, NC) with excitation at 485 nm and emission at 572 nm. 3.2. Study 2: effect of 18F9 on adipogenic markers in human preadipose SQ cells
To assess the gene expression profile of 18F9 in adipogenesis, we tested its effect on differentiation of human SQ preadipocytes. Cultured preadipocytes on con-fluence were induced to differentiate in the presence of 18F9 (1, 10, and 100μmol/L) and rosiglitazone (1 μmol/L). After 4 days of treatment, cells were washed with PBS and lysed in TRIzol for RNA extraction. RNA was extracted from cell lysate using RNeasy mini kit (Qiagen). Chloroform was added to the cell lysate to separate out the protein, washed with 70% alcohol, and then applied to RNeasy spin column; and the subsequent steps were followed as per the supplier's instruction. RNA was eluted in RNase/DNase free water stored at −80°C in aliquots. The extracted total RNA was run on a 3-(N-morpholino)propanesulfonic acid (MOPS)/ formaldehyde gel and quantified by using ND-1000 spectro-photometer (Thermo Scientific NanoDrop, Wilmington, DE). For complementary DNA (cDNA) conversion, 2 μg of total RNA was treated with 50 μL Oligo(dT) and 10 mmol/L dNTPs and heated at 65°C for 5 minutes followed by an ice incubation for 1 minutes. Total RNA was then reverse transcribed to cDNA using 200 U of Superscript III in the presence of 5× first-strand buffer, 0.1 mol/L dithiothreitol, and 40 U of RNase inhibitor and incubated at 50°C for 60 minutes followed by heat inactivation at 70°C for 15 minutes. The list of primers used to amplify the corresponding gene is shown in theTable 1. Real-time PCR
was carried out by the amplification of samples in 96-well plates using Epgradient S, Realplex4Mastercycler System, and fluorescent dye SYBR green (Eppendorf, Hamburg, Germany) following the manufacturer's protocol. Amplifi-cation was carried out by initial denaturation at 95°C for 5 minutes followed by 40 cycles of 95°C for 10 seconds and 60°C for 30 seconds. All gene expressions were normalized withβ-tubulin, which served as an internal control to check the quality of RNA. Data were analyzed using the Realplex software (version 1.5, Eppendorf). The relative expression of each gene was calculated using comparative Ct method with the formula 2−ΔΔCt (where ΔΔCt = ΔCt sample − ΔCt reference), where Ct is the number of cycles required to reach the threshold.
3.3. Study 3: effect of 18F9 on glucose uptake in human SQ cells
To evaluate the effect of 18F9 on glucose uptake in human SQ cells, 2-deoxy-D-[14C]-glucose uptake was
measured. After differentiation, adipocytes were incubated in AM1 until day 17. These cells were then maintained in basal medium supplemented with 3% fetal calf serum for another 3 days. Our preliminary studies revealed that rosiglitazone caused a concentration-dependent (1, 10, and 100 μmol/L) stimulation of glucose uptake both in the presence and in the absence of insulin. On day 20, cells were incubated in the presence of rosiglitazone (100μmol/L) or 18F9 (10 and 100μmol/L) supplemented with 0.5% fetal calf serum for 24 hours. Glucose uptake was initiated by switching over the adipocytes to Krebs-Ringer phosphate (KRPH) buffer (118 mmol/L NaCl, 4.8 mmol/L KCl, 1.3 mmol/L CaCl2, 1.2 mmol/L MgSO4, 1.2 mmol/L KH2PO4,
and 15 mmol/L HEPES). Cells were rinsed thoroughly in KRPH buffer twice and incubated in KRPH buffer with or without insulin (100 nmol/L) for 30 minutes. Afterward, the glucose uptake was monitored in the presence of 0.2μCi/mL 2-deoxy-D-[14C]-glucose (to the final concentration 100
μmol/L) for 30 minutes. The glucose uptake was terminated rapidly by washing the cells in ice-cold KRPH buffer thrice, and cells were lysed in 60 μL of 0.1% sodium dodecyl sulfate. Cell lysate was used to measure the radioactivity using liquid scintillation counter (Packard Biosciences, Shelton, CT). Glucose uptake measurements were carried out in triplicates.
3.4. Study 4: effect of 18F9 on glucose uptake in HSMM Effect of 18F9 on glucose uptake in HSMM was measured by 2-deoxy-D-[3H]-glucose uptake. After differ-entiation, glucose uptake was initiated by switching over the myotubes to SkBM2 (absence of nutrition factors). Our initial findings demonstrated that insulin caused a dose-dependent (0.01, 0.1, and 1μmol/L) stimulation of glucose uptake leading to a 2.0-fold increase over basal at the maximum concentration. A similar dose-response study for rosiglitazone (1, 10, and 100μmol/L) in the presence and
absence of insulin demonstrated a concentration-dependent glucose uptake in HSMM cells. After the preincubation of myotubes in 18F9 (10 and 100 μmol/L) and rosiglitazone (100 μmol/L) in SkBM2 for 24 hours, cells were rinsed thoroughly in KRPH buffer (150 mmol/L NaCl, 5 mmol/L KCl, 1.2 mmol/L CaCl2, 1.2 mmol/L MgSO4, 2.5 mmol/L
NaH2PO4, and 10 mmol/L HEPES) twice and incubated in
KRPH buffer with or without insulin (1μmol/L) for 1 hour. Afterward, the glucose uptake was monitored in the presence of 1.5 μCi/mL 2-deoxy-D-[3H]-glucose (final
concentration of 20μmol/L deoxyglucose) for 15 minutes. Glucose uptake was terminated rapidly by washing the cells in ice-cold KRPH thrice, and cells were lysed in 60μL of 0.1% sodium dodecyl sulfate. Cell lysate was used to measure the radioactivity using liquid scintillation counter (Packard). Glucose uptake measurements were carried out in triplicates.
3.5. Study 5: dose-dependent effect of 18F9 on plasma glucose and insulin in db/db mice
Male db/db mice were divided into 5 groups with similar body weight and plasma glucose (mean ± SEM) and treated with vehicle (0.5% CMC), rosiglitazone (5 mg/kg), or 18F9 (30, 50, and 100 mg/kg) orally twice a day for 10 days. On day 10, 1 hour after the last dose, blood was collected from the retroorbital sinus; plasma was separated; and biochem-ical estimations were performed as described earlier. 3.6. Study 6: effect of 18F9 on biochemical parameters in db/db and C57BL/6J mice
Male db/db and C57BL/6J mice were divided into 3 groups each with similar body weight and plasma glucose (mean ± SEM). Mice were treated with 0.5% CMC, rosiglitazone (5 mg/kg), or 18F9 (100 mg/kg) orally twice a day for 10 days. One hour after the last dose, on day 10, blood was collected from the retroorbital sinus; plasma was separated; and biochemical estimations were performed as described earlier. Immediately after blood sample collection, mice were killed; and soleus muscle was excised for ex vivo glucose uptake and gene expression study. From the same mice, epididymal fat was collected for gene expression study.
3.7. Study 7: effect of 18F9 on plasma volume and heart weight in normal rats
Plasma volume estimation was performed as described previously [9] with slight modification. Briefly, female Wistar rats were administered 18F9 (250 mg/kg) or rosiglitazone (40 mg/kg) once daily for 28 days. In this study, 18F9 was administered once daily in contrast to the twice a day dosing regimen followed in the efficacy study in mice because 18F9 demonstrated a longer elimination half-life (t1/2) of 3.36 hours in rats as compared with a t1/2of 0.74
hour in mice. On day 29, that is, after completing the 28-day treatment, animals were anesthetized; the jugular vein and
carotid artery were catheterized for dye injection and sample collection, respectively. Blood (0.5 mL) was collected for obtaining baseline plasma samples. Afterward, 0.5 mL of Evans blue solution in saline (2 mg/mL) was administered intravenously through the jugular vein. Five minutes later, 0.5 mL of blood was collected to measure Evans blue concentration in the plasma. Plasma Evans blue concentra-tions were determined according to a standard curve generated by a serial dilution of Evans blue saline solution (2 mg/mL). Plasma volume was calculated using the dilution factors of Evans blue.
3.8. Study 8: effect of 18F9 on glucose uptake in soleus muscle (ex vivo)
In a separate study, intact soleus muscles were rapidly dissected from mice continuously treated with rosiglitazone (5 mg/kg, bid) and 18F9 (100 mg/kg, bid) for 10 days. Both ends of soleus muscle were tied with suture and mounted on the stainless steel clips to maintain consistent resting muscle length and tension. The tissue was then incubated at 35°C for 30 minutes in a shaking incubator in 2 mL of oxygenated Krebs-Henseleit buffer (KHB) (104 mmol/L NaCl, 4 mmol/L KCl, 1.1 mmol/L CaCl2, 1 mmol/L MgSO4, 1.2
mmol/L KH2PO4, 22 mmol/L NaHCO3, and 6.7 mmol/L
HEPES) supplemented with 8 mmol/L glucose, 32 mmol/L mannitol, and 0.1% RIA-grade bovine serum albumin (BSA) with or without insulin (100 nmol/L). All muscles were rinsed at 29°C for 10 minutes in 2 mL of KHB containing 40 mmol/L mannitol and 0.1% BSA (RIA grade), with or without 100 nmol/L insulin, to remove glucose from the extracellular space. After rinsing, muscles were incubated at 29°C for 20 minutes in 1 mL of KHB containing 0.2μCi/mL 2-deoxy-D-[14C]-glucose, 2 mmol/L sodium pyruvate, and
0.1% BSA, with or without recombinant human insulin (100 nmol/L). All incubations were performed in stoppered vials gassed with 5% CO2and 95% O2. Muscles were processed
by dissolving in 1 N NaOH at 65°C for 10 minutes and then further neutralized with 1 N HCl. Finally, homogenate was centrifuged at 2000g. An aliquot of the supernatant was added to the scintillation cocktail, and the radioactivity was measured. Furthermore, an aliquot was used for the protein estimation (Bradford method); and the radioactivity counts were normalized against total protein concentration, reported as counts per minute per milligram of protein.
3.9. Study 9: PPARγ transactivation study with 18F9 Cell-based transcription assay was used to identify PPARγ agonists as previously described [10,11]. CV-1 cells were maintained in modified Eagle medium containing 10% fetal bovine serum. Cells were seeded at a density of 80 000 cells per well in a 24-well plate 1 day before transfection. CV-1 cells were transiently transfected with expression vector (hPPAR-LBD fused to DBD of yeast transcription factor GAL4) and reporter vector (GAL4 response element and a reporter gene that codes for firefly
luciferase) using Lipofectamine 2000 (Invitrogen Inc.). Complementary DNA construct containing Renilla lucifer-ase was used as a control to check the efficiency of transfection. 18F9 (0.1-10 μmol/L) or the full PPARγ agonist rosiglitazone (1 μmol/L) was added 5 hours after transfection. Receptor activation by ligands leads to activation of luciferase expression, which was measured after 15 to 16 hours of incubation. The cells were washed with PBS and lysed, and luciferase activity was measured in a microplate luminometer. Luminescence measure based on the luciferase expression was normalized and expressed in terms of fold change relative to untreated cells.
3.10. Study 10: effect of 18F9 on gene expression profiling in soleus muscle and epididymal fat
The tissue samples were transferred to TRIzol reagent and homogenized using PRO homogenizer (PRO Scientific, Oxford, CT). RNA extraction and cDNA conversion from the tissue homogenate were performed as explained in study 2. The list of primers used to amplify the genes of interest is summarized inTable 1.
3.11. Statistical analysis
All the results including the gene expression study data are expressed as mean ± SEM. Statistical analysis was done using GraphPad Prism 4 (version 4.03; GraphPad Software, La Jolla, CA). Unpaired Student t test (2-tailed) was performed for statistical analysis of differences while comparing the mean values with respective group controls. For analysis of data of in vivo efficacy study, 1-way analysis of variance followed by Dunnett post hoc analysis was used.
4. Results
4.1. Effect of 18F9 on adipogenesis and adipogenic markers in human SQ cells
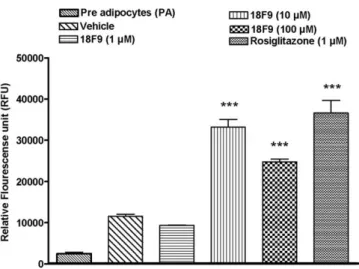
To investigate the effect of 18F9 and rosiglitazone on adipogenesis, we performed fluorescence-based Nile red staining (Fig. 1) and studied the gene expression profile of key adipogenic markers (FABP4, CD36, and adiponectin) by reverse transcriptase (RT)–PCR (Fig. 2). 18F9 enhanced adipogenesis at higher doses (10 and 100 μmol/L). The
Fig. 1. Effect of 18F9 on adipogenesis in human subcutaneous preadipose cells. Confluent human subcutaneous fibroblasts were treated with 18F9 (1, 10, and 100μmol/L) or rosiglitazone (1 μmol/L) for 6 days. Cells were maintained in AM1 until day 11. On day 11, cells were rinsed with PBS and stained with AdipoRed reagent; and fluorescence was measured with excitation at 485 nm and emission at 572 nm. Fluorescence was represented as relative fluorescence units. Data represent mean ± SEM (n = 3). ⁎⁎⁎Pb .001 vs vehicle group.
Fig. 2. Gene expression profiling of 18F9 in human SQs. Confluent human SQs were treated with 18F9 (1, 10, and 100μmol/L) or rosiglitazone (1 μmol/L). After 4 days of treatment, total RNA was isolated and reverse transcribed; and RT-PCR was performed as described in the methodology. All transcripts were normalized against the housekeeping geneβ-tubulin. Expression level of FABP4 (A), CD36 (B), and adiponectin (C) mRNA was plotted as relative fold change vs basal expression. Data represent mean ± SEM (n = 3). ⁎Pb.05, ⁎⁎P b.01, and ⁎⁎⁎P b.001 vs vehicle group;#Pb.05
maximum effect observed at 100μmol/L of 18F9 is at par with rosiglitazone (1 μmol/L). In addition, 18F9 exhibited dose-dependent (1, 10, and 100 μmol/L) up-regulation of the adipogenic markers. 18F9 and rosiglitazone demon-strated a significant up-regulation of FABP4, CD36, and adiponectin (Fig. 2A-C). Interestingly, 18F9 (100 μmol/L) elicited 1.4-fold higher expression of adiponectin gene over rosiglitazone (18F9 vs rosiglitazone: 11.2 ± 1.7 vs 8.4 ± 1.2, Pb .05,Fig. 2C).
4.2. Effect of 18F9 on glucose uptake in human SQ adipocytes
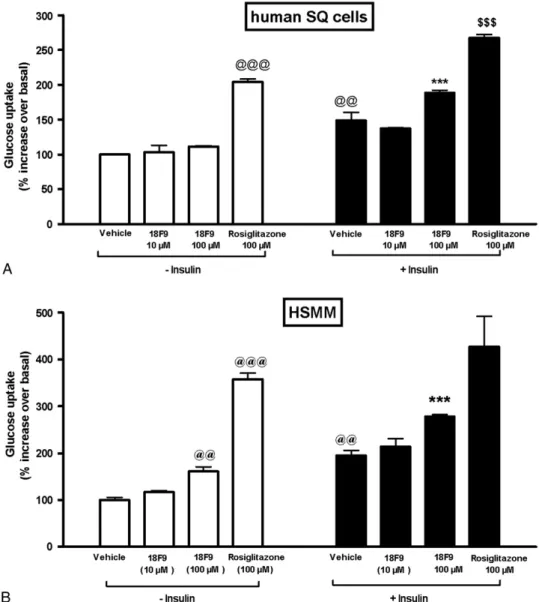
The effect of 18F9 and rosiglitazone on glucose uptake in human adipocytes was measured using 2-deoxy-D-[14
C]-glucose (Fig. 3A). Insulin stimulated glucose uptake by 1.5-fold over basal uptake at 100 nmol/L. 18F9 did not increase basal glucose uptake at both 10 and 100 μmol/L, but rosiglitazone (100μmol/L) caused a significant increase (2.0-fold) in basal glucose uptake (Fig. 3A). Interestingly, 18F9 at 100 μmol/L increased insulin-mediated glucose uptake sig-nificantly by 1.7-fold as compared with basal glucose uptake. In contrast, rosiglitazone at 100μmol/L showed insulin-mediated glucose uptake by 1.3-fold over basal glucose uptake.
4.3. Effect of 18F9 on glucose uptake in HSMM
The effect of 18F9 and rosiglitazone on glucose uptake in human myotubes was measured by 2-deoxy-D-[3H]-glucose
(Fig. 3B). Insulin stimulated glucose uptake by 2.0-fold over
Fig. 3. Effect of 18F9 on glucose uptake in human subcutaneous adipocytes and human myotubes. Differentiated cells (human SQ or HSMM) were incubated with 18F9 (10 or 100μmol/L), rosiglitazone (100 μmol/L), or 0.1% dimethylsulfoxide (vehicle) for 24 hours. Afterward, the cells were incubated with or without insulin as described in the methodology. A, Glucose uptake in human SQ adipocytes was monitored by the addition of 0.2μCi/mL of 2-deoxy-D-[14C]-glucose for 30 minutes. B, Glucose uptake in HSMM was monitored by the addition of 1.5μCi/mL of 2-deoxy-D-[3H]-glucose for 15 minutes. Data represent mean ±
SEM (n = 3). Glucose uptake is expressed as counts per minute per well.@@@Pb.001 and@@Pb.01 vs control group; ⁎⁎⁎P b.001 vs 18F9 basal uptake;$$$Pb
basal uptake at 1 μmol/L. 18F9 at 100 μmol/L caused a modest stimulation of basal glucose uptake by 1.6-fold, whereas rosiglitazone (100 μmol/L) caused a significant increase in basal glucose uptake by 3.6-fold (Fig. 3B). 18F9 elicited a significant increase in insulin-mediated glucose uptake by 1.7-fold as compared with basal glucose uptake. On the other hand, rosiglitazone at 100 μmol/L showed insulin-mediated glucose uptake by only 1.2-fold as compared with basal glucose uptake.
4.4. Pharmacokinetic profile of 18F9
Fig. 4 shows the time-dependent plasma concentration after oral administration of 30, 50, and 100 mg/kg of 18F9 in overnight-fasted db/db mice. Plasma level of 18F9 reached a maximum (Cmax) of 139, 397, and 748μmol/L in 15 minutes
and decreased thereafter. Thus, the plasma concentrations reached were significantly higher than those used for in vitro studies. Furthermore, the t1/2being 0.74 hour, a 100-mg/kg
(bid) dosing regimen was followed for in vivo studies in mice. 4.5. Dose-dependent effect of 18F9 on plasma glucose and insulin in db/db mice
The 18F9 and rosiglitazone groups exhibited a significant reduction in plasma glucose as compared with the control group (Fig. 5A). After 10 days of treatment, the 18F9 group displayed a marked glucose reduction of 28%, 46%, and 57% at 30, 50, and 100 mg/kg, respectively, whereas rosiglitazone at 5 mg/kg demonstrated a 44% reduction as compared with the control group. Plasma insulin was reduced in a dose-dependent manner in the 18F9-treated group (Fig. 5B). At 100 mg/kg, 18F9 demonstrated a plasma glucose and insulin reduction comparable with rosiglitazone, clearly supporting its in vivo insulin-sensitizing activity. 4.6. Effect of 18F9 on biochemical parameters in db/db and C57BL/6J mice
Table 2 shows the effect of 18F9 (100 mg/kg, po) and rosiglitazone (5 mg/kg, po) twice-daily treatment on body weight, liver weight, and other biochemical parameters in C57BL/6J and db/db mice. Although the plasma TG level of
the 18F9-treated group was reduced as compared with that of the control C57BL/6J mice, the effect was not reflected on body weight. Rosiglitazone-treated C57BL/6J mice also did not show change in biochemical parameters. However, in db/ db mice, 18F9 and rosiglitazone exhibited a significant reduction in plasma insulin levels as compared with the control group. Rosiglitazone induced a significant gain in body weight as compared with the control group. Notably, there was a small gain in weight of 18F9-treated mice, too; but the same was significantly (P b .05) lesser when compared with rosiglitazone group. Both 18F9 and rosigli-tazone caused significant reduction of plasma TG in db/db mice. Unlike rosiglitazone, 18F9 did not affect the plasma cholesterol. Rosiglitazone caused a significant increase in liver weight and liver toxicity marker enzymes ALT and AST by 2.1- and 2.8-fold, respectively, over control group, whereas 18F9 did not cause any change.
4.7. Effect of 18F9 on plasma volume and heart weight The effect of 18F9 or rosiglitazone treatment on cardiovascular parameters was assessed in a 28-day
Fig. 4. Pharmacokinetic profile of 18F9 in db/db mice. Overnight-fasted db/ db mice were administered 30, 50, and 100 mg/kg of 18F9 orally. Blood was drawn at periodic intervals, and plasma concentration of 18F9 was determined by HPLC. Data represent mean ± SEM (n = 4).
Fig. 5. Effect of 18F9 on plasma glucose and insulin in db/db mice. db/db mice were treated for 10 days (twice a day) with vehicle, 18F9 (30, 50, and 100 mg/kg), or rosiglitazone (5 mg/kg). Plasma glucose (A) and insulin (B) were measured after 10 days of treatment. Data represent mean ± SEM (n = 8). ⁎⁎⁎Pb .001 vs control group.
repeated-dose study in normal rats. Rosiglitazone (40 mg/ kg) treatment in rats produced a significant increase in plasma volume and heart weight (Table 3). On the other hand, 18F9 (250 mg/kg) did not cause any increase in plasma volume or heart weight. Besides, unlike rosiglita-zone, a 28-day treatment with 18F9 did not result in change in body weight when compared with vehicle-treated group (data not shown).
4.8. Effect of 18F9 on skeletal muscle glucose uptake (ex vivo)
The effect of 18F9 (100 mg/kg, po, bid) and rosiglitazone (5 mg/kg, po, bid) on ex vivo glucose uptake in soleus muscle isolated from db/db mice was measured after 10 days of treatment (Fig. 6). Interestingly, 18F9 had no effect on basal glucose uptake but significantly increased insulin-mediated glucose uptake (37%, P b .05). Conversely, rosiglitazone increased both basal (38%) and insulin-mediated glucose uptake (68%). 18F9- and rosiglitazone-treated animals demonstrated 1.7- and 1.5-fold increase in insulin-mediated glucose uptake over basal glucose uptake, suggesting that plasma glucose reduction is partly due to insulin sensitization in soleus muscle.
4.9. Effect of 18F9 on hPPARγ transactivation
To quantify PPARγ activation, we performed luciferase/ reporter-based hPPARγ transactivation assay in CV-1 cells. Both 18F9 and rosiglitazone showed dose-dependent stimulation of PPARγ activity as compared with basal activity in vehicle-treated cells. Relatively, 18F9 has a weak transactivation potential when compared with rosiglitazone. At 10μmol/L, rosiglitazone exhibited approximately 17-fold PPARγ activation, whereas 18F9 showed approximately 7-fold activation over basal (Fig. 7).
5. Gene expression profiling in soleus muscle 5.1. Glucose metabolism
Fig. 8A illustrates the effect of 18F9 on the modulation of key genes involved in glucose homoeostasis. 18F9 up-regulated Hk2 and Glut12 messenger RNA (mRNA), whereas rosiglitazone did not show any effect on them, when compared with the control group. Both 18F9 and rosiglitazone up-regulated the genes involved in insulin-mediated glucose uptake (Glut4 and Rab5a) and glucose disposal (Gys1) when compared with the control group (Fig. 8A). Glut4, Glut12, and Gys1 were better up-regulated (Pb .05) by 18F9 over rosiglitazone (18F9 vs rosiglitazone: Glut4, 2.4- vs 1.5-fold; Glut12, 1.8- vs 1.1-fold; Gys1, 2.3-vs 1.3-fold). On the other hand, rosiglitazone demonstrated significant increase in basal glucose transporter (Glut1), whereas 18F9 caused a modest up-regulation (Glut1, 18F9 vs rosiglitazone, 1.4 vs 2.0).
5.2. Lipid absorption, de novo lipid synthesis, and β-oxidation
Fig. 8B illustrates the expression of key genes underlying the molecular basis of lipid absorption, lipid synthesis, and lipid oxidation in soleus muscle after treatment with 18F9. Both 18F9 and rosiglitazone demonstrated their beneficial effects on intracellular lipid
Table 2
Effect of 18F9 (100 mg/kg, bid, po) or rosiglitazone (5 mg/kg, bid, po) on body weight, liver weight, and other biochemical parameters in C57BL/6J and db/db mice
Parameter C57BL/6J db/db mice
Control Rosiglitazone 18F9 Control Rosiglitazone 18F9
Body weight (g) 24.9 ± 0.5 24.3 ± 0.4 23.7 ± 0.4 35.7 ± 1.9 42.3 ± 0.7⁎ 38.0 ± 0.8† PGL (mg/dL) 187.8 ± 8.4 188.8 ± 9.3 195.5 ± 11.6 510.3 ± 24.1 286.1 ± 21.3⁎ 262.0 ± 19.8⁎ TG (mg/dL) 111.4 ± 14.3 142.8 ± 19.8 65.4 ± 2.7⁎ 102.4 ± 8.0 56.0 ± 3.9⁎ 66.4 ± 11.9⁎ CHL (mg/dL) 81.9 ± 6.4 100.8 ± 2.7 82.7 ± 8.4 107.7 ± 4.8 55.9 ± 3.0⁎ 111.4 ± 8.9 ALT (IU/L) 36.1 ± 5.3 59.3 ± 9.5 43.4 ± 7.5 25.1 ± 3.6 50.4 ± 5.0⁎ 21.4 ± 8.4 AST (IU/L) 99.5 ± 13.3 91.1 ± 14.5 82.8 ± 14.0 75.4 ± 10.6 208.0 ± 30.1⁎ 65.1 ± 29.1 Insulin (ng/mL) 0.8 ± 0.1 0.8 ± 0.1 0.7 ± 0.1 8.3 ± 1.0 2.5 ± 0.6⁎ 2.0 ± 0.3⁎
Liver weight (g/kg body weight) 39.4 ± 2.0 40.4 ± 1.2 40.6 ± 3.7 56.6 ± 2.4 63.6 ± 2.1⁎ 52.6 ± 1.8 Data shown as mean ± SEM of n = 8. PGL indicates plasma glucose levels; TG, triglycerides; CHL, cholesterol; ALT, alanine transaminase; AST, aspartate transaminase.
⁎ P b .05 vs control group.
† Pb .05 vs rosiglitazone group.
Table 3
Effect of 18F9 (250 mg/kg, od, po) or rosiglitazone (40 mg/kg, od, po) on plasma volume, body weight, heart weight, and biochemical parameters in 28-day study in rats
Parameters Control Rosiglitazone 18F9 Plasma volume (mL/kg) 29.0 ± 0.9 39.0 ± 1.4⁎ 29.8 ± 1.2 Body weight (% increase) 24.7 ± 2.8 38.6 ± 2.3⁎ 23.1 ± 1.0 Liver weight (g/kg body weight) 32.0 ± 1.5 35.3 ± 0.7 37.8 ± 1.3⁎ Heart weight (g/kg body weight) 3.0 ± 0.1 3.3 ± 0.1⁎ 3.0 ± 0.1 AST (IU/L) 70.2 ± 4.5 77.2 ± 11.7 72.0 ± 3.0 ALT (IU/L) 40.4 ± 2.6 41.6 ± 6.7 39.8 ± 3.3 Data shown as mean ± SEM of n = 8.
absorption by the up-regulation of Fabp4 and CD36, with Cpt1 being selectively enhanced by 18F9 (Fig. 8B). Transcripts of Lcb1 and Lcb2 involved in de novo fatty acid synthesis were unchanged in either treatment group (Fig. 8C), whereas Fasn was significantly up-regulated in both treatment groups. Fig. 8D illustrates that rosiglita-zone improved cholesterol synthesis and its esterification through up-regulation of Thiolase1 and 2. The key enzyme involved in the TG synthesis, Dgat1, was also
significantly elevated by 18F9 and rosiglitazone (Fig. 8C). Acc2 and Acox1 were also equally up-regulated by 18F9 and rosiglitazone as compared with control group (Fig. 8E). Interestingly, 18F9, but not rosiglitazone, elicited a significant up-regulation of Pdk4 as compared with control group (18F9 vs rosiglitazone: 1.7- vs 0.8-fold, P b .01).
5.3. Thermogenesis
To analyze the role of 18F9 in energy expenditure, Ucp2 and Ucp3 gene expression was studied. Both 18F9 and rosiglitazone caused a modest up-regulation of Ucp2 (Fig. 8F). Furthermore, 18F9 demonstrated a significant up-regulation of Ucp3 when compared with control group. Notably, in comparison with rosiglitazone, 18F9 showed a significant (Pb .05) up-regulation of Ucp3 (Fig. 8F). 6. Gene expression profiling in epididymal fat 6.1. Adipogenic markers
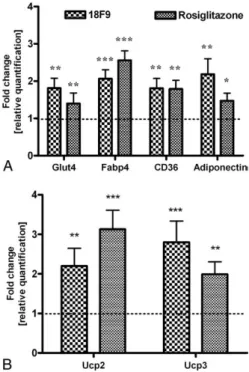
The effect of 18F9 on the expression of adipogenic markers (ie, Glut4, CD36, Fabp4, and adiponectin) in epididymal fat is illustrated inFig. 9A. CD36 and Fabp4 were equally up-regulated by 18F9 and rosiglitazone treatment (Fig. 9A). Interestingly, transcripts level of Glut4 and adiponectin were markedly up-regulated by 18F9, whereas rosiglitazone demonstrated a modest up-regulation for the same (Fig. 9A).
Fig. 6. Effect of 18F9 on glucose uptake in soleus muscle of db/db mice. db/db mice were treated orally (twice a day) with vehicle, 18F9 (100 mg/kg), or rosiglitazone (5 mg/kg). On day 10, 1 hour after the dose, mice were killed; and soleus muscle was excised and incubated for 30 minutes at 35°C in 2 mL KHB buffer supplemented with 8 mmol/L glucose, 32 mmol/L mannitol, and 0.1% RIA-grade BSA with and without 100 nmol/L insulin. All muscles were rinsed at 10-minute incubation at 29°C with 2 mL KHB containing 40 mmol/L mannitol and 0.1% BSA (RIA grade), with or without 100 nmol/L insulin, to remove extracellular glucose. This was followed by incubation with 0.2μCi/mL 2-deoxy-D-[14C]-glucose containing 2 mmol/L sodium pyruvate and 0.1% BSA, with or
without insulin 100 nmol/L, in 1 mL KHB at 29°C for 20 minutes. The tissues were homogenized and centrifuged, and radioactivity was measured using a scintillation counter. Results were normalized as counts per minute per milligram of soleus muscle protein. Data represent mean ± SEM (n = 7).@Pb .05 vs
control; ⁎Pb .05 vs 18F9 basal uptake;$Pb .05 vs rosiglitazone basal uptake.
Fig. 7. Activation of PPARγ by 18F9 and rosiglitazone. Induction of PPARγ mediated transactivation by 18F9 and rosiglitazone. CV-1 cells were cotransfected transiently with PPARγ1 expression vector, Gal4-PPARγ1-LBD, and pGL2 (Gal4 × 5)-SV40-Luc reporter construct. Transfected cells were treated with increasing concentrations of 18F9 and rosiglitazone, as mentioned in“Materials and methods.” Luminescence measured based on the luciferase expression was normalized and expressed in terms of fold change relative to untreated cells. Data represent mean ± SEM (n = 3).
6.2. Thermogenesis
As 18F9 up-regulated thermogenic marker genes in soleus muscle, it was of interest to examine the same in epididymal fat (Fig. 9B). Ucp2 was significantly up-regulated by both 18F9 and rosiglitazone. In addition, Ucp3 was also significantly up-regulated in both treatments.
7. Discussion
A recent study demonstrated that 18F9 exhibited enhanced adipogenesis and glucose uptake in 3T3-L1 cells, indicating its potential insulin-sensitizing activity[4]. In the present study, we further evaluated the insulin-sensitizing activity of 18F9 using human adipocytes, myotubes, and db/db mice. 18F9 enhanced insulin-mediated glucose uptake in human SQ and HSMM cells. These findings prompted us to explore the efficacy of 18F9 in vivo in db/db mice. Long-term treatment of db/db mice with 18F9 lowered plasma glucose and insulin level without significant gain in body weight and liver weight and increase in liver enzyme. Because skeletal muscle accounts for a major fraction of
glucose utilization, we further performed ex vivo–based soleus muscle glucose uptake study in continuously treated db/db mice. We found that 18F9 increased the insulin-mediated glucose uptake, whereas it did not alter the basal uptake in soleus muscle. To understand the molecular mechanism, we assessed its hPPARγ transactivation poten-tial in vitro and the gene expression profiling in epididymal fat and soleus muscle of continuously treated db/db mice. 18F9 exhibited a weak PPARγ activity and increased expression of genes involved in lipid synthesis, oxidation, and thermogenesis at par with rosiglitazone. Interestingly, 18F9 enhanced marked up-regulation of mRNA of key transporters of glucose uptake (Glut4 and Glut12), glucose disposal (Gys1), fat fuel utilization (Pdk4), and adiponectin expression when compared with rosiglitazone.
Although 18F9 has been reported to cause adipogenesis in 3T3-L1 preadipocyte[4], its effect on human preadipocyte is not known. Therefore, we studied the effect of 18F9 on human SQ preadipocytes. 18F9 enhanced adipogenesis at par with rosiglitazone at a concentration 100 times greater than rosiglitazone, suggesting its weak adipogenic potential. We found that 18F9 up-regulated the expression of FABP4,
Fig. 8. Gene expression profiling for 18F9 in soleus muscle in db/db mice. db/db mice were treated orally (twice a day) with 18F9 (100 mg/kg) or rosiglitazone (5 mg/kg). One hour after the last dose on day 10, animals were killed; and soleus muscle was excised. Total RNA was isolated and reverse transcribed, and RT-PCR was performed as described in methodology. All transcripts were normalized against the housekeeping geneβ-tubulin. Expression level of each gene was plotted as relative fold change over basal expression. Relative expression of genes involved in glucose metabolism (A), lipid absorption (B), lipogenesis (C), cholesterol synthesis and esterification (D),β-oxidation (E), and thermogenesis (F). Data represent mean ± SEM (n = 7). ⁎P b.05, ⁎⁎P b.01, and ⁎⁎⁎P b.001 vs control group;#Pb .05,##Pb .01, and###Pb .001 vs rosiglitazone group.
CD36, and adiponectin, supporting its insulin-sensitizing action. A similar increase in adipogenic markers was also observed in epididymal fat of db/db mice treated with 18F9. In this study, rosiglitazone also enhanced adipogenesis and expression of all key adipogenic markers, which is in line with similar findings using TZDs in 3T3-L1 preadipocytes
[12,13]. Thiazolidinediones have been reported to cause an increase in basal glucose uptake in 3T3-L1 adipocytes and human myotubes[4,14,15]. In agreement with these reports, rosiglitazone in our study predominantly increased basal glucose uptake in both human SQ and HSMM cells. Unlike rosiglitazone, 18F9 increased insulin-mediated glucose uptake in human SQ but did not alter the basal glucose uptake. On the other hand, 18F9 demonstrated a slight increase in basal uptake while showing a marked increase in insulin-mediated glucose uptake in HSMM cells.
Long-term treatment with 18F9 resulted in a dose-dependent lowering of plasma glucose and insulin levels in db/db mice. 18F9 was as effective as rosiglitazone in reducing plasma glucose and insulin. However, 18F9 showed efficacy equivalent to rosiglitazone (5 mg/kg, bid) at 20 times higher dose (ie, at 100 mg/kg, bid). Nevertheless, the reduction in glucose in both treatment groups correlated well with decreased insulin level, suggesting the in vivo insulin-sensitizing activity. Compounds with weak PPARγ
activity have demonstrated potent insulin sensitization
[16,17]. Interestingly, our observation on 18F9 corroborates that a weak PPARγ activation is sufficient for insulin sensitivity. In addition, a less potent adipogenic activity in vitro, nonsignificant body weight gain, and no plasma volume expansion by 18F9 could be due to its weak PPARγ activity. Unlike rosiglitazone, 18F9 did not show reduction in plasma cholesterol levels.
Considering the fact that 18F9 caused insulin sensitiza-tion in vivo and increased insulin-mediated glucose uptake in HSMM, we thought it will be worth examining ex vivo glucose uptake in soleus muscle of continuously treated db/ db mice. We found that rosiglitazone enhanced both basal and insulin-mediated glucose uptake, whereas 18F9 enhanced insulin-mediated glucose uptake only, which is in agreement with our in vitro findings.
To elucidate the mechanism, we performed gene expres-sion profile in soleus muscle and epididymal fat of db/db mice continuously treated with 18F9 and rosiglitazone. Expression of insulin-responsive glucose transporters Glut4 and Glut12 was predominantly elevated by 18F9, whereas Glut1 mRNA, the glucose transporter mediating basal glucose uptake, was markedly up-regulated by rosiglitazone. These findings substantiate the in vitro– and ex vivo–based glucose uptake observed with 18F9 on comparison with rosiglitazone. Earlier reports indicated that rosiglitazone improved peripheral glucose utilization in Zucker fatty rats by elevating Glut1 in adipose tissue and in skeletal muscle
[18]. Given the fact that 18F9 preferentially elevated Glut4 and Glut12 mRNA in addition to increased insulin-mediated glucose uptake in soleus muscle, human SQ, and HSMM cells, it is likely that 18F9 is a promising insulin sensitizer.
Rab5a, a key regulator of phosphoinositide 3-kinase– mediated glucose uptake[19], was up-regulated by 18F9 and rosiglitazone. Interestingly, 18F9 seems to better regulate nonoxidative glucose disposal through up-regulation of Gys1 as compared with rosiglitazone. A previous study has depicted that impaired glycogen synthesis is one of the major causative factors for insulin resistance[20]. Therefore, we conclude that the direct activation of phosphoinositide 3-kinase–dependent glucose uptake by 18F9 may result in the enhanced insulin sensitivity observed in the continuously treated db/db mice.
A recent report demonstrated that pioglitazone (TZD) treatment increases expression of Fasn and Dgat1 in human, mice, and cultured 3T3-F442A preadipocytes [21]. Our results extend these observations to skeletal muscle as well, where both rosiglitazone and 18F9 up-regulated Fasn and Dgat1. Besides, 18F9 also significantly up-regulated the genes involved in fatty acid transport and oxidation (viz, Fabp4, CD36, and Cpt1, and Acc2 and Acox1, respectively) at par with rosiglitazone. Notably, unlike rosiglitazone, 18F9 significantly enhanced Pdk4 expression, which monitors the preference of fuel utilization, that is, lipid oxidation over glucose oxidation in diseased condition[22]. This elevation of genes involved in lipid homeostasis suggests that 18F9
Fig. 9. Gene expression profiling of 18F9 in epididymal fat in db/db mice. db/db mice were treated orally (twice a day) with 18F9 (100 mg/kg) or rosiglitazone (5 mg/kg). One hour after the last dose on day 10, animals were killed; and epididymal fat was excised. Total RNA was isolated and reverse transcribed, and RT-PCR was performed as described in methodology. All transcripts were normalized against the housekeeping gene β-tubulin. Expression level of each gene was plotted as relative fold change against basal expression. A and B, Relative expression of genes involved in adipogenesis and thermogenesis. Data represent mean ± SEM (n = 7). ⁎Pb .05, ⁎⁎Pb .01, and ⁎⁎⁎P b .001 vs control group.
reverses insulin resistance possibly through enhanced lipid transport, synthesis, as well as preferred utilization of fat as a fuel source.
In the present study, 18F9 exhibited modest up-regulation of Ucp2 in soleus muscle, whereas Ucp3 was significantly up-regulated in both soleus muscle and epididymal fat. Ucp2 and Ucp3, the predominant uncoupling genes, regulate energy expenditure and whole-body weight homeostasis by regulating reactive oxygen species, ATP synthesis, and fatty acid oxidation in mitochondria[23-25]. Interestingly, excess lipid infusion over normal diet in rat leads to the activation of CD36 along with a concomitant increase of Ucp2 and Ucp3, implicating the role of uncoupling proteins in lipid oxidation
[26]. Emilsson and associates[27]indicated that enhanced Ucp2 and Ucp3 expression in white adipose tissue could result in thermogenesis in Zucker fa/fa rats with the treatment of a β3-adrenoceptor agonist (BRL 35135).
Therefore, 18F9 may increase energy expenditure by enhancing Ucp2 and Ucp3 expression in adipose tissue and soleus muscle.
Our results demonstrated up-regulation of adiponectin expression by 18F9 in human SQ cells and in epididymal fat of continuously treated mice. Interestingly, adiponectin promotes adipocyte differentiation, lipid accumulation, and insulin sensitivity in 3T3-L1 cells[28], in addition to glucose uptake in skeletal muscle[29,30]. A recent hyperinsulinemic clamp study also demonstrated a positive correlation between adiponectin and glucose disposal by nonoxidative glucose disposal/glycogen synthesis[31]. Adiponectin plays a major role in alleviating insulin resistance by the activation of fatty acid transporters CD36 and Cpt1[32,33]. A recent report provides the physiologic mechanism by which Ucp2 controls adiponectin gene expression to increase systemic insulin sensitivity[23]. Classic study of apelin on C57BL/6 mice demonstrated an increase in serum adiponectin with a concomitant lowering of plasma insulin and TG and an increased thermogenesis by the direct activation of Ucp3
[34]. Given the fact that 18F9 exhibited up-regulation of genes involved in glucose disposal, lipid homoeostasis, fat fuel utilization, and thermogenesis in association with up-regulation of adiponectin mRNA, it is reasonable to assume that adiponectin might play a significant role in 18F9-mediated insulin sensitization.
In summary, 18F9 treatment caused adipogenesis in human preadipocytes and enhanced glucose uptake in human adipocytes, myotubes, as well as diabetic soleus muscle, indicating its insulin-sensitizing activity. Long-term treat-ment of 18F9 demonstrated equiantidiabetic activity when compared with rosiglitazone but was devoid of hepatic adverse effect, body weight gain in db/db mice, and plasma volume expansion in rats. Although all the beneficial effects of 18F9, both in vitro and in vivo, are observed at concentration/dose higher than that of rosiglitazone, a weak PPARγ activity may be responsible for this profile. However, with the differential regulation of Pdk4 and the better up-regulation of adiponectin mRNA and Ucp3 by
18F9 when compared with rosiglitazone, the possibility of other mechanisms cannot be ruled out. A structure search in “Prous Integrity”(www.integrity.prous.com) revealed that compounds with 80% structural similarity to 18F9 have PTP1B inhibitory activity. Therefore, it is likely that PTP1B-mediated mechanism might play a role in 18F9-PTP1B-mediated insulin sensitization. Nevertheless, additional studies are needed to elucidate the precise molecular mechanism. Taking together the antidiabetic activity, hepatic and cardiovascular safety profile, as well as enhanced glucose uptake in human cells (adipose and skeletal muscle), it may be worth developing 18F9 for the treatment of type 2 diabetes mellitus.
Acknowledgment
We express sincere thanks to Dr Parikshit Gaikwad for his assistance in writing the manuscript. We are highly grateful to Dr Rosalind Marita for providing us with 18F9 compound and to Dr Smita Tankiwale and Dr Sandeep Bhingawade for providing the experimental animals.
References
[1] Hopkins PN, Hunt SC, Wu LL, et al. Hypertension, dyslipidemia, and insulin resistance: links in a chain or spokes on a wheel? Curr Opin Lipidol 1999;7:241-53.
[2] Reaven G, Abbasi F, Mclaughlin T. Obesity, insulin resistance, and cardiovascular disease. Recent Prog Horm Res 2004;57:207-23. [3] Schoonjans K, Auwerx J. Thiazolidinediones: an update. Lancet 2000;
356:254-5.
[4] Choi Y, Kawazoe Y, Murakam K, et al. Identification of bioactive molecules by adipogenesis profiling of organic compounds. J Biol Chem 2003;278:7320-4.
[5] Kharitonenkov A, Shiyanova TL, Koester A, et al. FGF-21 as a novel metabolic regulator. J Clin Invest 2005;115:1627-35.
[6] Kramer D, Al-Khalili L, Perrini S, et al. Direct activation of glucose transport in primary human myotubes after activation of peroxisome proliferator–activated receptor–δ. Diabetes 2005;54:1157-63. [7] Allen T, Zhang F, Moddie SA, et al. Halofenate is a selective
peroxisome proliferator–activated receptor–γ modulator with antidia-betic activity. Diabetes 2006;55:2523-33.
[8] Greenspan P, Mayer EP, Flower SD. Nile red: a selective stain for intracellular lipid droplets. J Cell Biol 1985;100:965-73.
[9] Chen L, Yang B, McNulty JA, et al. GI262570, a peroxisome proliferator–activated receptor γ agonist, changes electrolytes and water reabsorption from the distal nephron in rats. J Pharmacol Exp Ther 2005;312:718-25.
[10] Lehmann JM, Moore LB, Smith-Oliver TA, et al. An antidiabetic thiazolidinedione is a high affinity ligand for peroxisome proliferator– activated receptorγ (PPARγ). J Biol Chem 1995;270:12953-6. [11] Murakami K, Tobe K, Ide T, et al. A novel insulin sensitizer acts as a
coligand for peroxisome proliferator–activated receptor–α (PPAR-α) and PPARγ. Diabetes 1998;47:1841-7.
[12] Sandouk T, Reda D, Hofmann C. Anti-diabetic agent pioglitazone enhances adipocyte differentiation of 3T3-F442A cells. Am J Physiol Cell Physiol 1993;264:C1600-8.
[13] Hummasti S, Tontonoz P. The peroxisome proliferator–activated receptor N-terminal domain controls isotype-selective gene expression and adipogenesis. Mol Endocrinol 2006;20:1261-75.
[14] Cha BS, Ciaraldi TP, Carte L, et al. Peroxisome proliferator–activated receptor (PPAR) γ and retinoid X receptor (RXR) agonist have
complimentary effects on glucose and lipid metabolism in human skeletal muscle. Diabetologia 2001;44:444-52.
[15] Tafuri SR. Troglitazone enhances differentiation, basal glucose uptake, and Glut1 protein levels in 3T3-Ll adipocytes. Endocrinology 1996; 137:4706-12.
[16] Vikramadithyan KR, Chakrabarti R, Misra P, et al. Euglycemic and hypolipidemic activity of PAT5A: a unique thiazolidinedione with weak peroxisome proliferator–activated receptor γ activity. Metabo-lism 2000;49:1417-24.
[17] Dey D, Medicherela S, Neogi P, et al. A novel peroxisome proliferator–activated γ (PPARγ) agonist, CLX-0921, has potent anti-hyperglycemic activity with low adipogenic potential. Metabo-lism 2003;52:1012-8.
[18] Kramer D, Shapiro R, Adler A, et al. Insulin-sensitizing effect of rosiglitazone (BRL-49653) by regulation of glucose transporters in muscle and fat of Zucker rats. Metabolism 2001;50:1294-300. [19] Shin HW, Hayashi M, Christoforidis S, et al. An enzymatic cascade of
Rab5 effectors regulates phosphoinositide turnover in the endocytic pathway. J Cell Biol 2005;170:607-18.
[20] Kato M, Suwa A, Shimokawa T. Glucose catabolic gene mRNA levels in skeletal muscle exhibit non-coordinate expression in hyperglycemic mice. Horm Metab Res 2004;36:513-8.
[21] Ranganathan G, Unal R, Pokrovskaya I, et al. The lipogenic enzymes DGAT1, FAS, and LPL in adipose tissue: effects of obesity, insulin resistance, and TZD treatment. J of Lipid Res 2006;47:2444-50. [22] Tanaka T, Yamamoto J, Iwasaki S, et al. Activation of peroxisome
proliferator–activated receptor γ induces fatty acid β-oxidation in skeletal muscle and attenuates metabolic syndrome. Proc Natl Acad Sci U S A 2003;100:15924-9.
[23] Fleury C, Neverova M, Collins S, et al. Uncoupling protein–2: a novel gene linked to obesity and hyperinsulinemia. Nat Genet 1997;15:269-72. [24] Boss O, Hagen T, Lowell BB. Perspectives in diabetes: uncoupling proteins 2 and 3 potential regulators of mitochondrial energy metabolism. Diabetes 2000;49:143-56.
[25] Chevillotte E, Giralt M, Miroux B, et al. Uncoupling protein–2 controls adiponectin gene expression in adipose tissue through the modulation of reactive oxygen species production. Diabetes 2007;56: 1042-50.
[26] Vettor R, Fabris R, Serra1 R, et al. Changes in FAT/CD36, UCP2, UCP3 and GLUT4 gene expression during lipid infusion in rat skeletal and heart muscle. Int J Obes 2002;26:838-47.
[27] Emilsson V, Summers RJ, Hamilton S, et al. The effects of theβ3
-adrenocreptor agonist BRL 35135 on UCP isoform mRNA expression. Biochem Biophys Res Commun 1998;225:450-4.
[28] Fu Y, Luo N, Klein RL, et al. Adiponectin promotes adipocyte differentiation, insulin sensitivity, and lipid accumulation. J of Lipid Res 2005;46:1370-9.
[29] Ceddia RB, Somwar R, Maida A, et al. Globular adiponectin increases GLUT4 translocation and glucose uptake but reduces glycogen synthesis in rat skeletal muscle cells. Diabetologia 2005;48:132-9. [30] Satoh H, Audrey Nguyen MT, Trujillo M, et al. Adenovirus-mediated
adiponectin expression augments skeletal muscle insulin sensitivity in male Wistar rats. Diabetes 2005;54:1304-13.
[31] Yokoyama H, Emoto M, Mori K, et al. Plasma adiponectin level is associated with insulin-stimulated non-oxidative glucose disposal. J Clin Endocrinol Metab 2006;91:290-4.
[32] Yamauchi T, Kamon J, Waki H, et al. The fat-derived hormone adiponectin reverses insulin resistance associated with both lipoatro-phy and obesity. Nat Med 2001;7:941-6.
[33] Yoon MJ, Lee YG, Chung JJ, et al. Adiponectin increases fatty acid oxidation in skeletal muscle cells by sequential activation of AMP-activated protein kinase, p38 mitogen-AMP-activated protein kinase, and peroxisome proliferator–activated receptor α. Diabetes 2006;55: 2562-70.
[34] Higuchi K, Masaki T, Gotoh K, et al. Apelin, an APJ receptor ligand, regulates body adiposity and favors the messenger ribonucleic acid expression of uncoupling proteins in mice. Endocrinology 2007;148: 2690-7.