AMAZON TRANSPORTATION: A STUDY FOCUSED ON ENERGY CONSUMPTION
Ocileide Custódio da Silva
Nokia Institute of Technology – INdT Rod. Torquato Tapajós, 7200, Manaus/AM/Brazil
Silvana Dacol
Federal University of Amazonas – UFAM/Manaus/AM/Brazil Av. Rod. Octavio Rodrigo Jordão, 3000 – Faculdade de Tecnologia
Waltair Vieira Machado
Federal University of Amazonas – UFAM/Manaus/AM/Brazil Av. Rod. Octavio Rodrigo Jordão, 3000 – Faculdade de Tecnologia
Jean Marchal
University of Liège
ABSTRACT
The purpose of this work is to study the supply chain analysis on consumer goods from PIM, focused in environmental issues. The methodology used to develop this study was the theoretical analysis of the logistical chains applied in the PIM. Data concerning different logistical processes were evaluated as a function of their distance, transport and energy consumption. The following freight transportations were analyzed: overland, cargo ship and aircraft. The Index of Environmental Impact (IEI) was built to present the influence of each transport and logistical process used in the PIM. According to the evaluation made in this paper, the model of IEI leads the rank of energy consumption of different logistical chains of consumer goods. Regarding energy consumption the IEI presented the following rate: aircraft > overland > cargo ship. IEI was developed to PIM activities; however, it can be applied in other supply chains and different sceneries.
Keywords:
Logistical chains, energy consumption, index of environmental impact, PIM, transport; costs.
1 INTRODUCTION
Manaus’ Industrial Pole (PIM), located in the state of Amazonas - Brazil stands out as the largest electro electronic pole in Latin America. With more than 400 companies producing products of high technology and value, PIM is today reference to other Brazilian and international industries. The incentive to the regional economical potentialities, in the search for self – sustainable growth provoked in 2006, a mass movement of cargo transported from Manaus, investing more than 1,5 billion dollars in air transport (US$ FOB 651,459,736) and river transport (US$ FOB 514,505,096) [MDIC, 2007].
The location and the geographical characteristics of the area influence companies involved in the PIM, to observe the logistical chains as an integrated system if they want to be competitive. The infrastructure needed for the discharging of goods produced by the PIM, is mainly based on air and water modes. However, which of these modes cause smaller environmental impact and consequently which one consumes less energy?
In this sense, this study analyzes the level of energy consumption of the three modes used to transport the PIM’s industrial production. Based on theoretical data of the pole’s logistical chain’s characteristics, the goods which were produced and discharged were analyzed and identified, observing the distant parameters, transport, energy consumption and the environmental impact, using the modal and inter-modal infrastructure transport which exists in the Amazon area.
It is understood that the mode described represents a way that the PIM companies have, to re-evaluate their logistical chains, when related to the transport infrastructure used. It’s also important to remember that the quality, cost and environmental impacts are parameters that need to be observed in the search for efficient and effective alternatives.
2 ENVIRONMENTAL MANAGEMENT
Environmental management has traditionally focused on toxic compounds treatment without considering the parallel activities involving the complete production chain from cradle to grave. This includes, beyond manufacturing of goods, utilization, and discharging; the phases between each stage into the life cycle of the products, such as transportation steps. Transportation and logistics have an important influence on the life cycle of products considering energy consumption and emissions. Since the current increase of environmental awareness has also lead to concerns on gl obal warming, energy consumption has became an essential topic which request better management to achieve sustainability in the production chains.
The companies responsible for the main productive chains have augmented their interest in environmental issue s, due to the growing interest of the customers on this subject. Environmental awareness is already a tendency and the publ ic is very attentive to topic. Most of the companies current activities, regard the deactivation of products containing hazardous substances, and research on new design of products environmentally friendly. These procedures are only the basement of
the actions needed to decelerate the global warming. In order to have a more effective result, all production chains, includi ng their ramifications, should be narrowly evaluated.
The deepening of environmental management on logistics and transportation, especially in faraway areas, is the key of the regional sustainable development. Moreover, the excellence in environmental management on logis tics and transportation can contributes to the reduction of using of fuels and consequently emissions and global warming.
3 LOGISTICS AND TRANSPORTATION
Nowadays it is up to the logistic researchers' consensus to observe things in a systemic way, because this includes all of the necessary operations to accomplish a commercial transaction. This transaction occurs through the discha rging of goods, information and/or capital aims which integrate the production of consumption and mainly respect the environment. Handakata [2006] affirms that the logistic chains, seen as an integrated system, evaluate the main elements (goods, information, capital) through the analysis of the parameters (cost, time, quality, environmental impact), of the components (infrastructure, operations, services) and their interrelationships, in other words, it is a complex system to be managed. Brazil has been an important world exporter of cereals, meats and food. The Brazilian production has been using mainly land, air and water transport to get to the consumer market. The amount of Brazilian cargo which is transported by cargo ships corresponds to 11.77%. The cargo transported on land is equal to 63.10% and on aircrafts is equal to 25.13%. However, this scenario has been changing, mainly due to investments in the waterways. Due to this extension, Brazilian transport has been one of the great challenges to its rulers. Even so, after the privatization of the coastal traffic navigat ion system, as well as of the highways in the country, enormous investments have been done in the section of transports, which integrates the country into the main economical markets [MINISTRY OF EXTERNAL RELATIONSHIPS, 2007].
The transport of passengers and of cargo is divided basically into three transfer modes: air, rivers and land [FREITAS; PORTUGAL, 2006]. However, in the search for competitiveness, when related to reliability, shorter transport time, quality and mainly routes, the companies have been giving more emphasis on two different modes of cargo trans fer, the intermodal or the multimodal. Studies show that the multimodal transport brings benefits to the logistical chain. The companies become more competitive and integrated within the markets, besides increasing the regional development and the social i ntegration in the frontier countries [NOVAES, 2004; IIRSA; 2006; TSAMBOULAS, 2007; ZHANG et al., 2007].
3.1 Logistical chains in the Amazon
For Handabaka [2006], the Amazon basins, Silver and Orinoco, with more than 10 thousand Km2, constitute an important axis to Latin America; the North-South fluvial axis is the largest navigation corridor in the world. To the north of the South American continent near the equator line, lies the Amazon basin with an extension of approximately 6,600 km2. One of the most economically important cities in the area is Manaus. With its logistics platform, it connects Brazil and other continents, becoming the main cargo transfer area, and consequently discharging the industrial production to Manaus´ Industrial Pole. The transport infrastructure in the area now (air, land and river) characterizes the service of marine transport, related to long course and coastal traffic. When referring to coastal traffic, Manaus comes in first place in some of the services now in operation. In the long course, the cities of Belém and Manaus are scales of international services, making the Amazon an important center for countries such as the United States and the Far East, up to the Caribbean harbors.
Manaus` Free Zone constitutes the Industrial Pole of Manaus today (PIM) and its objective is to create a pole of economical development in the geographical center of the Amazon [BRAZIL, 1967]. Because of the fiscal exemptions and essential means of internal consumption for attraction of capital and labor, a fast regional progress is assured, Manaus’ Industrial Pole is expanding and becoming important for the Brazilian and world economy. Initially characterized by companies of the electro and electronic section, it contemplates other important areas today, such as the motor biking industry and more recently, the cellular phone industry [DACOL et al., 2006].
With a revenue above US$ 22.8 billion and the generation of 89 thousand direct jobs in 2006, Manaus’ Industrial Pole has been attracting industries of renowned international prestige, holders of technologies and recognized brands and is consecrated by the consuming public [SUFRAMA, 2007].
The Treaty of the Amazonian cooperation between the Brazilian government and the frontier countries has been offering intense mechanisms in the environmental areas, health and education, and moreover, it is strengthening the international bows and regional development. In this sense, the Brazilian economical and geographical diversity has been contributing to the improvement of the Brazilian external trade, mainly in the Northern area.
In 2006 with a cargo discharge of over 1.1 million tons, the markets have been taking advantage of the products manufactured in Amazonas. 139,992,920 Kg of cargo exported from the State, 53.50% went to the market of Latin America and the Caribbean, 24.25% to Asia and the Pacific (APEC) and 22.55% to the European Union (UE). On the other hand, Manaus imported about 965.990.388 kg of cargo, moving a higher number of FOB of US$ 6.2 billion in the same year. The volume of imported cargo was 2.78% by air and 97.05% through waterways [MDIC, 2007]. Finally, Manaus’ Industrial Pole has been giving importance to its geographical characteristics in the logistics chain, when related to types of transport.
3.2 Energy consumption
Energy consumption is a focal point today when environmental preservation is considered. According to Kyoto Protocol, the items concerning emissions derive greatly from energy generation by thermal power plants that base the ir operations on burning gas, coal and oil [ ]. Energy consumption and emissions requested during transportation and logistical processes can have an important influence on the life cycle of products. In this work, the energy consumption used in each one o f the different types of transportation previously mentioned will be analyzed regarding environmental impact generating an Index
and an environmental profile of the system. Through these data, environmental managers are able to identify the key issues of the process chain and to create alternative options that could reduce the environmental impacts.
The energy cost is measured in Mega-Joules (MJ) consumed for each kilogram (kg) of material transported.
3.3 Mathematical models
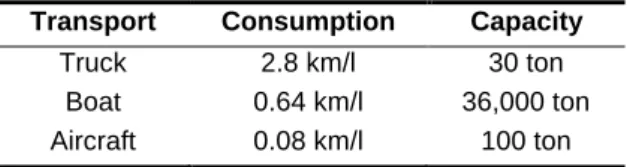
Logistic and transportation of products focused on energy consumption is analyzed in this study considering the routes and fuels used during the process. The geographic routes used to complete the life cycle of products made in the PIM are evaluated as a function of different transportation types such as truck, aircraft, and ship (see Table 1). Capacity values are based on the quantity of materials that each different type of transport can freight. The energy consumption at transportatio n was calculated according to the following data and Table 1.
Fuel utilized (energy): Diesel: 9.8 kWh Kerosene: 9.6 kWh
Conversion: 1 kWh = 3.6 106 J = 3.6 MJ
Table 1: Transportation data
Transport Consumption Capacity
Truck 2.8 km/l 30 ton Boat 0.64 km/l 36,000 ton Aircraft 0.08 km/l 100 ton
Energy consumption (EC) calculation:
kg C kWh MJ l kWh E l km f km d kg MJ EC f ship aircraft truck 6 . 3 * * (1) Where:
The energy used by truck, airplane or ship transportation is:
kg
MJ
EC
ship aircraft truck ; Distance:d
km
;Energy available per liter of fuel:
l
kWh
E
f ; Unit conversion:kWh
MJ
6
.
3
; Load capacity:C
kg
; Fuel consumption:l
km
f
.Fuel consumption and load capacity for trucks and ships were estimated based on information from Ctil, a transportation company in Manaus-Brazil. Current estimates for ships consider fuel used as diesel. Fuel consumption and load capacity for aircrafts, and the energy available per liter of fuel have been respectively estimated and obtained based on information from
www.vr-transport.de. The distances were obtained by using the Google Earth1 software. Transportation routes were based
on standard logistics used in the PIM.
1
Eco-Factor was used to evaluate the environmental impact caused by different types of transportation. The eco-factor (EF) is calculated according to the formula [TALVENMAA 2006]:
100 * , , , , % 1 boa aircraft truck AVERAGE energy boat aircraft truck AVERAGE EF energy energy (2)
Where, “energy1” is the individual energy consumption. 3.4 Sceneries
The scenery evaluated in this study is based in the standard logistic used in the PIM to import and export different goods. In this case, aircrafts are widely used to transport high technology products which could be easily broken during other types of transportation. Boats and trucks normally transport more resistant materials. The scenery represents logistical processes from PIM to Brazilian trades and also to divers markets such as USA, Europe and Asia. These markets can supply raw materials and/or to be PIM’s customers.
This work proposes to evaluate the energy consumption requested by these different routes as a function of the distance and the fuel utilized to complete the logistical chains.
4 RESULTS AND DISCUSSION
The results obtained are presented focusing energy consumption, energy consumption vs. type of transportation and Eco-Factor. Through these data can be possible to estimate an Index of Environmental Impact and determine which type of transportation could have minor harmful environmental influence and consequently contributing to decelerate the global warming.
Table 2 presents the energy consumption as a function of the distance and the fuel utilized to complete the logistical chains. Table 2: Routes evaluated in this study
These routes in Table 2 constitute the scenery evaluated in this work. Data generated of energy consumption will be used to build the environmental profile of the system. According to this scenery, the route using air transport expends much more energy than other ones.
4.1 Energy Consumption vs. Type of Transportation
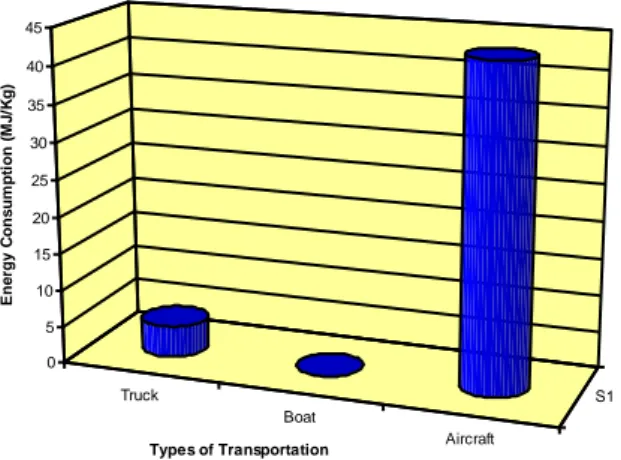
Figure 1 shows the energy consumption as a function of the type of transportation used to freight products by 10,000 kilometers. Truck Boat Aircraft S1 0 5 10 15 20 25 30 35 40 45 E ne rgy C on s um pt ion ( M J /K g) Types of Transportation
Figure 1: Energy Consumption vs. Type of Transportation
It can be seen in Figure 1 that boats safe more energy than the other transportation alternatives. This can be explained by the larger boats capacity to transport products instead of aircrafts and trucks.
Air transportation is widely utilized in the PIM to supply raw materials for microelectronics, and also to flow the productio n. In this case, the logistic is chosen to minimize possible damages in fragile products, normally high-tech goods with high-added value, and/or to have a faster distribution in the different markets with reliable transport. According to Fenley et al. [2007], air transport can provide unrestricted levels of accessibility to any remote location despite the high energy consumption (Figure 1).
Although river transports present reduced energy consumption in Amazon region (PIM), if comparing to air transportatio n, this modal depends on the weather conditions. For example, it was noticed that during the last record dry season in the Amazon (in 2005), the river transport had limited navigation [FENLEY et al. 2007].
Road transport consumes minor energy than air transportation however in the current scenery it needs investments and high costs to maintain the infrastructure. Moreover, road transport can also contribute to the deforestation of the Amazon native rainforests.
4.2 Eco-Factor
Figure 2 represents the Eco-Factor for energy consumption as a function of the type of transportation.
-200% -150% -100% -50% 0% 50% 100% 150%
Truck Boat Aircraft
E c o -F a c to r Figure 2: Eco-Factor
Figure 2 enables the visualization of energy consumption for each type of transport used in this study and estimative of the most critical logistical chain. The lower energy consumption is presented in the green graphic area while the higher energy consumption is presented in the red graphic area.
These results can be used to create a model of Index of Environmental Impact (IEI) leading the rank of energy consumption of different logistical chains of consumer goods. Regarding energy consumption the IEI presents the following rate: aircraft > overland > cargo ship. This Index of Environmental Impact was developed to PIM activities; however, it can be applied in other supply chains and different sceneries since made the correct adaptations.
In spite of air transportation has presented an insufficient Eco-Factor, according to Fenley et al. [2007] it has contributed to the economical development of the PIM and Amazonas region. It was already demonstrated that to have an efficient supply chain other factors should be considered to evaluate the environmental impact model. Although factors such as costs, economical development, flexibility, security, mobility and freight capacity are very important, all production chain have be re-analyzed and the environmental management should reach a healthy balance to avoid further troubles regarding environmental warming.
5 CONCLUSIONS
To the scenery evaluated the route using aircraft expend much more energy than boat and truck. Boats can safe more energy than the other transportation alternatives due to the larger capacity to transport products instead of aircrafts and trucks. Regarding energy consumption the model of Index of Environmental Impact (IEI) presents the following rate: aircraft > overland > cargo ship.
The transport model in Amazon region should be re-evaluated leading to the use of integrated types of transportation. In this case, logistical chain is essential to assure the reduction of energy consumption and consequently environmental impact.
6 REFERENCES
BOTELHO, Antônio José. Redesenhando o projeto ZFM: um estado de alerta uma década depois. Manaus: Editora Valer, 2006.
BRASIL. Ministério da Justiça. Divulgação legislativa – Tomo II, 3ª Parte. Decretos – Leis de 28.02.67 a 14.03.67, nº. 230
a 318. Brasília, 1967.
BRASIL. Ministério do Desenvolvimento, indústria e comércio exterior. ALICEWEB. Retrieved on March 29th 2007 for <http://aliceweb.desenvolvimento.gov.br>.
DACOL, Silvana, ALOISE, Pedro, REBELO, Luiza Maria Bessa. As estratégias de internacionalização da produção no
FENLEY, Claudio A., MACHADO, Waltair V., FERNANDES, Elton. Air transport and sustainability: lessons from
Amazonas. Applied Geography 27, p. 63-77, 2007.
FREITAS, Aimberê, PORTUGAL, Licinio da Silva. Estudos de Transporte e logística na amazônia. Novo Tempo: Manaus, 2006.
GOOGLE EARTH. <http://
www.earth.google.com/
> March, 2007.HANDABAKA, Alberto Ruibal. Corredores interoceánicos sudamericanos: critérios logísticos de selección. Lima: Fimart S.A.C. Editores e Impresore, 2006.
IERLAND, Ekko Van, GRAVELAND, Cor, HUIBERTS, Robert. An environment economic analysis of the new rail link to
European main port Rotterdam. Transportation research –Part D 5, p. 197-209, 2000.
IIRSA. Iniciativa para la integración de la Infraestructura Regional Suramericana. IIRSA. Banco Iteramericano de Desarrolho, 2006.
MDIC (Ministerio das Relações Exteriores), 2007. Information regarding imports and export for the Airport and Harbor of Manaus. Retrieved on March 29th 2007 for < http://www.dc.mre.gov.br/brasil/page41.asp>.
NOVAES, Antônio Galvão. Logística da cadeia de distribuição. 2. ed. Elsevier: Rio de Janeiro, 2004. SUFRAMA. Boletim informativo. Retrieved on March 29th 2007 for <http://www.suframa.gov.br/> .
TALVENMAA, P. Eco-Factor Calculation. Tampere University of Technology (TUT), Finland, 2006. <http://www.ctil.com.br: march 2007>.
TSAMBOULAS, Dimitrios A.. A tool for prioritizing multinational transport infrastructure investments. Transport Policy 15, p. 11-26, 2007.
ZHANG, Anming, LANG, Chunmei, HUI, Y.V..LEUNG, Lawrence. Intermodal alliance and rivalry of transport chains: The air cargo market. Research Part E, p. 234-246, 2007.