1
Influence of heat treatment and its sequence on elevated-temperature properties of Al-Mn-Mg 3004 alloy
K. Liu*, X.-Grant Chen
University of Quebec at Chicoutimi, Saguenay, QC, Canada, G7H 2B1 *corresponding author: kun.liu @uqac.ca; Tel.: 1-4185455011 ext.7112; Fax.: 1-4185455012
Abstract:
Various heat treatments with different sequences between the peak precipitation treatment (375°C/48h, referred to as “P”) and the high temperature treatment (450-600 °C, referred to as “H”) were performed in Al-Mn-Mg 3004 alloys to simulate their thermal treatments during thermomechanical fabrication processes in the present work. Their influences on the dispersoid precipitation and elevated-temperature properties (yield strength and creep resistance at 300 °C) were investigated. The results indicate that the size of dispersoids increased while the volume fraction of dispersoids decreased with increasing “H” temperature when “P” was performed either prior to or after “H” (denoted as “PH” and “HP”, respectively), which results in the reduction of the elevated-temperature properties. However, the yield strength and creep resistance after “PH” treatments were always higher than those after “HP” treatments at the same “H” temperature. When the “H” temperature during “PH” treatments is controlled below 500°C, the materials can still maintain the appropriate yield strength and creep resistance, providing the possibility for Al-Mn-Mg 3004 alloy to adapt to the conventional fabrication processes but still maintain high elevated-temperature properties.
Keywords: Al-Mn-Mg 3004 alloys; Heat treatments; Dispersoid precipitation; Elevated-temperature properties
1. Introduction
Due to their excellent formability, corrosion resistance and high strength, Al-Mn-Mg 3xxx alloys have been widely used in the fabrication of containers and packaging materials [1]. Though Al-Mn-Mg 3xxx alloys have traditionally been classified as non-heat-treatable aluminum alloys, the precipitation of a number of dispersoids during heat treatment has been discovered in 3003 alloys, resulting in an improvement of the mechanical properties at room temperature (RT) [2-5]. Li’s group [4] found that the yield strength (YS) of 3003 alloys at RT increased from 52 MPa after homogenization (600°C/24h) to 80 MPa after the precipitation treatment at a relatively low temperature (375°C/24h), in which a large amount of dispersoids precipitated and contributed to the improvement in strength. Recently, Liu et al. [3, 6, 7] systematically investigated the influence of the dispersoid precipitation on the elevated-temperature strength and creep resistance in 3004 alloys and found that the YS and creep resistance at 300 °C increased
2
remarkably after the precipitation treatment at 375°C/48h. Furthermore, the precipitated dispersoids were confirmed as α-Al(MnFe)Si phase dispersoids and shown to be thermally stable at 300 °C [3], which results in the stable elevated-temperature properties of 3004 alloy and makes the 3004 alloy a promising candidate for elevated-temperature applications.
In the conventional fabrication processes of Al-Mn-Mg 3xxx alloys, a high-temperature homogenization treatment (~ 600 °C) is typically performed before extrusion and rolling. In addition, the pre-heating of extrusion billets and rolling ingots up to ~ 500 °C is often required prior to extrusion and rolling. Those temperatures are much higher than the formation temperature of dispersoids (~ 342 °C [3]) and thus may have a significant influence on the dispersoid precipitation and the final mechanical properties [8-10]. It was reported that dispersoids tended to precipitate during the homogenization of 3xxx alloys, but their size and distribution were greatly dependant on the temperature and holding time [2, 10-12]. However, there has always been controversy in the literature about the influence of various homogenizations on the mechanical properties. In the investigations of Muggerud et al. [2] and Es-Said et al. [10] on 3003 alloys, the strength at RT was reported to decrease with increasing temperature from 375 °C to 621 °C, while the highest strength was reportedly obtained after 630°C/9h by Huang et al. [11].
With respect to maximizing the dispersoid precipitation and strengthening effect, a relatively low temperature treatment at 375-400 °C can be considered as the peak precipitation treatment to obtain the best elevated-temperature properties [3, 4, 6]. However, there are limited studies available on the evolution of dispersoids and elevated-temperature properties during different thermal processes for Al-Mn-Mg 3xxx alloys, such as the temperature and sequence of various thermal treatments. Therefore, optimizing the thermal treatment to adapt to thermomechanical fabrication processes but also maintain as high as possible elevated-temperature properties is a major concern during the industrial production for elevated-temperature applications of Al-Mn-Mg 3xxx alloys.
In this work, different heat treatments and sequences between the peak precipitation treatment and high-temperature treatment for the Al-Mn-Mg 3004 alloy were explored to easily simulate the possible scenarios of thermal treatments during conventional fabrication processes. The evolution of the dispersoid precipitation and elevated-temperature properties (the YS and creep resistance at 300 °C) during various heat treatments was investigated.
2. Experimental
An Al-Mn-Mg 3004 alloy was prepared with commercially pure Al (99.7%), pure Mg (99.9%), Al-25%Mn, Al-25%Fe and Al-50%Si master alloys. Approximately 3 kg of material was prepared in a clay-graphite crucible using an electric resistance furnace. The temperature of the melt was maintained at ~750°C for 30 min. The melt was degassed for 15 min and then poured into a permanent mold preheated at 250°C. The dimension of
3
cast ingots was 30mm×40mm×80mm. The chemical composition of the experimental alloy analyzed with optical emission spectrometer (OES) was as follows: Al-1.11%Mn-1.08%Mg-0.57%Fe-0.25%Si (all alloy compositions here are given in wt. % unless indicated otherwise).
In our previous work [3], it was found that the volume fraction of dispersoids was maximized at the peak precipitation treatment (375°C/48h). Therefore, 375°C/48h was designated as one step and referred to as the “P” treatment. On the other hand, the temperature for the high-temperature treatments was selected in the range of 450-600 °C [10], which was defined as the “H” treatment, and the holding time was fixed for 1 hour, according to the results shown in Fig. 1. In this work, two different sequences between the “P” and “H” treatments were designed: “PH” with “P” before the “H” treatment and “HP” with “P” after the “H” treatment. All the parameters of the heat treatments are shown in Table 1. The heat treatments were performed in a programmable electric furnace with circulating air and temperature controlling within ± 2°C. The heating rate was set as 5°C/min. After each step, the ingots were quenched directly into water at room temperature.
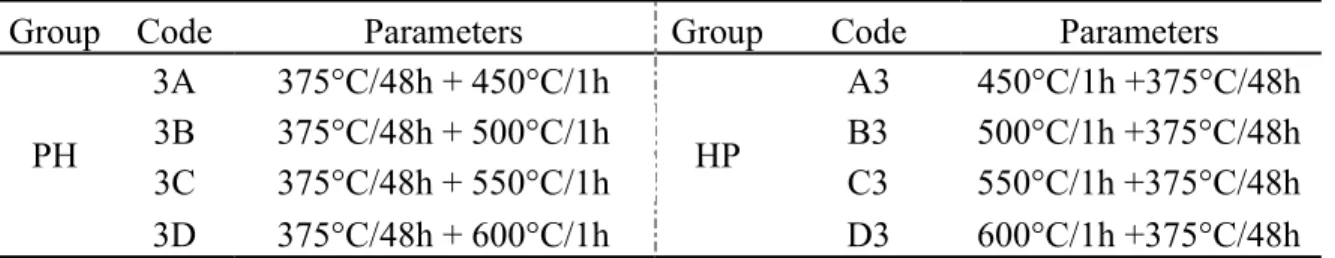
Table 1 Details of various heat treatments applied
Group Code Parameters Group Code Parameters
PH 3A 375°C/48h + 450°C/1h HP A3 450°C/1h +375°C/48h 3B 375°C/48h + 500°C/1h B3 500°C/1h +375°C/48h 3C 375°C/48h + 550°C/1h C3 550°C/1h +375°C/48h 3D 375°C/48h + 600°C/1h D3 600°C/1h +375°C/48h
Note: In all the codes of samples, “3” is for the “P” treatment at 375°C/48h, while “A”, “B”, “C” and “D” stands for the “H” treatment at the temperatures of 450, 500, 550 and 600 °C, respectively.
After the heat treatment, the samples were polished for the metallographic observations. To clearly reveal the dispersoids, the polished samples were etched in 0.5% HF for 30 seconds. An optical microscope (OM) and a scanning electron microscope (SEM) were used to observe the distribution of dispersoids. A transmission electron microscope (TEM) operated at 200kV was used to observe the size and distribution of dispersoids in details. TEM samples were firstly mechanically grinded to a thickness of 50-60 μm, followed by electropolishing in twin-jet unit operated at 15V and -25oC DC in a 30% nitric acid and 70% methanol solution. The thickness of the TEM sample was measured with electron energy loss spectroscopy (EELS). The size and number density of dispersoids were measured using Clemex PE 4.0 image analysis software with the TEM images. In this study, the volume fraction of particle free zone (PFZ) was converted from the area fraction of PFZ measured using image analysis from optical microscope (OM) images according to the Delesse’s principle [13, 14] while the volume fraction of dispersoids was calculated according to the model introduced in the literature [5]and shown in Eq. (1):
4
V A 1 A (1) where D is the average equivalent diameter of dispersoids, which is calculated according to the literature [5]; t is the TEM foil thickness; AA is the area percentage of dispersoids from TEM observation; APFZ is the area percentage of the particle free zone (PFZ) from OM measurements; and K is the average shape factor of dispersoids.
Moreover, the electrical conductivity (EC), Vickers microhardness, yield strength (YS) and creep resistance were measured after various heat treatments. Both the EC and microhardness were measured at RT. A Sigmascope SMP10 electrical conductivity unit was used for EC measurements, while a NG-1000 CCD microhardness tester was used for microhardness measurements. The mechanical property (YS) was obtained from compression tests performed on a Gleeble 3800 machine. The values of YS at both RT and an elevated temperature (300 °C) were measured with a strain rate of 10 -3/s. For the Gleeble compression test at 300 °C, the specimen was heated to 300 °C with a heating rate of 2°C/s and then held for 3 minutes to stabilize the uniform temperature distribution of the sample hold in the Gleeble machine. The compressive creep tests were performed at 300 °C for 100 hours with a constant load stress of 45 MPa. The same cylindrical specimens (15 mm in length and 10 mm in diameter) were used for both the YS and creep tests. All samples tested at 300 °C (YS and creep) were maintained at 300 °C for 100 h in the furnace followed by water quenched to stabilize the alloy condition prior to the test.
3. Results and Discussion
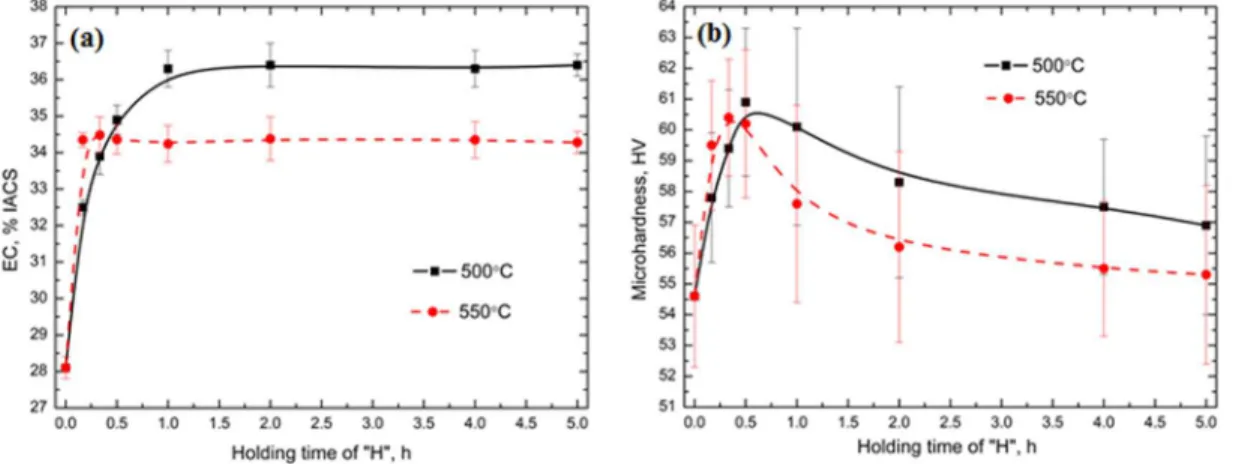
In our previous work [3], the precipitation of dispersoids during the heat treatments at a relatively low temperature range (300 to 450 °C) was systematically studied. Fig. 1 shows the evolution of the EC and microhardness during the “H” (high temperature) treatments at 500 °C and 550 °C.
Fig. 1 Evolution of the electrical conductivity (a) and the microhardness (b) during the single “H” treatment at 500 °C and 550 °C
5
As shown in Fig. 1a, the EC increases rapidly and reaches a peak value after less than 1 hour at both 500 °C and 550 °C, which indicates the rapid decomposition of the supersaturated solid solution and the precipitation of dispersoids, according to the literature [3, 5]. The microhardness also increases rapidly as the holding time increases and reaches a maximum value in less than 1 hour at both 500 °C and 550 °C. This is followed by a gradual decrease as the holding time is extended (Fig. 1b), which indicates the first precipitation and then the coarsening of dispersoids [2, 3]. Therefore, the holding time of the “H” treatment in this work has been fixed at 1 hour, as shown in Table 1. 3.1 Evolution of microstructure during various heat treatments
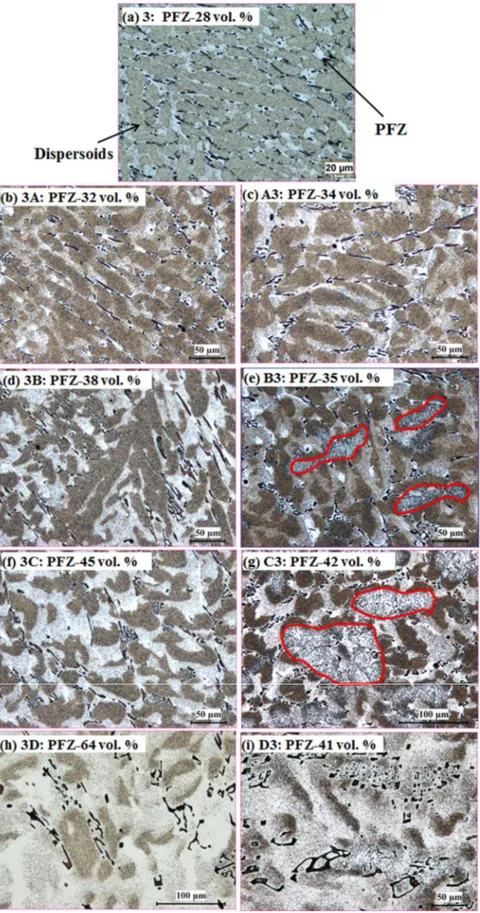
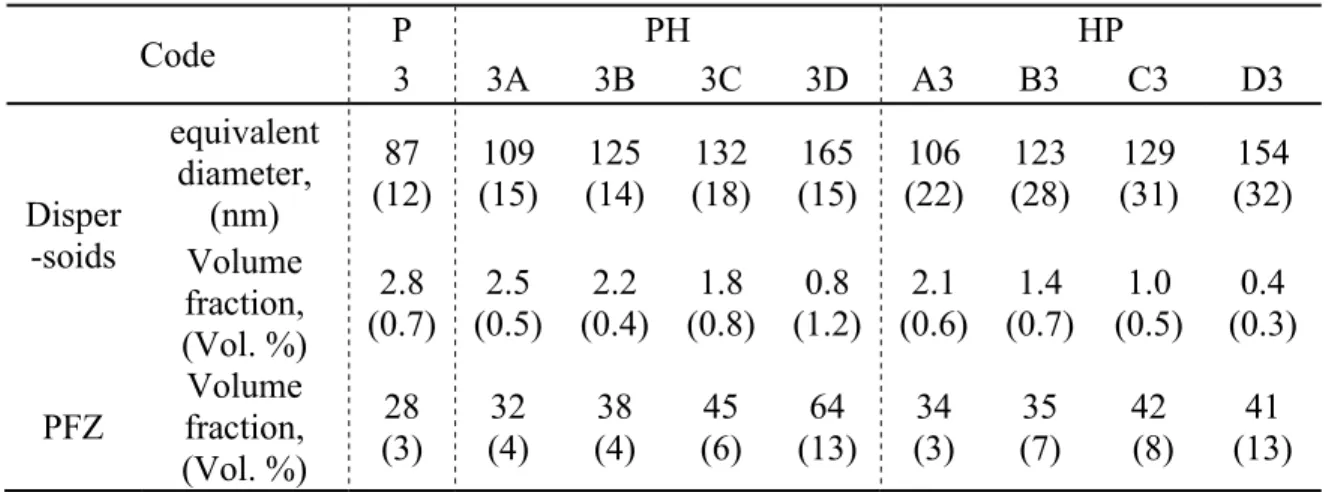
Fig. 2 illustrates the etched microstructures to show the evolution of dispersoids during various heat treatments. As a reference, the microstructure of the “P” treatment (375°C/48h) is also shown in Fig. 2a, while the left side of Figs. 2b, 2d, 2f and 2h belongs to the group of “PH” and the right side of Figs. 2c, 2e, 2g and 2i are for the “HP” group, respectively. It is found that during all heat treatments, a number of dispersoids precipitated in the dendrite cells and grains, while the particle free zone (PFZ) was formed surrounding the intermetallic particles in the interdendritic regions. As shown in Fig. 2, the volume fraction of the PFZ (noted in Fig. 2a) generally increases as the temperature of the “H” treatment increases in both the “PH” and “HP” treatments. For instance, the volume fraction of the PFZ increases from 28 vol. % after “3” to 32 vol. % after “3A”, and 38 vol. % and 45 vol. % after 3B and 3C, respectively, and it increases further to 64 vol. % after 3D.
6
Fig. 2 Optical images of the distribution of the dispersoid zone and the particle free zone (PFZ) after various heat treatments
7
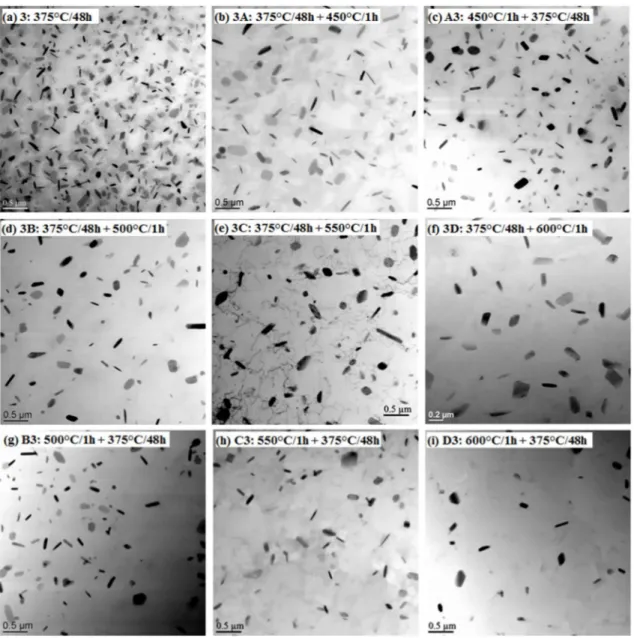
Due to the sub-micrometer size of dispersoids, TEM was used to investigate the size and distribution of dispersoids during various heat treatments, and the results are shown in Fig. 3 and Table 2. Compared with the “P” treatment (Fig. 3a), the size of dispersoids increases, while the volume fraction of dispersoids decreases in both the “PH” and “HP” treatments. This tendency is much clearer at higher temperatures, such as 3C in Fig. 3e and C3 in Fig. 3h. As shown in Table 2, the dispersoids after 3C and C3 are much bigger but with lower volume fractions than “3”.
Fig. 3 TEM images of the dispersoid precipitation in the dispersoid zone after various heat treatments
8
Table 2 Characteristics of dispersoids and PFZ after heat treatment
Code P PH HP 3 3A 3B 3C 3D A3 B3 C3 D3 Disper -soids equivalent diameter, (nm) 87 (12) 109 (15) 125 (14) 132 (18) 165 (15) 106 (22) 123 (28) 129 (31) 154 (32) Volume fraction, (Vol. %) 2.8 (0.7) (0.5) 2.5 (0.4) 2.2 (0.8) 1.8 (1.2) 0.8 (0.6) 2.1 (0.7) 1.4 (0.5) 1.0 (0.3) 0.4 PFZ Volume fraction, (Vol. %) 28 (3) (4) 32 (4) 38 (6) 45 (13) 64 (3) 34 (7) 35 (8) 42 (13) 41 Note: The deviation is shown in bracket.
There are large differences in the characteristic of the dispersoids and PFZ between “PH” and “HP”. During the “PH” treatment, the full precipitation of dispersoids and their subsequent growth or dissolution is the dominant feature. In the first step, the “P” treatment, the dispersoids have been fully precipitated [3], and therefore, the dispersoids tend to grow and even dissolve as the temperature of the following “H” treatment increases. As shown in Figs. 2 and 3, the dispersoids begin to grow in 3A at 450 °C (Figs. 2b and 3b) and further coarsen in 3B at 500 °C (Figs. 2d and 3d) and in 3C at 550 °C (Figs. 2f and 3e) compared with the “P” treatment (Figs. 2a and 3a). The size of
dispersoids increases gradually as the temperature of the “H” treatment increases (Table 2). Upon a further increase of the temperature to 600 °C (Figs. 2h and 3f), it is
clear that some of the dispersoids have dissolved into the aluminum matrix, which is in agreement with the literature [11]. However, the coarsening rate remains relatively low due to the thermal stability of the dispersoids and the lower availability of Mn in the aluminum matrix after the first “P” treatment. Meanwhile, the volume fraction of dispersoids decreases, and the volume fraction of the PFZ increases with increasing temperature of the “H” treatment due to the coarsening and dissolution of dipsersoids (Table 2).
On the other hand, the rapid precipitation and growth in the “H” treatment followed by re-precipitation of dispersoids in the “P” treatment occurs during the “HP” treatment. As shown in Fig. 2c, some much larger dispersoids are present in the center of dendrites, which is more easily observed in the red-cycled zones at 500 and 550°C (Figs. 2e and 2g). In addition, the area with larger dispersoids increases with increasing the “H” temperature, as shown in Figs. 2e and 2g. Meanwhile, some fine dipsersoids can still precipitate during the subsequent “P” treatment (Figs. 3c, 3g and 3h) due to the lower solubility at a lower “P” temperature compared with the “H” temperature. However, due to the lower supersaturate solid solution level of Mn after the “H” treatment, much fewer dispersoids can precipitate in the following “P” treatment compared with the “P” treatment in “PH” treatments. In addition, the distribution of Mn in the aluminum matrix
9
during the “HP” treatment is more uniform due to the rapid diffusion at the first step as the “H” treatment. Therefore, the dispersoids can precipitate in both the center of grains and the interdendrite zone due to the even distribution of Mn in the matrix under the sufficiently high temperature and time during the “H” treatment, which results in the lower PFZ area after “HP” treatments. It can be found that the volume fraction of the PFZ in “HP” is generally lower than that in “PH”, especially at higher “H” temperatures. For instance, it is 64 vol. % in 3D but only 41 vol. % in D3. It should be noted that the size and amount of dispersoids are primarily determined by the first “H” treatment during “HP” treatments. The higher the temperature of the first “H” treatment is, the larger the
size and the lower the volume fraction of the dispersoids after the “HP” treatments (Figs. 3f to 3g and Table 2).
Moreover, it seems that the average size of dispersoids after “PH” is similar or slightly larger than that of dispersoids after “HP”, but the size distribution of dispersoids after “PH” is more uniform with a smaller deviation. One possible reason is that some small dipsersoids precipitated in the “P” treatment after “H” during the “HP” treatment, which results in the lower average size. As shown in Fig. 3c, 3g and 3h, some fine dispersoids can be observed after A3, B3 and C3, which are most likely precipitated during the second step “P” treatment. In addition, the volume fraction of dispersoids after “PH” is always higher than that after “HP” at the same “H” temperature (Table 2). For example, the volume fraction of dispersoids after 3C is 1.8 vol. %, which is much higher than the 1.0 vol. % after C3 (Table 2). The higher volume fraction of dispersoids after “PH” can be attributed to the higher availability of supersaturated Mn compared to “HP”. During “PH”, almost all the supersaturated Mn can be precipitated in the form of dispersoids in the first step as the “P” treatment, due to its low precipitation temperature followed by a gradual growth in the “H” treatment. On the other hand, when the first “H” treatment is applied during “HP”, not all of these Mn atoms can form the dispersoids, while a portion of them will diffuse to the primary Al6(MnFe) intermetallic particles, especially at higher temperatures [8, 15]. Moreover, it is reported that the initial transformation from Al6(MnFe) intermetallics to α-Al(MnFe)Si intermetallics can occur at 500°C, which consumes Si and decreases the available Si required to form dispersoids [8]. Therefore, fewer dispersoids can precipitate in “HP” than in “PH”.
3.2 Elevated-temperature properties during various heat treatments
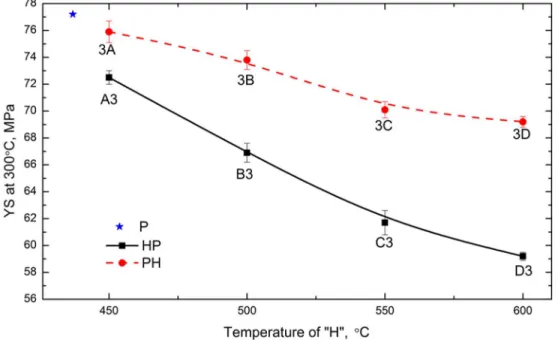
As shown in Figs. 2 and 3, the precipitation behavior of dispersoids is largely related to the specific heat treatment, and large differences have been observed between “PH” and “HP”, which definitely affect the alloy properties. Fig. 4 shows the evolution of YS at 300 °C as a function of the “H” temperature after various heat treatments. It is found that YS is generally lower after both “HP” and “PH” treatments compared with the “P” treatment. However, the YS values are always higher and the descending rate is slower as the “H” temperature increases after the “PH” treatment than the “HP” treatment. For
10
instance, YS is 76 MPa after 3A, which is higher than 73 MPa after A3 at the same “H” temperature. Meanwhile, the YS value decreases by only 6 MPa from 3A to 3C in the “PH” treatment, while it reduces by 11 MPa from A3 to C3 in the “HP” treatment.
Fig. 4 Evolution of YS at 300°C as a function of the “H” temperature after various heat treatments
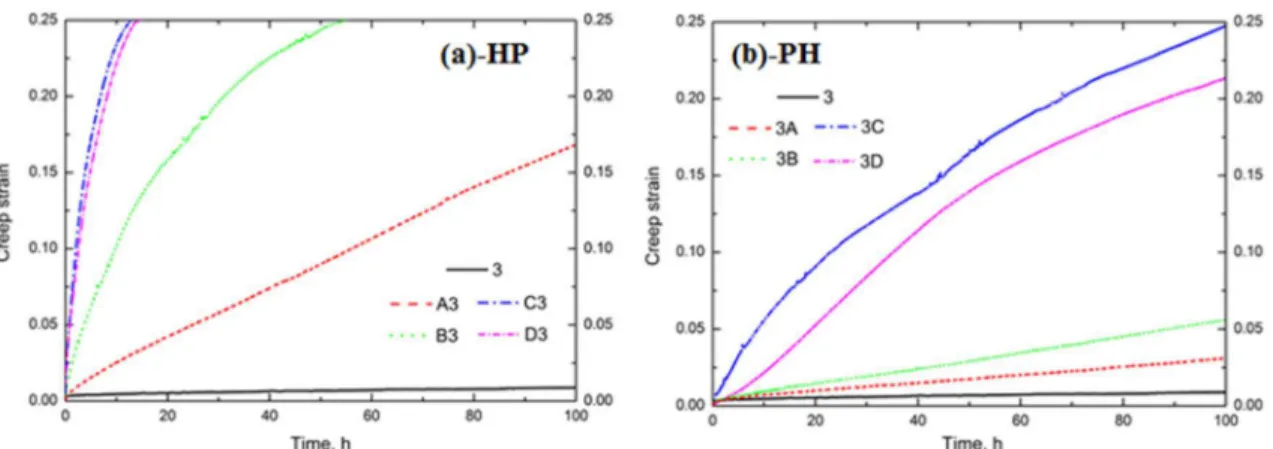
In addition, the creep resistance, which is one of the most significant considerations for elevated-temperature applications [16-18], was studied after various heat treatments, and the results are shown in Fig. 5. One thing to be noted in this work is that the total strain of 0.25 is the limit of the compression creep machine. It is evident that the sample after the “P” treatment (“3” in Fig. 5) exhibits the lowest creep strain, i.e., it has the best creep resistance at 300 °C. Compared with the creep resistance after the “P” treatment, the creep resistance decreases as the “H” temperature increases after both the “HP” and “PH” treatments. The values of the creep strain are much lower in the samples after “PH” (Fig. 5b) than “HP” (Fig. 5a) at any given creep time. In other words, similar to the evolution of YS, the creep resistance is much higher after “PH” than “HP” when treatment is conducted at the same “H” temperature. As shown in Fig. 5, the total creep strain after 100 hours after 3A in the group of “PH” is much lower than that after A3 in the group of “HP”: it is 0.03 in 3A compared to 0.17 in A3. Similarly, in another condition, the total creep strain is only 0.05 in 3C after 10 hours, but it reaches 0.25 in C3 after 10 hours. Moreover, the increasing rate of the creep strain is much lower after “PH” than “HP”, which is clearly shown in Fig. 5.
11
Fig. 5 Typical creep curves of the experimental 3004 alloy after various heat treatments: (a) HP conditions and (b) PH conditions
Generally, the significant difference in the elevated-temperature properties (YS and creep resistance at 300 °C) between “HP” and “PH” is highly related to the evolution of dispersoids during the heat treatments. As shown in Fig. 3 and Table 2, although the average size of dispersoids is similar in “HP” and “PH” at the same “H” temperature, the volume fraction of dispersoids in “HP” is much lower than that in “PH”. For instance, the volume fraction of dispersoids after C3 in the group of “HP” is only 1.0%, while it is 1.8 % after 3C in the group of “PH”. Therefore, the lower volume fractions of dispersoids in the samples after “HP” is the main reason for the worse properties in “HP” than “PH”, according to the Orowan strengthening mechanism [2, 5, 17]. On the other hand, the reduction of the volume fraction of dispersoids after “HP” is more obvious than that after “PH” with increasing “H” temperature. This is mainly attributed to the increasing temperature of the first step as “H”. Due to the exponential increase in the diffusion rate of Mn with temperature [15], the supersaturated level was further eliminated, and more Mn diffused to the intermetallics with increasing “H” temperature [5, 19], leading to the rapid decrease in the available Mn for the subsequent precipitation of dispersoids. As shown in Table 2, the volume fraction of dispersoids it decreases from 2.8% after “P” to 1.4% after B3 and decreases further to 0.4 % after D3 in the “HP” treatment, while it only decreases to 2.2% after 3B and 0.8% after 3D in the “PH” treatment. Hence, the descending rate of the elevated-temperature properties in “HP” is much higher than that in “PH” as the “H” temperature increases.
One interesting thing in Figs. 4 and 5 is that the YS value is similar between 3C and 3D (Fig. 4), and the creep resistance of 3D is even a little higher than that of 3C (Fig. 5) though the volume fraction of dispersoids after 3D (0.8 vol. %) is lower than that after 3C (1.8 vol. %). This indicates that in addition to the dispersoid strengthening, the other strengthening mechanism (solid solution strengthening) may play a role on the YS and creep resistance [20, 21]. In the case of 3C and 3D, it is most likely that the high solid solution in 3D has an effect on the elevated-temperature properties. In the present work, EC is used to evaluate the solid solution level according to the literature [3, 5, 6]. The
12
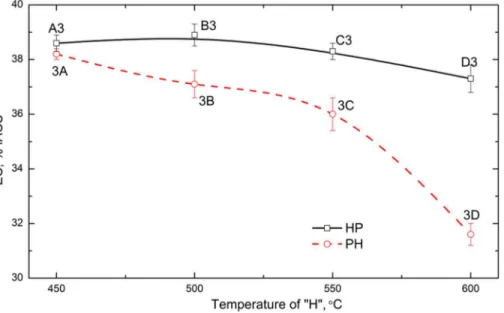
evolution of EC is shown in Fig. 6. In general, the lower EC is, the higher the solid solution level. It is found that a significant reduction of EC occurs after 3C, where EC decreases from 36 %IACS after 3C to 31.7 %IACS after 3D, which is due to the dissolution of dispersoids in the higher temperature treatment of the 3D sample (Fig. 2h). Compared to 3C, the effect of the higher solid solution offsets that of the lower volume fraction of dispersoids in 3D, which results in a similar YS value with 3C [22, 23]. In addition, it has been reported that the increasing solid solution level can also benefit the creep resistance [21, 24]. Therefore, it is reasonable that 3D has a similar or slightly higher creep resistance than 3C. For other conditions, such as 3A and 3B in the group of “PH” or A3 to D3 in the group of “HP”, similar EC values are observed, indicating the presence of similar solid solution levels and therefore, similar solid solution strengthening effects.
Fig. 6 Evolution of the electrical conductivity (EC) during the various heat treatments 3.3 Contribution to the industrial process
To achieve excellent elevated-temperature properties, the presence of a large number of thermally stable dispersoids in the microstructure as the main strengthening phase in the Al-Mn-Mg 3004 alloy is essential. The initial precipitation heat treatment at a relatively low temperature (e.g., 375-400 °C) is necessary to promote a full precipitation of dispersoids, which leads to enhanced mechanical properties and creep resistance. For those evaluated-temperature applications, the traditional high-temperature homogenization in 3xxx alloys cannot be applied, and the high-temperature preheating prior to thermomechanical processes such as extrusion and rolling should be avoided because both high-temperature processes can significantly reduce the elevated-temperature properties. As shown in Figs. 4 and 5, the YS and creep resistance at 300 °C significantly decrease as the “H” temperature increases after “HP” treatments,
13
particularly at 550 to 600 °C. In other words, if the cast ingots and billets were first treated at high temperatures, the materials would lose most of their ability to precipitate the dispersoids.
However, for conventional fabrication processes to make the final products, the preheating of cast ingots and billets at approximately 450-500 °C prior to extrusion and rolling is commonly conducted. The results in the present work demonstrate that, if the materials are first treated at a relatively low temperature for the peak precipitation treatment and then preheated or heat-treated, the materials can still maintain appropriate elevated-temperature properties. As shown in Figs. 4 and 5, although the YS and creep resistance at 300°C also decrease as the “H” temperature increases after “PH” treatments, the decline rate of the YS and creep resistance is much slower than after “HP” treatments due to the combined effect of a higher volume fraction of dispersoids and more solute atoms. When the temperature of “H” during “PH” treatments is controlled not above 500°C, only 5% of YS has been lost with a comparable creep resistance compared to that of the peak precipitation treatment, which is shown in the Alloys 3 and 3B samples in Figs. 4 and 5b. From the microstructural point of view, the volume fraction and size of dispersoids are still acceptable for the dispersion strengthening at elevated temperatures. Therefore, it is feasible to adapt the conventional extrusion and rolling processes with a relatively high pre-heating temperature of up to 500 °C without a remarkable loss of the elevated-temperature properties when materials are first treated with the peak precipitation treatment prior to preheating. On the other hand, it is well known that stable dispersoids can inhibit the recrystallization process and increase the recrystallization temperature in aluminum alloys [25, 26], which can further increase the elevated-temperature properties. The microstructure after extrusion and rolling can be accurately controlled due to the existence of a high volume fraction of dispersoids precipitated in “PH” treatments. Hence, the Al-Mn-Mg 3004 alloy can be more promising for elevated-temperature applications, as it is able to adapt to conventional fabrication processes but still possesses appropriate elevated-temperature properties.
4. Conclusions
(1) Compared to the peak precipitation treatments (“P” at 375°C/48h), the size of dispersoids and the volume fraction of the particle free zone increased, while the volume fraction of dispersoids decreased as the “H” temperature increases during both the “PH” and “HP” treatments. However, the volume fraction of dispersoids after “PH” treatments was higher than that after “HP” treatments at the same “H” temperature.
(2) The elevated-temperature yield strength and creep resistance after “PH” treatments were always higher than that after “HP” treatments at the same “H” temperature. Moreover, the descending rate of the yield strength and creep resistance with increasing “H” temperature is slower after “PH” treatments than after “HP” treatments.
14
(3) For elevated-temperature applications, high-temperature homogenization and high-temperature preheating prior to extrusion and rolling should be avoided. When the “H” temperature during “PH” treatments is controlled not above 500°C, the materials can still maintain appropriate yield strength and creep resistance at 300°C, making it balance between the adaptation to conventional fabrication processes and the maintenance of high elevated-temperature properties for Al-Mn-Mg 3xxx alloys.
Acknowledgments
The authors would like to acknowledge the financial support of the Natural Sciences and Engineering Research Council of Canada (NSERC) and Rio Tinto Aluminum through the NSERC Industry Research Chair in the Metallurgy of Aluminum Transformation at University of Quebec at Chicoutimi.
References
[1] Kamat R. AA3104 can-body stock ingot: Characterization and homogenization. JOM, 48 (1996), pp. 34-38.
[2] Muggerud AMF, Mørtsell EA, Li Y, Holmestad R. Dispersoid strengthening in AA3xxx alloys with varying Mn and Si content during annealing at low temperatures. Mater Sci Eng, A, 567 (2013), pp. 21-28.
[3] Liu K, Chen XG. Development of Al–Mn–Mg 3004 alloy for applications at elevated temperature via dispersoid strengthening. Mater Des, 84 (2015), pp. 340-350.
[4] Li YJ, Muggerud AMF, Olsen A, Furu T. Precipitation of partially coherent
α-Al(Mn,Fe)Si dispersoids and their strengthening effect in AA 3003 alloy. Acta Mater, 60 (2012), pp. 1004-1014.
[5] Li YJ, Arnberg L. Quantitative study on the precipitation behavior of dispersoids in DC-cast AA3003 alloy during heating and homogenization. Acta Mater, 51 (2003), pp. 3415-3428.
[6] Liu K, Chen XG. Evolution of Intermetallics, Dispersoids, and Elevated Temperature Properties at Various Fe Contents in Al-Mn-Mg 3004 Alloys. Metall Mater Trans B, 47B (2015), pp. 3291-3300.
[7] Liu K, Ma H, Chen XG. Enhanced elevated-temperature properties via Mo addition in Al-Mn-Mg 3004 alloy. J Alloys Compd 694 (2017), pp. 354-365.
[8] Alexander DTL, Greer AL. Solid-state intermetallic phase tranformations in 3XXX aluminium alloys. Acta Mater, 50 (2002), pp. 2571-2583.
[9] Du Q, Poole W, Wells M, Parson N. Microstructural modeling of the homogenization heat treatment for AA3XXX alloys. JOM, 63 (2011), pp. 35-39.
[10] Es-Said OS, Zeihen A, Ruprich M, Quattrocchi J, Thomas M, Shin KH, et al. Effect of processing parameters on the earing and mechanical properties of strip cast type 3004 Al alloy. J Mater Eng Perform, 3 (1994), pp. 123-134.
[11] Huang H-W, Ou B-L. Evolution of precipitation during different homogenization treatments in a 3003 aluminum alloy. Mater Des, 30 (2009), pp. 2685-2692.
15
[12] Huang H-W, Ou B-L, Cheng-Ting T. Effect of Homogenization on Recrystallization and Precipitation Behavior of 3003 Aluminum Alloy. Mater Trans 49 (2008), pp. 205-259.
[13] Liu PX, Liu Y, Xu R. Microstructure quantitative analysis of directionally solidified Al-Ni-Y ternary eutectic alloy. Trans Nonferrous Met Soc China, 24 (2014), pp. 2443-2451.
[14] Weibel ER, Elias H. Quantitative methods in morphology. Berlin; New York: Springer-Verlag; (1967).
[15] Du Y, Chang YA, Huang B, Gong W, Jin Z, Xu H, et al. Diffusion coefficients of some solutes in fcc and liquid Al: Critical evaluation and correlation. Mater Sci Eng, A, 363 (2003), pp. 140-151.
[16] Mahmudi R, Kabirian F, Nematollahi Z. Microstructural stability and high-temperature mechanical properties of AZ91 and AZ91+2RE magnesium alloys. Mater Des, 32 (2011), pp. 2583-2589.
[17] Farkoosh AR, Grant Chen X, Pekguleryuz M. Dispersoid strengthening of a high temperature Al–Si–Cu–Mg alloy via Mo addition. Mater Sci Eng, A, 620 (2015), pp. 181-189.
[18] Knipling KE, Dunand DC, Seidman DN. Criteria for developing castable, creep-resistant aluminum-based alloys - A review. Z METALLKD, 97 (2006), pp. 246-265. [19] Li YJ, Arnberg L. Evolution of eutectic intermetallic particles in DC-cast AA3003 alloy during heating and homogenization. Mater Sci Eng, A, 347 (2003), pp. 130-135. [20] Chen R, Xu Q, Jia Z, Liu B. Precipitation behavior and hardening effects of Si-containing dispersoids in Al–7Si–Mg alloy during solution treatment. Mater Des, 90 (2016), pp. 1059-1068.
[21] Miresmaeili SM, Nami B. Impression creep behavior of Al-1.9%Ni-1.6%Mn-1%Mg alloy. Mater Des, 56 (2014), pp. 286-290.
[22] Huskins EL, Cao B, Ramesh KT. Strengthening mechanisms in an Al–Mg alloy. Mater Sci Eng, A, 527 (2010), pp. 1292-1298.
[23] Park D, Morris JG. The tensile deformation behavior of AA 3004 aluminum alloy. Metall Mater Trans A, 25 (1994), pp. 357-364.
[24] Kazantzis AV, Chen ZG, De Hosson JTM. Deformation mechanism of aluminum– magnesium alloys at elevated temperatures. J Mater Sci, 48 (2013), pp. 7399-7408. [25] Hichem F, Rebai G. Study of dispersoid particles in two Al–Mg–Si aluminium alloys and their effects on the recrystallization. Appl Phys A, 119 (2015), pp. 285-289. [26] Shi C, Chen XG. Effect of vanadium on hot deformation and microstructural evolution of 7150 aluminum alloy. Mater Sci Eng, A, 613 (2014), pp. 91-102.