HAL Id: hal-02305663
https://hal.uca.fr/hal-02305663
Submitted on 10 Dec 2019
HAL is a multi-disciplinary open access
archive for the deposit and dissemination of sci-entific research documents, whether they are pub-lished or not. The documents may come from teaching and research institutions in France or abroad, or from public or private research centers.
L’archive ouverte pluridisciplinaire HAL, est destinée au dépôt et à la diffusion de documents scientifiques de niveau recherche, publiés ou non, émanant des établissements d’enseignement et de recherche français ou étrangers, des laboratoires publics ou privés.
measurements of 142,143 Nd/ 144 Nd isotope ratios by
TIMS
Christian Pin, Abdelmouhcine Gannoun
To cite this version:
Christian Pin, Abdelmouhcine Gannoun. Miniaturized, rapid separation of neodymium from ultra-mafic and chondritic samples prior to high precision measurements of 142,143 Nd/ 144 Nd isotope ratios by TIMS. Journal of Analytical Atomic Spectrometry, Royal Society of Chemistry, 2019, 34 (10), pp.2136-2146. �10.1039/c9ja00272c�. �hal-02305663�
Miniaturized, rapid separation of Neodymium from ultramafic
and chondritic samples prior to high precision measurements of
142,143
Nd/
144Nd isotope ratios by TIMS
Christian Pina and Abdelmouhcine Gannounb
Abstract
An improved method is described for isolating Nd from challenging silicate materials. After a short dissolution with hydrofluoric acid, the 1-2 gram sample is subjected to a protracted treatment with nitric and hydrochloric acid at mild temperature. Then, the sample is taken up in 15-20 ml of 1M HNO3. Residual fluorides are isolated by centrifugation, and decomposed with boric acid. Ascorbic acid is added to reduce Fe(III) to Fe(II) and the solution is loaded onto a small column containing 1.5 ml of TRU extraction chromatography (EXC) resin, to extract the REE + Th and U. The LREE are stripped by using 3M HCl and directly loaded onto the next, on-line column filled with 1 ml of DGA EXC resin which achieves the separation of Nd from Sm, and from the bulk of Ce and Pr. Neodymium is stripped with 0.006M HCl onto a 1 ml column of LN2 EXC resin for further purification from residual Ce and Pr. By virtue of small EXC columns and reagents permitting direct cross-over from a column to the next one, this scheme does not involve evaporation steps, and can be performed in about 12 hours, with good Nd yields and negligible blanks. The method is validated by the analysis of depleted basic and ultra-basic rocks, and a sample of the Allende carbonaceous chondrite. Compared with previous methods used to process difficult samples, this protocol is drastically down-scaled, relatively simple to implement, and much less demanding in terms of analyst time, reagent volumes, and costs.
a Géologie, CNRS & Université Clermont-Auvergne, Campus des Cézeaux, 6 avenue Blaise Pascal, 63 178 Aubière Cedex, France
b Laboratoire Magmas et Volcans, Université Clermont Auvergne, CNRS UMR 6524, OPGC-IRD, F-63000, Clermont-Ferrand, France
3 4 5 6 7 8 9 10 11 12 13 14 15 16 17 18 19 20 21 22 23 24 25 26 27 28 29 30 31 32 33 34 35 36 37 38 39 40 41 42 43 44 45 46 47 48 49 50 51 52 53 54 55 56 57 58 59 60
1 Introduction
The determination of neodymium isotope ratios in LREE-poor samples of ultramafic bulk composition is a challenging task. This is particularly true when 142Nd/144Nd ratios are to be measured. In this case indeed, counting statistics constraints necessitate obtaining 0.5-1 µg of Nd in a highly purified form to achieve the degree of precision required to detect isotopic anomalies at the few ppm level.1 In order to fulfill this requirement, large samples, one gram or more, need to be processed, while keeping Nd chemical yield as elevated as possible. This puts stringent constraints on both the sample dissolution procedure and the separation scheme which needs to accommodate a large volume of starting solution.
Different strategies have been proposed in an attempt to circumvent the potentially poor chemical recovery caused by the formation of insoluble, Mg-rich, complex fluorides which may sequester large amounts of LREE.2,3 These include the removal, prior to dissolution with hydrofluoric acid, of as much as possible magnesium by leaching the sample powder with HCl at elevated temperature4,5, and the treatment of sparingly soluble compounds formed during the hydrofluoric acid dissolution step with boric acid or a solution of an Al salt.2,5 Cation-exchange chromatography is most often used to perform the isolation of the REE from matrix elements, but the inherent lack of selectivity of such technique requires using columns commensurate to the amount of sample processed. This is made by up-scaling the size of the cation-exchange columns, filled with 20 ml6 or more of resin. Alternatively, the sample solution is split into several aliquots, each corresponding to 150-200 mg of sample, which are passed through as many conventional columns (which typically contain 10 ml of cation-exchange resin each), and then combining the LREE-bearing fractions in order to process a single sample. Repeated passes through a small column have also been used.7 These approaches are time-consuming (e.g., some 10 hours)8 and they necessitate copious amounts of relatively strong acid, first for getting rid of the unwanted elements (e.g., 95 mL of 2.5M HCl9), and then for stripping the REE from the columns (e.g., 60 mL of 4N HCl). Before the subsequent separation of Nd from accompanying trace elements, it is therefore necessary to evaporate to dryness large volumes of strong acid, a procedure which is lengthy and far from being friendly with the environment.
Prior to the cation-exchange separation step, it is possible to reduce the amount of magnesium through precipitation, in slightly basic medium, of iron and aluminum as their hydroxides, which act as carriers for tri- and tetravalent trace elements, while Mg and Ca should remain in
3 4 5 6 7 8 9 10 11 12 13 14 15 16 17 18 19 20 21 22 23 24 25 26 27 28 29 30 31 32 33 34 35 36 37 38 39 40 41 42 43 44 45 46 47 48 49 50 51 52 53 54 55 56 57 58 59 60
solution. Then, the hydroxide precipitate is isolated by filtration or centrifugation, and dissolved with HCl in view of the subsequent separation of the REE by cation-exchange.10,11 In some cases, iron is removed by using solvent extraction with di-ethyl ether prior to cation-exchange.5 These procedures based on hydroxide precipitation involve ammonia as an additional reagent, are cumbersome if batches of several samples are to be processed, and require highly skilled analysts to achieve a clean separation from Mg, because the bulky hydroxide precipitate tends to include droplets of solution containing many of those elements which partitioned into the supernatant.
In this paper, we describe how to perform the isolation of LREE from large volumes of (ultra-) mafic sample solutions by taking advantage of suitable extracting agents offering a far better selectivity than cation-exchange resins. A small (1.5 ml) column of an extraction chromatography resin is used to isolate the LREE (+ Th and U) from the major elements, especially Mg, and unwanted trace elements, which all pass through the column during the loading and early rinsing steps. Then, the LREE are stripped with a small volume of acid and processed on-line, without intervening evaporation, through a tandem column extraction chromatography scheme modified from our previous work.12 In this way, a Nd fraction purified from any Ce and Sm interfering isotopes, and suitable for high precision TIMS measurements of 142Nd/144Nd and 143Nd/144Nd isotope ratios is obtained from notoriously difficult matrices, at a strongly reduced cost in terms of time, analyst labour, and reagent volumes.
2 Experimental
2.1. Chemicals, labware, extraction chromatographic materials, and instrumentation
All the chemicals (H2O, HF, HNO3, HCl, H3BO3, ascorbic acid), the labware, the three commercially available extraction chromatography resins (TRU resin, DGA resin, and LN2 resin, supplied by Triskem International, Bruz, France), and the ICP- and thermal ionisation- mass spectrometers used in this study were identical to those employed in our earlier work12 . The only difference was the use of zone-refined Re ribbon (99.999%) instead of regular grade
3 4 5 6 7 8 9 10 11 12 13 14 15 16 17 18 19 20 21 22 23 24 25 26 27 28 29 30 31 32 33 34 35 36 37 38 39 40 41 42 43 44 45 46 47 48 49 50 51 52 53 54 55 56 57 58 59 60
Re filament (H. Cross Co, Moonachie, N.J., USA). Isotope ratio measurements were made with a Triton TI thermal ionization mass spectrometer operated in the static multi-collection mode following methods described elsewhere.12Twenty-seven blocks of data, each consisting of 20 cycles of 8 seconds, were collected, with baseline measurements before each block during 30 integrations of 1 second, after deflection of the ion beam in the ion source. Between each block, the “amplifier rotation” function was used to interchange, by means of a relay matrix, the connections between the 9 collectors and the 9 amplifiers in order to cancel relative differences of amplifier gains. After correction for any residual isobaric interference of 142Ce on 142Nd and 144Sm on 144Nd, the raw isotope ratios were corrected for mass fractionation by using the empirical exponential “law” and 146Nd/144Nd = 0.7219 as the reference ratio.
2.2. Chromatographic columns
Aliquots of 500 mg of TRU resin were slurried in 0.05M HNO3 and poured into ca. 7.5 mm i.d. polystyrene columns fitted with a 15-45 µm polyethylene filter at the bottom (5-inch chromatography columns, Caplugs Evergreen, Buffalo, N.Y., U.S.A.), thereby making a ca. 32 mm high resin bed. This is the first EXC column, used for the initial separation of the LREE from major and most trace elements. The further separation steps aiming to isolate and further purify the Nd fraction involved the same EXC columns as those (based on LN2 and DGA resins, respectively) used in our previous work.12 Both columns consist of disposable polyethylene pipettes (Bio-Rad DPTP Style E, ) ca. 4 mm i.d. and ca. 80 mm length, filled with 350 mg of LN2 and DGA resins, respectively with polyethylene frits at the bottom and on top of the resin bed. However, in this case, they were configured in a reverse order, that is, the DGA column ahead from the LN2 column.
2.3. Chemical procedure
2.3.1. Sample digestion: Carbonaceous chondrites, such as the sample of the Allende meteorite analysed in this work, contain copious amounts of organic molecules which are not fully decomposed during the acid dissolution of the mineral components. The resulting organic residue is rather intractable, and not easy to isolate from the rest of the sample. This results in “dirty” solutions which are not ideal for chemical separation work. In order to alleviate this problem, it was decided to destroy the organic matter physically, prior to sample
3 4 5 6 7 8 9 10 11 12 13 14 15 16 17 18 19 20 21 22 23 24 25 26 27 28 29 30 31 32 33 34 35 36 37 38 39 40 41 42 43 44 45 46 47 48 49 50 51 52 53 54 55 56 57 58 59 60
dissolution. The powdered sample of Allende was placed in a loosely covered porcelain crucible and ignited at 550 °C during two hours in a muffle furnace. After this treatment, the solution left after the acid dissolution was free of blackish material. The other sample powders were used as received. One gram to 1.5 g of powder is weighted in a 60 mL PFA jar, wetted with 10 mL of 7M HNO3 followed by 10 mL of 29M HF. The PFA vessel is closed and heated on a hot plate at 100°C during 20 minutes. Then, the jar is opened, and the fluoride slurry left after the reaction with HF is diluted with 10 mL of 7M HNO3 and gently evaporated to near dryness (50°C). Ten mL of 6M HCl are added to the moist residue, and again slowly evaporated to near dryness at 50°C. This treatment is repeated with 10 mL of 7M HNO3, before the final salt residue is taken up with 12 to 20 mL of 1M HNO3, and centrifuged in order to isolate the resulting solution from sparingly soluble fluorides which survived the previous treatments. These are broken down with up to 5 mL of a 1M HNO3 solution saturated in boric acid in an ultrasonic bath heated at 80°C, and the resulting solution is centrifuged to get rid of insoluble grains of Cr-spinel and recover the supernatant that is combined with the bulk sample solution.
2.3.2. Column separation
Before separation, ascorbic acid (100 to 600 mg, depending on the concentration of iron in the sample) is added as a reducing agent13 until a test for Fe (III) with a 1 M aqueous solution of ammonium thiocyanate gives a faint rose colour. Then, the solution is loaded portion-wise (e.g., 5 mL per 5 mL) onto the TRU column, before a final rinse of the PFA jar and the column reservoir with twice 1 mL of fresh 1M HNO3. Following this loading step, during which matrix elements are essentially not extracted, the unwanted residual elements and mildly retained HREE are removed from the column with the following succession of more and more dilute nitric acid solutions: 1M HNO3 (2 mL), 0.5M HNO3 (2 mL), 0.25 M HNO3 (1.5 mL), and finally 0.125M HNO3 (2.5 mL).
Then, the eluting solution is switched to 3M HCl, in order to strip the LREE from the TRU column and concomitantly load them onto the next, on-line DGA column. The first 0.75 mL, containing the interstitial 0.125M nitric acid left from the previous step are discarded. At this point, the TRU column is put on top of the DGA column (previously conditioned with 0.5 mL of 3M HCl), and the LREE are eluted from the TRU column with 4 x 0.5 mL of 3M HCl and simultaneously sorbed onto the DGA column (1st tandem configuration of Fig. 1 and Table 1).
3 4 5 6 7 8 9 10 11 12 13 14 15 16 17 18 19 20 21 22 23 24 25 26 27 28 29 30 31 32 33 34 35 36 37 38 39 40 41 42 43 44 45 46 47 48 49 50 51 52 53 54 55 56 57 58 59 60
Following this combined TRU stripping / DGA loading step, the columns are decoupled, and the procedure continues on the DGA column, in order to separate Nd from most of the accompanying LREE (La, Ce, and Pr on the one hand, Sm, Eu and Gd on the other). First, the DGA reservoir is rinsed with 0.5 mL of 0.1M HNO3. Then, La-Ce-Pr are eluted with 3 mL of 0.05M HNO3 followed by 3.5 mL of 0.03M HNO3, 2 mL of 0.025M HNO3 and finally 0.5 mL of 0.025M HNO3.
At this stage, the LN2 column is pre-conditioned with 0.5 mL of 0.006M HCl and positioned below the tip of the DGA column (2nd tandem of Fig. 1 and Table 1) in order to strip Nd from the DGA column and immediately collect it on top of the LN2 column. This is made by means of 2 mL of 0.006M HCl.
The DGA and LN2 columns are decoupled, and processed as follows: If Sm is needed, it can be eluted from the DGA column with 1 mL of 0.1M HCl, before the column cleaning procedure is started, in preparation of further uses, such as an optional, final clean-up of the Nd fraction (see hereafter).
After rinsing its reservoir with 0.1 mL of 0.05M HNO3 the LN2 column is used to purify the Nd eluted from the DGA column from accompanying traces of Ce and Pr left from the tail of their respective elution peaks. This is made by passing through the column 2.6 mL of 0.08M HNO3, then 0.1 mL of 0.10M HNO3, before Nd is stripped with 3 mL of 0.15M HNO3. In case of measurements by MC-ICP-MS, this solution could be used directly. In this work, it was evaporated to dryness in preparation to isotope analyses by TIMS.
Optionally, the Nd separated in this way can be further purified on-line by means of a second, on-line pass through the DGA column preconditioned with 1 mL of 0.2M HNO3. Following the loading step with 3 ml 0.15M HNO3, 3.5 ml of 2M HCl are passed through the column to get rid of unwanted residual elements, before a purified Nd cut is obtained with 3 mL of the same acid (Table 1).
3 Results
3.1. SamplesTwo international references materials representative of highly depleted oceanic basalts (BIR-1, prepared and distributed by the U.S. Geological Survey, Reston, Va) and ultramafic rock
3 4 5 6 7 8 9 10 11 12 13 14 15 16 17 18 19 20 21 22 23 24 25 26 27 28 29 30 31 32 33 34 35 36 37 38 39 40 41 42 43 44 45 46 47 48 49 50 51 52 53 54 55 56 57 58 59 60
(UB-N, prepared by A.N.R.T. and obtained from S.A.R.M.-CR.P.G., Nancy, France) were analysed. In addition, two samples of komatiitic basalt from the Barberton (Rep. of South Africa) and the Abitibi (Québec, Canada) greenstone belts kindly donated by Prof. H. Martin and Prof. C. Nicollet (both from Clermont), respectively, were processed to evaluate the separation protocol for processing samples very rich Mg and/or Fe. Finally, a sample taken from the Allende carbonaceous meteorite, kindly supplied by Prof. K.W. Burton (Durham University) was analysed in order to demonstrate the applicability of the method to extra-terrestrial samples in which 142Nd isotope anomalies are most prominent. Selected major and trace element data corresponding to these samples are given in Table 2.
3.2. Isotope ratios measurements
The full Nd isotope compositionsmeasured by TIMS in the static multi-collection mode are listed in Table 3. These include 142Nd/144Ndratios, potentially affected by the extinct decay of the short-lived 146Sm (half-life ~ 68 Ma)14 into 142Nd,and 143Nd/144Nd ratios, reflecting the time-integrated in-growth of 143Nd produced by the alpha decay of 147Sm (half-life = 106 Ga), while the rest of the isotope ratios are constant in nature. It can be seen that within-run precisions, ranging from 3 to 9 ppm and from 2 to 8 ppm (2 RSD) were achieved for 142Nd/144Nd and 143Nd/144Nd, respectively. These are within a factor of two, or better, of those obtained for the chemically pure international standard JNdi-1 and our shelf standard AMES. External precisions expressed by the RSDs of 3 or 4 replicate analyses are in general within a factor of 2 of the within-run precisions, documenting the good overall reproducibility of the whole procedure. Further, the accuracy can be judged from the fair agreement of the 143Nd/144Nd ratios measured in this work for BIR-1 with the range of values reported in the literature for this SRM.15 There is no compiled value of 143Nd/144Nd for UB-N, the other international SRM analysed in this work, but our results are in excellent agreement with two published TIMS values of 0.512926 ± 6 and 0.512925 ± 6, respectively.16 Moreover, our data plot within the range of values reported most recently for these two SRMs.17 The interferences of 142Ce on 142Nd and 144Sm on 144Nd are reduced to the 1-4 ppm and <0.2 ppm levels, respectively, similar to those measured in the JNdi-1 and AMES high purity Nd standards. In all but one terrestrial rocks, no significant 142Nd anomaly is found, while a faint negative anomaly (µ142Nd=-7.2 ± 3.1) is suggested for the ca. 3.5 Ga old komatiite of the Barberton greenstone belt. Our sample of the Allende meteorite displays a strongly negative µ142Nd of -62 ± 10, further extending towards the non radiogenic side the range of values measured so far for this carbonaceous chondrite.18 The other isotope ratios involving non radiogenic
3 4 5 6 7 8 9 10 11 12 13 14 15 16 17 18 19 20 21 22 23 24 25 26 27 28 29 30 31 32 33 34 35 36 37 38 39 40 41 42 43 44 45 46 47 48 49 50 51 52 53 54 55 56 57 58 59 60
isotopes, 145Nd/144Nd, 148Nd/144Nd, and 150Nd/144Nd are very consistent, and identical within errors to those measured in the Nd standards, further demonstrating that the degree of purity achieved by the separation protocol is suitable for high precision isotope ratio measurements.
3.3 Chemical yield and procedural blanks
Overall Nd recoveries were estimated by comparing the amounts of Nd obtained in the final cut to those anticipated from consensus values (geostandards BIR-1 and UB-N) or values measured at SARM-CRPG (Nancy, France) by using standard methods based on LiBO2 fusion and ICP-QMS measurement,19 or our published values for Allende.18 These ranged from 70% to nearly quantitative (Table 4). It is noteworthy that the lowest yields were obtained for the two komatiitic basalt samples, which were processed before their major and trace element composition was available. These rocks, and especially the Abitibi sample, proved to be much richer in Nd than anticipated, resulting in a gross overloading of the columns. It is inferred that this inadvertent overload caused severe peak broadening on the DGA and LN2 columns, thereby causing a strong decrease of the Nd recovery. Total procedural blanks lower than 50 pg were achieved (Table 5), quite negligible with respect to the amount of Nd processed.
4 Discussion
4.1. Sample dissolution
In order to cope with mafic and ultramafic samples which contain much more Mg than common silicate rocks, the standard HF-HNO3 procedure was slightly modified, in an attempt to limit the formation of insoluble fluorides which are likely to sequester a significant proportion of the small amounts of LREE present in these incompatible element depleted rock-types, thus leading to poor Nd yield. Firstly, the duration of the initial dissolution at elevated temperature was reduced to 20 minutes only, in order to prevent the growth of “old and strong” fluorides which would be more difficult to break-down during the subsequent treatments with nitric and hydrochloric acid, which are known to be poorly efficient for that purpose.2 Indeed, the use of much better accompanying acids with high boiling temperatures such as perchloric or sulfuric acid was not possible in our laboratory. It was found that this short dissolution at 100°C was quite sufficient to “open-out” the mineral assemblages of the samples analysed (as indicated by the discoloration of the sample powder to a whitish fluff). Secondly, the slurry of sparingly soluble fluorides left in the excess HF-HNO3 mixture after
3 4 5 6 7 8 9 10 11 12 13 14 15 16 17 18 19 20 21 22 23 24 25 26 27 28 29 30 31 32 33 34 35 36 37 38 39 40 41 42 43 44 45 46 47 48 49 50 51 52 53 54 55 56 57 58 59 60
the dissolution was immediately diluted to a large volume with nitric acid, and with hydrochloric acid in a subsequent stage, in order to reduce the concentration of the fluoride ion in the solution during a protracted evaporation at mild (50°C) temperature, while avoiding to bring the sample salts to complete dryness. Albeit quite tedious, this treatment enabled us to keep to a relatively small volume the precipitate obtained when the final 1M HNO3 solution was centrifuged prior to the chromatographic column procedure. The precipitate was dissolved by the action of a few ml of 1M HNO3 saturated in boric acid in an ultrasonic bath, isolated from any insoluble Cr-spinels by centrifugation, and combined with the bulk solution.
4.2. Extraction chromatography
4.2.1 First separation of the LREE from matrix elements
Extraction chromatography (EXC) is much better suited than conventional cation-exchange (CE) for isolating trace elements from large amounts of matrix elements. This is because, with a proper choice of the active extracting agent, only a few trace elements (ideally, only the target element, in so far as a highly specific molecule is identified and can be used to prepare an EXC material) are extracted while the rest of the elements pass through the column without any interaction with the EXC resin (Fig. S1). This is the case for Al, Ca, and particularly Mg with the TRU resin, in obvious contrast with CE resins which adsorb, to a variable degree, all the cations contained in the sample solution, thereby necessitating the use of larger and larger amounts of resin as the sample size is increased. This is especially obvious when very large samples are to be processed to palliate their very low concentration of the trace element of interest. With EXC, instead, the amount of specific resin required needs to be commensurate to the quantity of trace element of interest. As a matter of fact, the only practical limitation to this tremendous advantage is the necessity to handle the large volume of acid required to bring in solution the large sized sample. Indeed, it is necessary to use columns with relatively high flow rates in order to keep loading times of such large volumes to reasonable durations. This precludes the use of the narrow bore columns which are routinely used when the sample solution does not exceed a few milliliters. Extraction resins embedded within flat filters might offer an elegant alternative to columns in this case20, but as far as we are aware, no such material is commercially available for a selective extraction of the Lanthanides. Accordingly, an up-scaled version of the well established TRU resin was used.21-23 Specifically, commercially available, disposable polystyrene columns with ca. 7.5 mm i.d. were used
3 4 5 6 7 8 9 10 11 12 13 14 15 16 17 18 19 20 21 22 23 24 25 26 27 28 29 30 31 32 33 34 35 36 37 38 39 40 41 42 43 44 45 46 47 48 49 50 51 52 53 54 55 56 57 58 59 60
instead of the 4 mm i.d. columns used in our previous works. This allowed 15 ml to be loaded within some 45 minutes. Besides this simple column up-scaling, the elution protocol was largely modified. First, instead of using 1M HNO3 throughout the column washing step, a sequence of nitric acid of decreasing strength (from 1M to 0.125M) was passed through the column, in order to improve the stripping of unwanted residual major elements and heavy REE. Secondly, the LREE were stripped from the column by using 3M HCl instead of very dilute (0.05M) nitric acid as used in previous studies. This is a significant change, which provides a sharper elution peak compared to the usual 0.05M HNO3 strip, which shows rather significant tailing. Importantly, this change of stripping medium of the first column requires a major modification, in fact, an overturn, of the subsequent separation protocol, namely, using the DGA resin for the early separation of Nd, instead of the LN2 resin as done in our previous method. This is because the LN2 resin (and the classical LN resin as well) acts as a cation exchanger, able to extract the LREE only from very dilute HNO3 or HCl solutions. Accordingly, the LN2 column cannot be used in tandem with a TRU column in this case. However, the DGA resin is able to strongly extract the Lanthanides, not only from nitric acid solutions of almost any strength, but also from relatively strong HCl.24 For this reason, it can be used in the second on-line column, downstream from the TRU column, when this is stripped from the LREE with 3M HCl. An additional benefit of this new TRU-DGA tandem elution step is an improved removal of the last traces of Fe and Ti. Iron (III) and titanium are indeed the only major elements which are extracted to a limited, but not entirely negligible extent by the TRU resin from 1M HNO3 medium25 (D = 5 and 7, respectively). Both elements accompany the LREE during their stripping with 0.05M HNO3, and would be extracted on, and subsequently “leak” from the next, on-line LN2 column. In contrast, any Fe(III) remaining on the TRU column will still be held by the resin if the LREE are stripped by using 3M HCl.25 Residual Ti (IV) is eluted along with the LREE, but this element is not extracted by the forthcoming DGA resin from both HCl and HNO3 media (D < 3 for all concentrations).24 This allows a better purification of Nd to be achieved from those two major elements which are potentially problematic for the TRU column.
4.2.2 Isolation and further purification of neodymium
The gross separation of Nd from the adjacent LREE is achieved by using the DGA resin which, just as the LN or LN2 resins, has an increasing affinity for individual Ln (III) elements as their atomic number increases. Accordingly, for both resins, the REE are eluted from the light to the heavy ones, either in HCl or HNO3 media24,26, with broadly similar separation
3 4 5 6 7 8 9 10 11 12 13 14 15 16 17 18 19 20 21 22 23 24 25 26 27 28 29 30 31 32 33 34 35 36 37 38 39 40 41 42 43 44 45 46 47 48 49 50 51 52 53 54 55 56 57 58 59 60
factors between Ce and Nd, and Pr from Nd, respectively.27 However, in contrast with LN resins, more and more dilute, instead of stronger and stronger acid, is required to strip Ln’s of increasing atomic number, with the practical limitation that the HREE still have very high D’s even in extremely dilute nitric acid24 (e.g., D > 500 in 0.05M HNO
3). In this respect, it is beneficial that the TRU column permits to get rid of the HREE before coupling with the DGA column. An excellent separation of Nd ahead from Sm is easily achieved with the DGA column (Fig. S2), but some unavoidable tailing of the Ce and Pr peaks occurs and lends to significant contamination of the Nd cut, therefore necessitating a further purification step in case 142Nd/144Nd ratios are to be measured. This is accomplished without intervening evaporation by means of a second, DGA-LN2 column tandem, permitted by the very dilute acid (0.006M HCl) used to strip Nd from the DGA resin, which is compatible with its forthcoming extraction by the LN2 resin.
Although Nd isolated in this straightforward way (total duration of the separation: about 12 hours, to be compared with the 3-4 days typically needed by previous methods8) gave satisfactory thermal ionization mass spectrometric runs (Table 3), a further on-line clean-up can easily be implemented by immediately recycling the Nd fraction through the reconditioned DGA column to perform an additional purification stage (Table 1). In this way, the 142Ce contribution to the 142Nd signal was further reduced by a factor of three, and perhaps more interestingly, more intense ion beams were obtained in most cases (Fig. 2), suggesting a significant improvement of the overall purity of Nd from those foreign elements which have an adverse effect on the production of thermal ions.
5 Summary and Conclusion
This work elaborates on a recently published12 triple tandem separation scheme entirely based on extraction chromatography, enabling the analyst to isolate Nd in a form sufficiently pure to be used to determine 143Nd/144Nd and 142Nd/144Nd isotope ratios by Thermal Ionisation Mass Spectrometry. This previous procedure was designed for processing ~100 mg-sized samples of common silicate rocks. Here, the method has been modified in order to make it possible to analyse much larger and challenging samples, namely, chondritic materials and ultramafic, LREE-depleted, Mg-rich rocks. Specifically, the acid dissolution protocol has been modified to a “soft” version, with strongly shortened HF dissolution duration, and mild subsequent treatments, in order to limit the formation of those fluoride compounds which cause poor
3 4 5 6 7 8 9 10 11 12 13 14 15 16 17 18 19 20 21 22 23 24 25 26 27 28 29 30 31 32 33 34 35 36 37 38 39 40 41 42 43 44 45 46 47 48 49 50 51 52 53 54 55 56 57 58 59 60
chemical recoveries. More significantly, the separation scheme has been largely reworked, by using an up-scaled column (albeit still at least an order of magnitude smaller than commonly used counterparts based on cation-exchange) filled with 1.5 ml TRU EXC resin to get rid of matrix and unwanted trace elements by using a new elution protocol. After column rinsing with dilute nitric acid of decreasing strength, the LREE are stripped with 3M hydrochloric acid instead of 0.05M nitric acid, and directly loaded on a column of DGA EXC resin which performs the separation of Nd from adjacent LREE. Nd is then eluted onto the next column of LN2 EXC resin, providing Nd sufficiently purified from Ce and Sm for high precision 143Nd/144Nd and 142Nd/144Nd isotope ratio measurements. In so far as the DGA and LN2 columns are not overloaded, Nd recoveries in the 90% range are achieved. The whole separation procedure can be performed in a single, albeit long (12 hours) working day. For an even better purity, the Nd fraction can be further cleaned-up on-line by means of a second pass through the DGA column. Evaporation steps are totally eliminated throughout the separation, by virtue of the systematic use of columns arranged in tandems, considerably reducing the overall duration of the separation process. Compared with conventional methods based on large columns of cation-exchange resin for removing matrix elements, and involving the oxidation of Ce to the +4 state for making its separation from Nd easier, this triple extraction chromatographic protocol is drastically down-scaled, relatively simple to implement, and much less demanding in terms of analyst time, reagent volumes, and costs.
Conflicts of interest
There are no conflicts to declare
Acknowledgements
We are very grateful to Dr Aude Bombard (Triskem International) for kindly donating samples of LN2 resin. We also thank Jean-Luc Piro and Delphine Auclair for maintaining in a very good condition the Agilent 7500 ICP-QMS and the Triton TIMS, respectively, Chantal Bosq for preparing high purity acids and Krzysztof Suchorski for monitoring reagent blanks. We thank the Geological Survey of Japan for providing the isotopic standard JNdi‐1. The manuscript benefited from the reports of two anonymous referees, and particularly from a
3 4 5 6 7 8 9 10 11 12 13 14 15 16 17 18 19 20 21 22 23 24 25 26 27 28 29 30 31 32 33 34 35 36 37 38 39 40 41 42 43 44 45 46 47 48 49 50 51 52 53 54 55 56 57 58 59 60
perceptive adjudicative review by Ryan Ickert (Purdue University) which are gratefully acknowledged. We thank Matthew Bown for editorial handling. C.P. thanks the ClerVolc "Laboratoire d'Excellence" for a conditional, albeit modest, grant. This is Laboratory of Excellence ClerVolc contribution number XXX.
References
1 R.W. Carlson, Chapter 15.18, 337-354. in: Treatise on Geochemistry, 2nd edition, 2014, Elsevier.
2. Sulcek, Z. & Povondra, P. (1989) Methods of Decomposition in Inorganic analysis. CRC Press: Boca Raton (Florida), 325 pp.
3 R.H. Boer, G.J. Beukes, F.M. Meyer and C.B. Smith, Chem. Geol., 1993, 104, 93-98 4 T. Shibata and M. Yoshikawa, J. Mass Spectrom. Soc. Japan, 2004, 52, 317-324. 5 C. Frisby, M. Bizimis and S. Mallick, Chem. Geol., 2016, 440, 40-72.
6 N.S. Saji, D. Wielandt, C. Paton and M. Bizzarro, J. Anal. Atom. Spectrom., 2016, 31, 1490-1504.
7 S. Kagami and T. Yokoyama, Anal. Chim. Acta, 2016, 937, 151-159.
8 M. Garçon, M. Boyet, R.W. Carlson, M.F. Horan, D. Auclair and T.D. Mock, Chem. Geol., 2018, 476, 493-514.
9 M. Boyet and R.W. Carlson, Science, 2005, 214, 427-442.
10 M. Sharma, G.J. Wasserburg, D.A. Papanastassiou, J.E. Quick, E.V. Sharkov and E.E. Laz’ko, Earth Planet. Sci. Lett., 1995, 135, 101-114.
11 M. Sharma and G.J. Wasserburg, Geochim. Cosmochim. Acta, 1996, 60, 4537-4550. 12 C. Pin and A. Gannoun, J. Anal. Atom. Spectrom., 2019, 34, 310-318.
13 G.G. Rao and V.N. Rao, Fres. Z. anal. Chemie, 1955, 147, 338-347. 14 M. Kinoshita and 18 others, Science, 2012, 335, 1614-1617.
15 GeoReM Data Base; http://georem.mpch-mainz.gwdg.de
16 C. Pin and J.F. Santos Zalduegui, Anal. Chim. Acta, 1997, 339, 79-89
17 Z. Chu, M. Wang, C. Li, Y. Yang, J. Xue, W. Wang and J. Guo, J. Anal. Atom. Spectrom., 2019, DOI: 10.1039/C9JA00200F
18 A. Gannoun, M. Boyet, H. Rizo and A. El Goresy, Proc. Nat. Acad. Sci, 2011, 108, 7693-7697.
19 J. Carignan, P. Hild, G. Mevelle, J. Morel, and D. Yeghicheyan, 2001, Geostandards Newlett., 25, 187-198. 3 4 5 6 7 8 9 10 11 12 13 14 15 16 17 18 19 20 21 22 23 24 25 26 27 28 29 30 31 32 33 34 35 36 37 38 39 40 41 42 43 44 45 46 47 48 49 50 51 52 53 54 55 56 57 58 59 60
20 S. Joannon and C. Pin, J. Anal. Atom. Spectrom., 2001, 16, 32-37.
21 E.P. Horwitz, R. Chiarizia, M.L. Dietz, H. Diamond and D.M. Nelson, Anal. Chim. Acta, 1993, 281, 361-372.
22 C. Pin, D. Briot, C. Bassin and F. Poitrasson, Anal. Chim. Acta, 1994, 298, 209-217. 23 C. Pin and J.F. Santos Zalduegui, Anal. Chim. Acta, 1997, 339, 79-89.
24 E.P. Horwitz, D.R. McAlister, A.H. Bond and R.E. Barrans Jr, Solvent Extr. Ion Exch., 2005, 23, 319-344.
25 E.A. Huff and D.R. Huff, 34th ORNL/DOE Conf. on Anal. Chem. in Energy Technol., Gatlinburg, TN, 1993.
26 D.R. McAlister and E.P. Horwitz, Solvent Extr. Ion Exch.,2007, 25, 757-769.
27 D.R. McAlister and E.P. Horwitz, 2011, Radiobioassay & Radiochem. Measurements Conf., Sandestin, Florida.
28 K. Govindaraju, Geostandards Newsletter, 1994, 18, 1-158.
3 4 5 6 7 8 9 10 11 12 13 14 15 16 17 18 19 20 21 22 23 24 25 26 27 28 29 30 31 32 33 34 35 36 37 38 39 40 41 42 43 44 45 46 47 48 49 50 51 52 53 54 55 56 57 58 59 60
Figure captions
Fig. 1: Scheme of the elution sequence depicting the successive steps of the separation
procedure: (1) separation of the LREE from matrix elements by selective extraction on the TRU column; (2) first tandem step: back-extraction of the LREE from the TRU column and on-line extraction on the DGA column; (3) elution of La, Ce, and Pr from the DGA column; (4) second tandem step: on-line elution of Nd from the DGA column to the next, LN2 column; (5) elution of residual Ce and Pr; (6) final stripping of the purified Nd fraction
Fig. 2: Effect of the additional purification stage on Nd extracted from the komatiitic basalt
sample from Abitibi. Purified samples (pink circles) display (a) reduced 142Ce contribution and (b) increased 142Nd signal by a factor up to three compared to the samples processed through DGA-LN2 tandem only (blue circles), suggesting a significant improvement of the overall purity of Nd from those foreign elements which have an adverse effect on the production of thermal ions. Corrected 142Nd/144Nd (c) and 143Nd/144Nd ratios (d) remain unchanged.
Fig. 3: 142Nd/144Nd ratios in reference materials and other various samples expressed as the deviations (µ142Nd, in ppm) relative to the mean of values measured for the JNdi-1 standard under the same analytical conditions. Our sample of the Allende meteorite displays a strongly negative µ142Nd of -62 +/-10, further extending towards the non radiogenic side the range of values measured so far for this carbonaceous chondrite.18
3 4 5 6 7 8 9 10 11 12 13 14 15 16 17 18 19 20 21 22 23 24 25 26 27 28 29 30 31 32 33 34 35 36 37 38 39 40 41 42 43 44 45 46 47 48 49 50 51 52 53 54 55 56 57 58 59 60
Table 1 Outline of the separation scheme enabling the isolation of highly purified
Nd in (ultra-) mafic samples by extraction chromatography
Reagents Volume (mL)
Column pre-cleaning and pre-conditioning
TRU Spec (500 mg) 1 M HNO3 1 DGA (350 mg) 3 M HCl 1 LN2 (350 mg) 0.1 M HCl 0.5
0.006M HCl 1
TRU Spec alone
Sample loading 1 M HNO3-C6H8O6 4 × 5
Matrix elution 1 M HNO3 2 × 1 0.5 M HNO3 2 × 1 0.25 M HNO3 1.5 0.125M HNO3 2 × 1 0.125M HNO3 0.5 Pre-LREE cut 3M HCl 3 × 0.25
TRU spec and DGA columns in tandem
Elution of LREE 3M HCl 4 × 0.5
Columns decoupling and further elution DGA alone
Rinse 0.1M HNO3 0.5
Rinse 0.05M HNO3 3
Elution of Ce 0.03 M HNO3 3 Elution of Pr 0.025M HNO3 2.5
DGA and LN2 columns in tandem
Online elution of Nd 0.006M HCl 2
Columns decoupling and further elution LN2 alone Rinse 0.05 M HNO3 0.1 0.08M HNO3 2.6 Elution of Nd$ 0.15 M HNO3 3 DGA alone (Elution of Sm, optional) 0.1M HCl 1
Cleaning before storage
LN2 3 M HNO3 2 0.05 M HNO3 2 DGA 1 M HCl 2 0.01 M HCl 2 TRU Spec 0.1 M HCl - 0.29 M HF 4 0.05 M HNO3 4 3 M HCl 4 0.05 M HNO3 4
Optional step for further clean up of Nd fraction if needed
DGA column
Pre-conditionning 0.2M HNO3 1
Sample loading (fraction eluted in $) 0.15M HNO3 3
Rinse 2M HCl 3.5 Elution of Nd 2M HCl 3 3 4 5 6 7 8 9 10 11 12 13 14 15 16 17 18 19 20 21 22 23 24 25 26 27 28 29 30 31 32 33 34 35 36 37 38 39 40 41 42 43 44 45 46 47 48 49 50 51 52 53 54 55 56 57 58 59 60
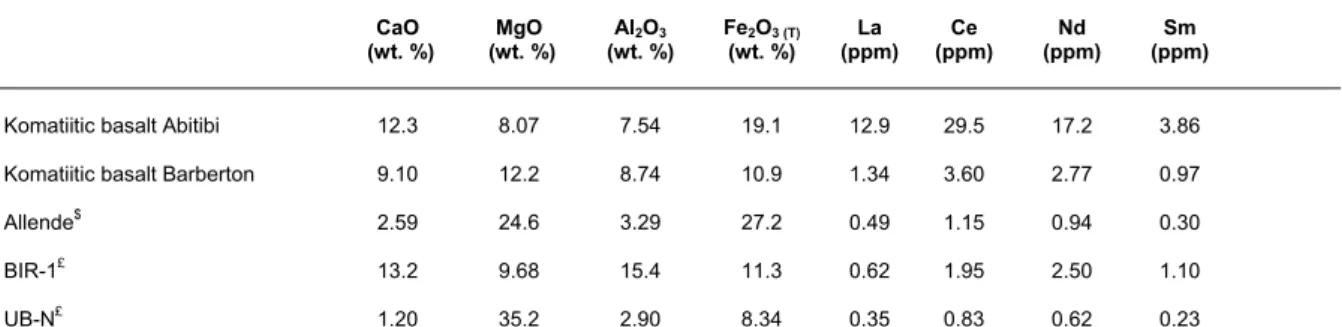
Table 2 Major and some trace element abundances in the samples investigated during this study determined by ICP-AES and ICP-QMS, respectiveley. CaO (wt. %) (wt. %) MgO Al2 O3 (wt. %) Fe2O3 (T) (wt. %) (ppm)La (ppm) Ce (ppm) Nd (ppm) Sm
Komatiitic basalt Abitibi 12.3 8.07 7.54 19.1 12.9 29.5 17.2 3.86 Komatiitic basalt Barberton 9.10 12.2 8.74 10.9 1.34 3.60 2.77 0.97 Allende$ 2.59 24.6 3.29 27.2 0.49 1.15 0.94 0.30
BIR-1£ 13.2 9.68 15.4 11.3 0.62 1.95 2.50 1.10
UB-N£ 1.20 35.2 2.90 8.34 0.35 0.83 0.62 0.23 $Data from ref. 18. Note that the samples analysed in this study are not from the same batch of this meteorite
£ Data from ref. 28 3 4 5 6 7 8 9 10 11 12 13 14 15 16 17 18 19 20 21 22 23 24 25 26 27 28 29 30 31 32 33 34 35 36 37 38 39 40 41 42 43 44 45 46 47 48 49 50 51 52 53 54 55 56 57 58 59 60
The individual ratios are listed with their individual within-run precision (expressed as 2 standard errors), while the average values (in bold italic) are quoted with their external reproducibility (expressed as 2 standard deviations)
140Ce 147Sm 142Nd 144Nd 142Ce/142Nd 144Sm/144Nd 142Nd/144Nd µ142Nd 143Nd/144Nd 145Nd/144Nd 148Nd/144Nd 150Nd/144Nd 146Nd/144Nd
(V) (V) (V) (V) (ppm) (ppm) (ppm) BIR-1
BIR-1 #1 3.3E-4 2.8E-6 6.4 5.6 6.4 0.1 1.141835 ± 5 -1.3 ± 4.3 0.513081 ± 2 0.348404 ± 1 0.241581 ± 1 0.236452 ± 2 0.721492 BIR-1 #2 5.5E-5 3.3E-6 5.0 4.4 1.4 0.2 1.141831 ± 7 -4.9 ± 6.3 0.513081 ± 3 0.348406 ± 1 0.241585 ± 2 0.236454 ± 3 0.722629 BIR-1 #3 7.8E-5 2.8E-6 2.8 2.5 3.5 0.2 1.141838 ± 7 2.0 ± 6.4 0.513082 ± 3 0.348403 ± 2 0.241581 ± 2 0.236453 ± 3 0.721823
Average 3.7 0.2 1.141835 ± 8 -1.4 ± 6.9 0.513082 ± 1 0.348405 ± 3 0.241582 ± 4 0.236453 ± 2
K-B ABI*
K-B ABI #1a 2.4E-4 4.2E-6 10.6 9.2 2.8 0.1 1.141833 ± 4 -3.1 ± 3.5 0.511642 ± 2 0.348405 ± 1 0.241580 ± 1 0.236448 ± 1 0.721066 K-B ABI #1b 6.7E-5 1.7E-6 6.0 5.2 1.4 0.1 1.141832 ±5 -3.7 ± 4.3 0.511641 ± 2 0.348405 ± 1 0.241580 ± 1 0.236450 ± 2 0.719679 K-B ABI #2a§ 5.3E-5 3.3E-6 10.8 9.4 0.6 0.1 1.141837 ± 4 1.1 ± 3.3 0.511643 ± 1 0.348404 ± 1 0.241580 ± 1 0.236451 ± 1 0.721281 K-B ABI #2b§ 2.3E-5 4.5E-7 4.1 3.6 0.7 0.0 1.141840 ± 6 3.8 ± 5.3 0.511645 ± 2 0.348406 ± 1 0.241581 ± 2 0.236449 ± 2 0.721711 K-B ABI #3a§ 5.0E-5 5.4E-6 14.8 12.9 0.4 0.1 1.141831 ± 4 -4.6 ± 3.6 0.511648 ± 2 0.348404 ± 1 0.241580 ± 1 0.236448 ± 2 0.720696 K-B ABI #3b§ 3.2E-5 5.1E-6 15.2 13.3 0.3 0.1 1.141839 ± 4 2.8 ± 3.3 0.511649 ± 1 0.348404 ± 1 0.241579 ± 1 0.236446 ± 1 0.721446 K-B ABI #4a 1.2E-4 1.4E-6 9.1 7.9 1.7 0.0 1.141839 ± 6 2.6 ± 4.9 0.511650 ± 2 0.348404 ± 1 0.241580 ± 2 0.236448 ± 2 0.719581 K-B ABI #4b 8.8E-5 1.7E-5 5.7 5.0 1.9 0.7 1.141829 ± 5 -6.2 ± 4.7 0.511645 ± 3 0.348406 ± 1 0.241578 ± 1 0.236449 ± 2 0.721663 K-B ABI #5a 8.3E-5 2.4E-6 4.8 4.2 2.2 0.1 1.141830 ± 6 -5.5 ± 5.0 0.511650 ± 2 0.348405 ± 1 0.241581 ± 2 0.236448 ± 2 0.719657 K-B ABI #5b 1.0E-4 2.7E-6 6.9 6.0 1.8 0.1 1.141833 ± 6 -2.6 ± 5.0 0.511650 ± 2 0.348404 ± 1 0.241581 ± 2 0.236449 ± 2 0.719876 K-B ABI #6a§ 5.9E-5 6.5E-6 8.9 7.8 0.8 0.2 1.141837 ± 5 1.1 ± 4.1 0.511651 ± 2 0.348405 ± 1 0.241580 ± 1 0.236448 ± 2 0.720921 K-B ABI #6b§ 1.3E-4 3.9E-6 13.0 11.3 1.2 0.1 1.141834 ± 4 -2.1 ± 3.8 0.511652 ± 2 0.348404 ± 1 0.241580 ± 1 0.236448 ± 2 0.719349 K-B ABI #7a§ 5.9E-5 3.2E-6 12.8 11.2 0.6 0.1 1.141831 ± 3 -4.9 ± 3.0 0.511650 ± 1 0.348404 ± 1 0.241580 ± 1 0.236447 ± 1 0.719916 K-B ABI #7b§ 3.8E-5 3.8E-6 13.1 11.4 0.4 0.1 1.141832 ± 4 -3.6 ± 3.6 0.511650 ± 1 0.348404 ± 1 0.241579 ± 1 0.236449 ± 1 0.719607
Average 1.2 0.1 1.141834 ± 8 -1.8 ± 6.8 0.511648 ± 7 0.348404 ± 1 0.241580 ± 2 0.236448 ± 2
K-B BAR$
K-B BAR #1 3.1E-5 4.5E-6 8.9 7.8 0.4 0.1 1.141829 ± 5 -6.4 ± 4.6 0.512863 ± 2 0.348403 ± 1 0.241581 ± 1 0.236448 ± 2 0.721263 K-B BAR #2 9.5E-5 2.0E-6 10.9 9.5 1.1 0.0 1.141828 ± 4 -7.0 ± 3.4 0.512864 ± 1 0.348406 ± 1 0.241580 ± 1 0.236447 ± 1 0.719849 K-B BAR #3 3.9E-5 -6.8E-7 5.8 5.1 0.9 0.0 1.141825 ± 6 -9.4 ± 5.4 0.512860 ± 2 0.348404 ± 1 0.241580 ± 2 0.236449 ± 2 0.722123 K-B BAR #4 2.0E-5 4.2E-6 6.3 5.5 0.4 0.2 1.141830 ± 5 -5.8 ± 4.6 0.512864 ± 2 0.348405 ± 1 0.241582 ± 1 0.236451 ± 2 0.722277
Average 0.7 0.1 1.141828 ± 4 -7.2 ± 3.1 0.512863 ± 4 0.348404 ± 2 0.241581 ± 2 0.236449 ± 3
UBN
UBN #1 1.7E-5 1.7E-6 2.2 1.9 1.0 0.2 1.141829 ± 10 -5.9 ± 9.1 0.512932 ± 4 0.348403 ± 3 0.241584 ± 3 0.236451 ± 4 0.723606 UBN #2 1.4E-4 4.4E-6 8.7 7.6 2.1 0.1 1.141833 ± 4 -2.9 ± 3.5 0.512929 ± 2 0.348405 ± 1 0.241581 ± 1 0.236451 ± 2 0.722491 UBN #3 3.6E-5 3.7E-6 4.4 3.9 1.0 0.2 1.141830 ± 8 -5.2 ± 7.3 0.512927 ± 3 0.348405 ± 2 0.241581 ± 2 0.236452 ± 3 0.723635 UBN #4 2.0E-4 4.1E-6 7.5 6.6 3.4 0.1 1.141842 ± 5 5.4 ± 4.2 0.512927 ± 2 0.348404 ± 1 0.241582 ± 1 0.236454 ± 2 0.723688
Average 1.9 0.2 1.141834 ± 12 -2.1 ± 10.4 0.512929 ± 5 0.348404 ± 1 0.241582 ± 3 0.236452 ± 3
Allende
Allende #1 9.2E-5 4.9E-6 5.5 4.8 2.1 0.2 1.141765 ± 5 -62 ± 5 0.512077 ± 2 0.348403 ± 1 0.241582 ± 2 0.236448 ± 2 0.720348 Allende #2 1.5E-5 1.1E-5 8.3 7.3 0.2 0.3 1.141766 ± 4 -62 ± 4 0.512077 ± 2 0.348404 ± 1 0.241578 ± 1 0.236444 ± 2 0.723900 Allende #3 4.1E-5 3.5E-7 4.9 4.3 1.1 0.0 1.141773 ± 5 -56 ± 5 0.512076 ± 2 0.348403 ± 1 0.241584 ± 2 0.236451 ± 2 0.723113 Allende #4 7.7E-5 1.9E-6 7.7 6.8 1.3 0.1 1.141760 ± 8 -67 ± 7 0.512066 ± 3 0.348404 ± 2 0.241584 ± 4 0.236453 ± 3 0.723122
Average 1.2 0.1 1.141766 ± 11 -62 ± 10 0.512074 ± 10 0.348403 ± 1 0.241582 ± 5 0.236449 ± 7
JNdi-1
JNdi-1 #1 8.0E-5 3.2E-6 3.6 3.2 2.8 0.2 1.1418369 ± 8 0.7 ± 6.7 0.512106 ± 3 0.348401 ± 2 0.241581 ± 2 0.236452 ± 3 0.719772 JNdi-1 #2 2.8E-5 8.4E-6 4.9 4.3 0.7 0.4 1.1418369 ± 7 0.7 ± 6.4 0.512104 ± 3 0.348403 ± 2 0.241579 ± 2 0.236449 ± 2 0.720947 JNdi-1 #3 4.9E-5 7.3E-6 4.4 3.9 1.4 0.4 1.1418339 ± 7 -1.9 ± 6.0 0.512104 ± 3 0.348403 ± 2 0.241583 ± 2 0.236454 ± 3 0.720216 JNdi-1 #4 1.4E-4 8.8E-6 6.8 5.9 2.6 0.3 1.1418396 ± 6 3.1 ± 5.0 0.512105 ± 2 0.348403 ± 1 0.241581 ± 2 0.236450 ± 2 0.719938 JNdi-1 #5 8.3E-5 1.3E-5 7.6 6.7 1.4 0.4 1.1418322 ± 5 -3.5 ± 4.6 0.512102 ± 2 0.348403 ± 1 0.241581 ± 2 0.236451 ± 2 0.720721 JNdi-1 #6 1.3E-4 1.5E-5 7.8 6.8 2.1 0.4 1.1418351 ± 5 -0.9 ± 4.3 0.512103 ± 2 0.348404 ± 1 0.241581 ± 2 0.236451 ± 2 0.720918 JNdi-1 #7 3.2E-5 1.1E-5 5.1 4.4 0.8 0.5 1.1418309 ± 7 -4.5 ± 5.7 0.512102 ± 3 0.348403 ± 1 0.241578 ± 2 0.236448 ± 2 0.720819 JNdi-1 #8 1.2E-4 1.4E-5 9.6 8.4 1.6 0.3 1.1418358 ± 4 -0.3 ± 3.5 0.512105± 1 0.348403 ± 1 0.241582 ± 1 0.236452 ± 1 0.719966 JNdi-1 #9 1.8E-4 1.9E-5 10.0 8.8 2.2 0.5 1.1418332 ± 4 -2.5 ± 3.6 0.512104 ± 2 0.348404 ± 1 0.241582 ± 1 0.236453 ± 1 0.720608 JNdi-1 #10 1.1E-4 2.3E-5 11.3 9.9 1.2 0.5 1.1418417 ± 4 4.9 ± 3.4 0.512106 ± 1 0.348404 ± 1 0.241582 ± 1 0.236454 ± 1 0.720969 JNdi-1 #11 1.6E-4 1.9E-5 10.6 9.3 1.9 0.4 1.1418425 ± 5 5.6 ± 4.1 0.512107 ± 2 0.348404 ± 1 0.241582 ± 1 0.236452 ± 2 0.720190 JNdi-1 #12 1.6E-4 1.7E-5 11.1 9.7 1.8 0.4 1.1418402 ± 4 3.6 ± 3.3 0.512106 ± 1 0.348405 ± 1 0.241582 ± 1 0.236452 ± 1 0.720005 JNdi-1 #13 5.8E-5 8.1E-6 5.6 4.9 1.3 0.3 1.1418329 ± 5 -2.8 ± 4.6 0.512105 ± 2 0.348405 ± 1 0.241583 ± 1 0.236452 ± 2 0.719533 JNdi-1 #14 9.1E-5 1.2E-5 6.8 5.9 1.7 0.4 1.1418373 ± 5 1.0 ± 4.3 0.512105 ± 2 0.348405 ± 1 0.241582 ± 1 0.236453 ± 2 0.720486 JNdi-1 #15 1.1E-4 9.5E-6 6.7 5.8 2.1 0.3 1.1418324 ± 5 -3.3 ± 4.1 0.512103 ± 2 0.348404 ± 1 0.241579 ± 1 0.236449 ± 2 0.719539
Average 1.7 0.4 1.141836 ± 7 0.0 ± 6.4 0.512104 ± 3 0.348404 ± 2 0.241581 ± 3 0.236451 ± 4
AMES
AMES #1 2.3E-5 8.0E-6 14.8 13.0 0.2 0.1 1.1418407 ± 3 4.0 ± 2.9 0.512155 ± 1 0.348405 ± 1 0.241581 ± 1 0.236451 ± 1 0.720678 AMES #2 2.4E-5 5.1E-6 5.7 5.0 0.5 0.2 1.1418404 ± 5 3.8 ± 4.6 0.512155 ± 2 0.348405 ± 1 0.241581 ± 1 0.236451 ± 2 0.721026 AMES #3 9.0E-5 6.3E-6 11.3 9.9 1.0 0.1 1.1418407 ± 4 4.0 ± 3.2 0.512155 ± 1 0.348405 ± 1 0.241583 ± 1 0.236451 ± 1 0.720800 AMES #4 6.5E-5 2.1E-6 11.6 10.2 0.7 0.0 1.1418413 ± 4 4.5 ± 3.2 0.512154 ± 1 0.348404 ± 1 0.241580 ± 1 0.236452 ± 1 0.721089 AMES #5 5.2E-5 5.0E-6 12.8 11.2 0.5 0.1 1.1418399 ± 3 3.3 ± 3.0 0.512154 ± 1 0.348405 ± 1 0.241581 ± 1 0.236452 ± 1 0.721100 AMES #6 3.5E-5 1.7E-5 10.0 8.8 0.4 0.4 1.1418347 ± 7 -1.2 ± 6.0 0.512152 ± 3 0.348405 ± 2 0.241584 ± 2 0.236455 ± 3 0.720805 AMES #7 3.8E-5 1.6E-6 7.3 6.4 0.7 0.1 1.1418379 ± 7 1.6 ± 6.4 0.512152 ± 3 0.348404 ± 1 0.241579 ± 3 0.236449 ± 5 0.720463 AMES #8 5.4E-5 4.8E-6 15.2 13.3 0.4 0.1 1.1418388 ± 3 2.4 ± 2.9 0.512153 ± 1 0.348404 ± 1 0.241578 ± 1 0.236449 ± 1 0.720736
Average 0.6 0.1 1.141839 ± 4 2.8 ± 3.8 0.512154 ± 2 0.348405 ± 1 0.241581 ± 4 0.236451 ± 4
* komatiitic basalt from ~ 2.7 Ga Abitibi greenstone belt (Canada) $ komatiitic basalt from ~3.5 Ga Barberton greenstone belt (South Africa)
§ for these samples, separated Nd was further purified on-line by means of a second, on-line pass through the DGA column 3 4 5 6 7 8 9 10 11 12 13 14 15 16 17 18 19 20 21 22 23 24 25 26 27 28 29 30 31 32 33 34 35 36 37 38 39 40 41 42 43 44 45 46 47 48 49 50 51 52 53 54 55 56 57 58 59 60
Table 4 Chemical recoveries (%) achieved during the separation of Nd
N Min (%) Max (%) Average (%)
Komatiitic basalt Abitibi 7 71 80 76 Komatiitic basalt Barbetron 4 81 92 87 Allende 4 91 99 95 BIR-1 3 90 98 95 UBN 4 94 97 95 3 4 5 6 7 8 9 10 11 12 13 14 15 16 17 18 19 20 21 22 23 24 25 26 27 28 29 30 31 32 33 34 35 36 37 38 39 40 41 42 43 44 45 46 47 48 49 50 51 52 53 54 55 56 57 58 59 60
Table 5 Reagent, column and total procedural Nd blanks measured by ICP-QMS
Reagent blanks (pg.mL-1) Reagent blanks (pg.g-1) Column blank Total procedural blank
29M HF 6M HCl 14M HNO3 Ascorbic acid Boric acid (pg) (pg)
Range 0.4 - 0.9 0.2 - 0.6 0.3 - 0.8 < 5 < 5 7 - 15 21 - 45 Mean ± 1SD 0.5 ± 0.3 0.4 ± 0.2 0.5 ± 0.2 11 ± 3 32 ± 9 Number 4 4 4 1 1 6 6 3 4 5 6 7 8 9 10 11 12 13 14 15 16 17 18 19 20 21 22 23 24 25 26 27 28 29 30 31 32 33 34 35 36 37 38 39 40 41 42 43 44 45 46 47 48 49 50 51 52 53 54 55 56 57 58 59 60
TRU col. matrix (500 mg) 1 M HNO3-AA 0.15 M HNO3 La, Ce, Pr 0.1 M HNO3
1
2
3
4
5
6
LREESteps
DGA col. (350 mg) NdPre-Nd cut Nd (purified)
1
sttandem
2
ndtandem
3M HCl 0.006M HCl
0.03 M HNO3 (see flow chart)
(350 mg)Ln2 col. 3 4 5 6 7 8 9 10 11 12 13 14 15 16 17 18 19 20 21 22 23 24 25 26 27 28 29 30 31 32 33 34 35 36 37 38 39 40 41 42 43 44 45 46 47 48 49 50 51 52 53 54 55 56 57 58
1.14182 1.14183 1.14184 1.14185 14 2
Nd
/
14 4Nd
0.51164 0.51165 0.51166 14 3Nd
/
14 4Nd
0.1 0.2 14 0Ce
(m
V)
5 10 15 0.5 1.0 1.5 2.0 2.5 3.0 142Ce/
142Nd (x10
-6)
14 2Nd
(V
)
a
b
c
d
3 4 5 6 7 8 9 10 11 12 13 14 15 16 17 18 19 20 21 22 23 24 25 26 27 28 29 30 31 32 33 34 35 36 37 38 39 40 41 42 43 44 45 46 47 48 49 50 51 52 53 54 55 56 57 58 59 60-80 -60 -40 -20 0 20
AMES
2.8±3.8
BIR-1
-1.4±6.9
Komatiite
Abitibi
-1.8±6.8
Komatiite
Barberton
-7.2±3.1
UBN
-2±10
Allende
-62±10
µ
142Nd
JNdi-1
0.0±6.4
3 4 5 6 7 8 9 10 11 12 13 14 15 16 17 18 19 20 21 22 23 24 25 26 27 28 29 30 31 32 33 34 35 36 37 38 39 40 41 42 43 44 45 46 47 48 49 50 51 52 53 54 55 56 57 58 59 60MgTi FeSr BaLa CeNd SmGd YbLu Hf
0
10
20
30
40
50
60
70
80
90
100
Mg
Ti
Fe
Sr
Ba
La
Ce
Nd
Sm
Gd
Yb
Lu
Recovery (%)
Element
TRU Spec column calibration
1 M HNO 3 HNO3 0.25 M 0.5 M HNO3 0.125 M HNO3 3 M HCl