Science Arts & Métiers (SAM)
is an open access repository that collects the work of Arts et Métiers Institute of
Technology researchers and makes it freely available over the web where possible.
This is an author-deposited version published in:
https://sam.ensam.eu
Handle ID: .
http://hdl.handle.net/10985/16791
To cite this version :
Thibaut DE TERRIS, Olivier ANDREAU, Patrice PEYRE, Frédéric ADAMSKI, Imade KOUTIRI,
Cyril GORNY, Corinne DUPUY - Optimization and comparison of porosity rate measurement
methods of Selective Laser Melted metallic parts - Additive Manufacturing - Vol. Volume 28,
August 2019, p.802-813 - 2019
Any correspondence concerning this service should be sent to the repository
Administrator :
[email protected]
Full Length Article
Optimization and comparison of porosity rate measurement methods of
Selective Laser Melted metallic parts
Thibaut de Terris
⁎, Olivier Andreau, Patrice Peyre, Frédéric Adamski, Imade Koutiri, Cyril Gorny,
Corinne Dupuy
Laboratoire PIMM, UMR 8006 Arts et Métiers-CNRS-CNAM, 151 Bd de l'Hôpital, 75013, Paris, France
A R T I C L E I N F O
Keywords:
Additive manufacturing Selective Laser Melting Porosity Lack of fusion Key-hole Density measurement Archimedes method Helium pycnometry Micrographic cross section
A B S T R A C T
The systematic occurrence of porosities inside selective laser melted (SLM) parts is a well-known phenomenon. In order to improve the density of SLM parts, it is important not only to assess the physical origin of the different types of porosities, but also to be able to measure as precisely as possible the porosity rate so that one may select the optimum manufacturing parameters.
Considering 316 L steel parts built with different input energies, the current paper aims to (1) present the different types of porosities generated by SLM and their origins, (2) compare different methods for measuring parts density and (3) propose optimal procedures. After a preliminary optimization step, three methods were used for quantifying porosity rate: the Archimedes method, the helium pycnometry and micrographic ob-servations.
The Archimedes method shows that results depend on the nature and temperature of thefluid, but also on the sample volume and its surface roughness.
During the micrographic observations, it has been shown that the results depend on the magnification used and the number of micrographs considered.
A comparison of the three methods showed that the optimized Archimedes method and the helium pycno-metry technique gave similar results, whereas optimized micrographic observations systematically under-estimated the porosity rate.
In a second step, samples were analyzed to illustrate the physical phenomena involved in the generation of porosities. It was confirmed that: (1) low Volume Energy Density (VED) causes non-spherical porosities due to insufficient fusion, (2) in intermediary VED the small amount of remaining blowhole porosities come from gas occlusion in the melt-pool and (3) in excessive VED, cavities are formed due to the key-hole welding mode.
1. Introduction
The development of Metallic Additive Manufacturing (AM) has greatly expanded since the early 2000s. AM enables the production of components with complex geometries which are impossible to fabricate with conventional processes (forge, foundry,…). Metallic AM processes can be classified in two main categories: (1) direct deposition techni-ques and (2) powder bed fusion technitechni-ques. Thefirst category consists in depositing matter via projected powder or a feeding wire, melted by either a laser or an electric arc. In the second category, the powder-bed can be melted using a laser beam, such as Selective Laser Melting (SLM), or using an electron beam as in the Electron Beam Melting process (EBM). A third technology, the Metal binder jet printing, is also in full development [1]. There is growing interest in AM because of the
wide range of metallic materials that can be used to produce increas-ingly complex parts. Different applications in various fields such as aeronautics and space, transport, energy, medical [2–6], already exist. Moreover, AM can provide mechanical properties that are similar or better than conventional processes (such as casting or forging) [5,6].
There are two main common defects in SLM which directly influ-ence the mechanical properties of the parts: a deleterious surface roughness (with Ra usually superior to 7μm) and the systematic oc-currence of porosities inside thefinal parts. These defects and their origin are well described by [7] for Ti-6Al-4 V and 316 L stainless steel [8]. also indicates that compared to wrought parts, SLM parts have a significantly lower fatigue life behavior in multiaxial loading condi-tions, due to internal defects which cause stress concentration.
There are three 1st order parameters in SLM which directly impact
⁎Corresponding author.
E-mail address:[email protected](T. de Terris).
the quality of the fusion: the laser power P (W), the scanning speed V (mm.s−1) and the laser beam diameter D (mm). These parameters can be united in a single parameter called Volume Energy Density (VED) [9–11] (Eq.(1)). It is also possible to consider other parameters such as the powder layer thicknessΔh (μm) or the hatch spacing H (μm) be-tween adjacent fusion lines.
=
VED P
V π D 4*
* * 2 (1)
With: VED : Volume Energy Density (J. mm−3), P : laser power (W), V : scan velocity (mm.s-1), D : laser beam diameter (mm)
Several recent works [12–14] have shown that increased VED favors
densification. Below a given VED threshold, SLM conditions do not
allow for sufficient re-melting of the prior layer, leading to a lack of fusion (LOF) which results in residual pores forming in-betweens layers. Studies also show that small (< 10μm) blowhole pores (coming from gas entrapment in powder particles and in the powder layer or from powder humidity) are formed throughout the VED range [7]. At high VED, and depending on powder material, the porosity rate may once again increase as shown by [15] and [16].
Various physical phenomena (Fig. 1) can explain the presence of local unmelted zones inside a part. These are listed here below:
- Inappropriate manufacturing parameters, mostly corresponding to insufficient VED, can lead to poor overlap between SLM fusion beads (= fusion lines) and thereby increase the amount of unmelted zones. Too much hatching distance and excessive powder layer thickness can also generate a lack of cohesion between SLM beads [17].
- A high VED leads to the formation of a vapor plume. The interaction between this vapor plume (generated above the impact zone) and the laser can lead to the formation of porosities [18]. As shown by [19] this vapor plume is composed of macro droplets and nano-condensates which interfere with the laser by absorbing the radia-tion, hence limiting the bead penetration and possibly promoting LOF.
- The presence of spatter ejections on the powder bed can also gen-erate porosities. The size of the spatters, usually much larger than
the powder grains (< 50μm), can prevent the powder from
spreading homogeneously around the spatter, thus increasing the risk of LOF [10,20]. According to [10] there are three types of spatter ejections : (1) metal jet caused by the recoil pressure of the vapor plume associated with the extreme expansion of the powder phase gas, (2) droplet spatters ejected from the turbulent melt-pool flow, (3) powder spatters generated at the powder layer/melt- pool front interface.
- The phenomenon of powder denudation investigated in [21] where the powder surrounding the bead is attracted towards it and causes a lack of powder on both sides of SLM beads. This has two effects: (1) the local powder thickness for the next layer is higher, (2) a non-optimal lateral overlap between beads, due to an excessive hatching distance, which can be a source of LOF [17].
- Melt-pool hydrodynamic instabilities like balling (favored by low VED) or humping (which appears at high laser powers and velocity) [16,19] and vaporization affect bead geometry.
Noting the importance of bead dimensions combined with the hatching distance H (μm) and the layer thickness Δh (μm), Tang [22] suggested a formula (Eq.(2)) to geometrically estimate if the overlap is sufficient to avoid LOF. In the Eq.(2), W is the SLM bead width and e is the SLM bead depth (inμm) measured in a cross-section which is per-pendicular to the scan direction as described inFig. 2.
It can be clearly seen inFig. 2that to avoid LOF between each of the SLM beads, W must be higher than H in order to guarantee a sufficient lateral overlap, and e must be higher thanΔh to provide a sufficient remelting (vertical overlap) of the previous layers and avoid LOF be-tween each of the SLM layers.
⎛ ⎝ ⎞ ⎠ + ⎛⎝ ⎞ ⎠ ≤ H W h e Δ 1 2 2 (2) With : H : hatching distance (μm), W : SLM bead width (μm), Δh : layer thickness (μm), e : SLM bead depth (μm)
As indicated before, LOF porosities exhibit angular and random morphologies (Fig. 3a), of relatively large sizes (< < 100μm) and contain unmelted powder. They are located mainly in-between SLM beads and come either from a poor choice of parameters or from process instabilities.
A number of near-spherical porosities will always remain, even with a correctly optimized SLM process. They can be divided in two types: blowhole pores and key-hole pores.
- Blowhole pores (Fig. 3b) reflect the presence of gas bubbles trapped
in the material upon solidification. They are mostly dependent on the properties of the powder bed (compactness, powder con-tamination) and on the work atmosphere (shielding gas, humidity) as explained by [7]. A powder layer usually has a compactness of around 50%. During the melting of a layer, a fraction of the gas contained between the powder particles cannot escape before the solidification and gets entrapped as bubbles in the SLM bead. These spherical porosities are located in the heart of a bead and are much
Fig. 1. Main physical phenomena occurring during Selective Laser Melting.
Fig. 2. Illustration of the key dimensions to estimate the formation of LOF, according to [22].
smaller than those related to the key-hole.
- At high laser intensity (for I > 106W.cm−² according to [23]) the SLM welding regime turns from a conduction mode into a key-hole mode [24]. Recoil pressure on the melt-pool generated by intense metal vaporization can create a vapor capillary (key-hole). When the laser beam is absorbed by the key-hole walls rather than the layer surface, this significantly increases the penetration depth and generates thin and deep fusion beads (Fig. 3c) as shown by [25]. In this case, porosities come from the collapse of key-hole walls under the action of surface tensions. The destabilization and resulting closure forms near-spherical large cavities with entrapped gas, lo-cated near the SLM bead root. Previous works [24,25] considered the Width-to-Depth Ratio of fusion beads (WDR = W/e) to distin-guish conduction mode welds (for WDR > 1) from key-hole mode welds (WDR < < 1).
Examples of typical porosities obtained during our SLM experiments on 316 L steel are shown inFig. 3.
The generation of porosities is a function of manufacturing condi-tions. It is important to know their physical origins to be able to limit their formation. It is also important to develop experimental methods that permit the analysis of porosity amounts as quickly and as effi-ciently as possible. Using either micrographic analysis of cross sections
[16,26], Archimedes method [27,28] or computed tomography
[16,28,29], a number of recent works have considered how porosity amounts vary according to SLM conditions. However, there are very few studies that compare experimental methods to one another [28–30], and there is a lack of details about which experimental pro-cedures are the most reliable for estimating porosity amounts. Another problem is the lack of uniformity in the results of many recent studies. For example [29] shows a high degree of correlation between
Archi-medes method and micrographic analyses, while [28] shows these
methods yield different results.
The objective of the present paper is: (1) to compare and validate several experimental methods for evaluating closed porosities in SLM parts, (closed porosities are those that are completely isolated inside of the metal, whereas open porosities are pores near the part surface that are not completely enclosed, as shown inFig. 4), and (2) to apply the methods to the study of porosity formation in 316 L stainless steel samples.
2. Experimental methods 2.1. Material
The material used for SLM experiments was a gas-atomized 316 L stainless steel powder. Particles had a spherical morphology, with a few agglomerated satellites. Their size was between 25μm (D10) and 60 μm (D90) (Fig. 5). The theoretical density of 316 L stainless steel is 7.99 g.cm−3 according to the supplier material data sheet. The che-mical composition is given inTable 1.
2.2. SLM conditions
The test samples used for this study were manufactured using an SLM125 HL machine, from SLM Solutions GmbH, under an argon at-mosphere and less than 500 ppm O2. They were rectangular cuboids of
10 × 10 x 25 mm.
The manufacturing parameters were kept similar, except for the scanning speed V, as summarized in theTable 2. The manufacturing strategy also remained the same (number of contours, lasing strategy and scheme, hatch distance).
2.3. Experimental methods and procedures for density measurements 2.3.1. The archimedes method
The Archimedes measurements were performed according to the
method described by [31]. The device used was a Mettler Toledo
MS104TS hydrostatic weighing system equipped with a MS-DNY-43 solid sample weighing module. This technique is based on the principle of Archimedes:“A body wholly or partly immersed in a fluid is buoyed up by a force equal to the weight of thefluid displaced” [32] (the volume of the displacedfluid is therefore equal to the immersed volume of the body), which enables to determine the volume of the samples, and therefore their density. Samples are weighed in the air and then in a fluid as shown in (Fig. 6).
The measurements make it possible to know the mass in the air (Mair) and the mass in thefluid (Mfluid) of each sample. And, knowing
the density of thefluid (ρfluid, which varies with the temperature) and of
the air (ρair), it becomes possible to calculate the density of the samples
according to the Eq.(3)[28]: = − − + ρ M M M ρ ρ ρ ( )*( ) sample air
air fluid fluid air air (3)
Withρsample: sample density measured (g. cm−3), Mair: the mass of the
sample in air (g), Mfluid: the mass of the sample influid (g), ρair: air
density (g. cm−3),ρfluid:fluid density (g. cm−3)
The comparison of the results obtained with the theoretical density of the material enables to calculate the porosity rate of the samples (Equation(4)): ⎜ ⎟ = − ⎛ ⎝ ⎞ ⎠ porosity ρ ρ % 100 measured*100 theoretical (4)
Fig. 3. Types of porosities obtained on 316 L steel: (a) lack of fusion, (b) blowhole, (c) key-hole cavity.
In this study, each sample was measured 10 times, and different fluids (demineralized water, pure ethanol and acetone) were tested.
Corresponding fluid properties are shown in Table 3. Between each
measurement the samples were oven-dried (110 °C, 30 min) to evapo-rate the water trapped in the open pores, in order not to influence the mass in the air during the next measurement. During the measurements it was noticed that air bubbles tend to settle on the surface of the
samples because of the surface asperities. In order to improve the density results accuracy, air bubbles shall be removed. Hence, the samples were previously soaked and stirred in an auxiliary beaker containing the samefluid as the one used for the measurements, and the
bubbles were evacuated with a brush. The measurements in thefluid
were performed with no visible bubbles remaining on the surface of the sample. With this method, a simple measurement takes about twenty seconds, not accounting for the sample preparation time and the ana-lysis of the results, as well as the 10 necessary measurements. 2.3.2. Helium pycnometry
The Helium pycnometry measurements were performed on a Micromeritics AccuPyc 1330 device. This technique makes it possible to determine the absolute density of a sample (solid or powder) after the measurement of its volume. The measurement process consists in pla-cing a sample in a tank whose volume V1is calibrated and perfectly
known, at atmospheric pressure Pa. This tank is thenfilled with helium
at a pressure P1. The gas is then expanded to a pressure P2in another
atmospheric pressured empty vessel (called expansion), of a volume V2
(Fig. 7).
The pycnometer measures the volume of a displaced gas from a primary tank (Vtank) at a pression P1to an expansion tank (Vexpansion) at
a pression P2. The pressure variation permits to determine the volume
of the sample (Vsample) and the application of the Mariotte’s law allows
calculating this volume (Eq.(5)):
= − − − − V V V 1 sample tank expansion P P P P a a 1 2 (5)
With Vsample: sample volume measured (cm3), Vtank : volume of the
sample tank (cm3), Vexpansion: volume of the expansion tank (cm3), P1:
gas pressure in the sample tank (kPaG), P2 : gas pressure in the
ex-pansion tank (kPaG), Pa: atmospheric pressure (kPa)
Since the mass has been measured accurately beforehand, and knowing the volume of the sample, it is possible to calculate its density. In the case of helium pycnometry, several purge cycles are previously performed to remove all the air present in the tank and in the open pores of the sample. Then 10 successive measurements are made while keeping the tank closed and airtight. Samples were oven-dried at 110 °C
during 30 min, and air cooled before helium pycnometry
Fig. 5. 316 L powder, (a) particles morphology and (b) size distribution.
Table 1
Chemical composition of the powder (material data sheet).
Fe Cr Ni Mo Mn Si C N P S O Balance 17,7 12,7 2,31 0,89 0,61 0,018 0,09 0,008 0,004 0,028
Table 2
Manufacturing parameters of each samples.
Samples P (W) V (mm/s) D (mm) Volume Energy Density (J. mm−3) P2 235 1221 0,07 50 P3 814 75 P4 611 100 P5 489 125 P6 305 200 P7 244 250
Fig. 6. Archimedes method density measurement.
Table 3
Physical properties offluid used in Archimedes method (Δρ = variation of density in the 15–25 °C temperature range).
Fluids Density (20 °C) Surface tension (20 °C, 1 bar) Dynamic Viscosity (20 °C) Δρ (15 °C – 25 °C) Demineralized Water 0,9982 g.cm−3 72,8.10−3N. m-1 0,913.10−3Pa s 0,20 %
Pure Ethanol 0,7892 g.cm−3 22,3.10−3N. m-1 1,095.10−3Pa s 1,09 %
measurements. This method, composed of 10 cycles, takes about 45 min per sample.
2.3.3. Micrographic cross section
SLM Samples were cut, resin mounted and polished to realize mi-crographs. These micrographs were acquired on the XY (perpendicular to the manufacturing direction) and YZ (parallel to the manufacturing direction) planes (Fig. 8) using a ZEISS Axio Imager optical microscope. Three different magnifications were compared (x50, x100 and x200) as well as various number of micrographs. The images were acquired in similar light conditions and were binarized using the same threshold. They were analyzed by image processing (Python script) to know the porosity rate of the sample (ratio between the number of black pixels and the number total of pixels). It has to be noticed that, unlike thefirst two methods, micrographic analysis provides a porosity rate and not a density measurement.
According to [13], micrographs can also be used to calculate pore circularity (PC) and determine their origins. The closer (PC) is to 1 (which is the maximum), the more circular is a pore. A low PC corre-sponds to LOF porosities whereas higher PC provides an estimation of entrapped gas porosities. This shape factor can be calculated with the following formula (Eq.(6)) where PC is the pore circularity, A the pore area (pix²) and Pp the pore perimeter (pix) :
=
PC π A
Pp
4 * *
2 (6)
With: A : the pore area (pix²), Pp : the pore perimeter (pix)
This analysis is complementary to the Archimedes method or he-lium pycnometry because it allows to locate the pores in the sample, in order to estimate their size and shape. However it should be reminded that the closed pores related to a lack of fusion are full of powder whereas retained powder is removed during the polishing of the sur-face. This can induce a difference between the results of the various
methods, especially for samples containing many LOF porosities. On the other hand, the metallographic method does not take into account the entire sample, but is only representative of the observed zones. This method last at least three minutes, considering only the micrographs acquisition of 4 different analyzed surfaces.
3. Comparison and optimization of experimental methods for porosity rate determination: experimental results and discussion
To achieve the most accurate measurements possible with the Archimedes and micrographs methods, various tests were conducted to determine the ideal measurement conditions for both methods. 3.1. Optimization of the archimedes method
Concerning the Archimedes method, different fluids (such as de-mineralized water, pure ethanol and acetone) were tested. Then the
influence of surface roughness and sample volumes on measurement
accuracy was addressed.
First, it appears clearly that demineralized water shows the lowest porosity rate among all thefluids (unlike [27] which does not show differences between water and acetone), but the highest standard de-viation. Pure ethanol exhibits the highest porosity rate with the lowest standard deviation (Fig. 9).
Fig. 9also shows that the measured densities of the samples are extremely dependent on the value of the actual density of thefluid at the time of measurement. Since this true density value is not exactly known during the measurement, the theoretical density was considered and determined via tables (such as the International Alcoholometric Tables [33]), knowing the temperature of thefluid. The end result is therefore particularly dependent on the chemical composition and temperature of thefluid, and the accuracy with which the temperature is measured. Thus, a slight inaccuracy in the measurement of thefluid temperature combined with a largeΔρ parameter (Table 3) has a clear influence on the final result. As an example, in the case of a sample with a low porosity rate (˜ 0.5%), a variation of ± 0,5 °C on the measured
temperature leads to a difference of ± 9,2% on porosity rate with
ethanol, whereas the same measurement using demineralized water would lead to a difference of ± 3,5%. This trend tends to decrease with higher porosities.
In addition, the differences obtained can be related to the difference in surface tensions between thefluids (Table 3). This difference affects
the ability of thefluid to correctly wet the entire surface of the samples. Due to its low surface tension, ethanol is expected to better wet the samples, and thus yield lower porosity rates than those obtained with demineralized water. However, the results do not confirm this as-sumption. An explanation may be that low surface tensions stabilize occluded bubbles in afluid, thus stabilizing air bubbles.
The comparison of experimental data provides similar evolution of porosity rate with experimental conditions for the threefluids. It was
Fig. 7. Helium pycnometry density measurement.
chosen to perform further optimization with water as the standard deviation obtained with demineralized water remained around 10% of the porosity rate value. Moreover, the choice of demineralized water is also validated by the fact that pure acetone and ethanol are hygro-scopic. This property makes their purity deteriorate with time, as they absorb the water from the air.
In a second step, samples were polished to modify their surface roughness (Sa inμm) in order to address the influence of surface finish on the accuracy of density measurements, through possible variations of wetting. Indeed it was supposed that a sample with a high Sa is more likely to entrap air bubbles and to affect results. Three Sa conditions were compared: as SLM-built (˜ 12 +/- 2 μm for the 7 experimental conditions), mirror polished (˜ 0.01 μm) and sand blasted (˜ 4 μm). It can be seen that for“as manufactured samples” (high Sa), the porosity rate and the standard deviation are lower than for the“mirror polished” (Fig. 10). A possible explanation may be that mirror polishing or sandblasting texturize the surface relatively homogeneously, thus
making it hydrophobic according to a possible“Lotus Effect” [34]. In-deed, lotus leaves are well known to be hydrophobic: water droplets falling onto the leaves will bead of and roll on, but they do not wet the surface. This is due to the surface micro-texture of the leaves. They are covered with micro-papilla (˜ 10 μm height), themselves covered with nano-papilla (˜100 μm). It provides air pocket formation, thus, water can only interact with the peaks of the roughness surface instead of wetting the entire surface, including peaks and valleys. First, the for-mation of micro air pocket at the sample surface can distort the results, and the wettability of the samples being greatly reduced. This would lead to an overestimation of the measured volume, and an under-estimation of porosity rate. On the other hand, the“as manufactured” surface can absorb thefluid by capillarity and increase the wettability of the surface.
Finally, samples were cut to determine the influence of the analyzed volume. Initially they were around 2.5 cm3and they were cut to obtain
samples of 1 cm3. Results show that the higher the samples volume, the lower the porosity rate as well as the standard deviation (Fig. 11). This means that minimizing the specific surface (S/V) is a key-point for stabilizing results.
To conclude, results presented here indicate that the Archimedes method should be preferentially used with demineralized water on“as manufactured” samples of at least 2 cm3in volume. Depending on
ex-perimental conditions, variations of up to +/- 20% can occur for por-osity rate values in the 1–5 % range. Other precautions are also re-commended before starting measurements: (1) to clean samples in ultrasound bath to evacuate the powder stuck on the surface, (2) to dry them between each measurement and evacuate visible air bubbles by immersing samples in a beaker containing demineralized water and softly brushing them before measuring in thefluid.
It has also been observed that the larger the samples (at least 2 cm3),
the more accurate the measurements and the lower the errors. For this reason, samples of 2.5 cm3have been preferentially considered in this
Fig. 9. Comparison of the porosity rate of P2 to P7 samples according to the fluid used.
Fig. 10. Comparison of the porosity rate of P2 to P7 samples according to their surfacefinish (experiments in water).
Fig. 11. Porosity rate of P2 to P7 samples according to their analyzed volume.
Table 4
Main technical characteristics of the optical microscope.
Magnification Resolution Micrograph size Acquisition time of an area of 38 mm²
x50 1.374μm / pix 2452 * 2056 pix 6 seconds (4 micrographs) x100 0.689μm / pix 16 seconds (16 micrographs) X200 0.343μm / pix 53 seconds (64 micrographs)
study. However, using larger volumes can become problematic for both Archimedes method and helium pycnometry for which the size of the measurement cell is limited.
3.2. Micrographic method
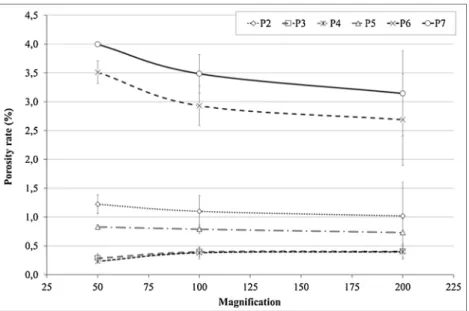
The micrographic method can be applied with different magnifica-tions (x 50, x 100 and x 200) and thefinal results can vary a lot ac-cording to the number of pictures and the magnification considered.
The first step of the optimization was to determine which
Fig. 12. Porosity rate of 5 samples according to the micrographic magnification (analyzed surface = 19 mm²).
magnification is suitable for the porosity rate measurement. Indeed, a too low magnification could occult the small porosities, and a too high magnification could not be representative of the global sample. Microscope technical characteristics are summarized in the Table 4. Two areas of˜9,5 mm2, corresponding to one x 50 micrograph, were
first analyzed for different samples. Then, the same areas were analyzed
with the x 100 and x 200 magnifications (respectively 4 micrographs/ area and 16 micrographs/area). It can be seen that the use of magni-fication increasingly important for the analysis tends to increase stan-dard deviation (Fig. 12) and to modify the porosity rate: porosity rates higher than 1% (P6, P7) will tend to decrease, whereas under 1% they will increase. Those effects are more visible for samples with higher porosity levels, and are confirmed by [28]. In addition, the higher the porosity rate, the greater the standard deviations. Indeed, as porosities are not homogeneously distributed in the material, the porosity rate can vary between each micrograph leading to an increase in the standard deviation.
Micrographs obtained with a x100 magnification have pixel size of 0.69μm which means first that porosities with an area upper to 0.5 μm² can be detected and taken into account (which is subject to a correct contrast between the metal and the porosity when acquiring the mi-crographs, as well as a good definition of the porosities contours). That is also why, this magnification was selected for porosity analysis.
In a second step, the number of pictures required to provide sa-tisfactory results was determined with the x100 magnification. For the previous samples (Fig. 13) it appears that for the highest porosity rates (> 1%), at least 20 micrographs are needed to obtain a stabilized value (Fig. 13a) whereasFig. 13b shows that the standard deviation is not stabilized before using 45 micrographs. For samples with a porosity rate below 1%, only 20 micrographs are shown to be sufficient to obtain stabilized porosity rates and standard deviations.
Finally, a possible procedure would be as follows: (a) afirst mi-crograph has to be taken to estimate the porosity rate at x100 magni-fication, (b) if the value is higher than 1%, 45 micrographs have to be considered (analyzed area˜ 107 mm²) and if the value is lower than 1%, 20 micrographs are enough (analyzed area˜ 47 mm²).
For those reasons, the next micrographic analyses were carried out with the x100 magnification and with either 20 or 45 micrographs for each analyzed surface.
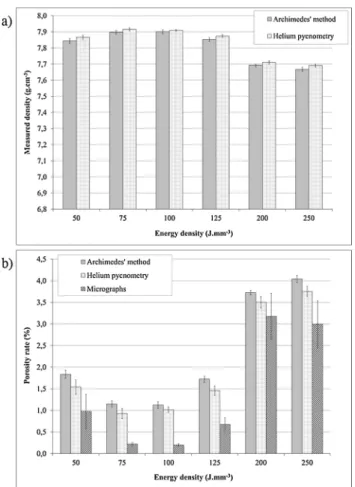
3.3. Comparison of the optimized measurement methods
Density measurements for Archimedes and helium pycnometry methods, and porosity calculations for the three methods are compared inFig. 14with error bars corresponding to the standard deviations.
First of all, it clearly appears that at low VED, the energy injected in
Fig. 14. (a) density measurements and (b) porosity rate estimation for P2 to P7 samples (50–250 J/mm3).
the powder is not large enough to perfectly melt it. This results in very porous samples (P2 = 50 J/mm3). An increase of the VED leads to a
better densification of the samples (P3 = 75 J/mm3, P4 = 100 J/mm3).
Above a certain VED threshold (> 120 J/mm3), the porosity rate in-creases in correlation with the formation of a key-hole regime (samples P6 = 200 J/mm3and P7 = 250 J/mm3). This tendency is well known
and several authors [12–14] have already observed it on various
materials (such as aluminum alloys, maraging steels, stainless steels) processed using various manufacturing parameters.
The increase in porosity rate observed at high VED, and assumed to be due to the destabilization of the key-hole welding mode is in full agreement with a recent simulation work by Tang [35].
Moreover, it can be seen (Fig. 14a) that the two methods (Archi-medes and Pycnometry) which give a quasi-direct access to the density
Fig. 16. Micrographic cross-sections of samples P2, P4, P5 and P7 samples (50, 100, 125 and 250 J/mm3) corresponding to respectively 1.8%, 1.1%, 1.7% and 5%
porosity rates (Archimedes method).
of each sample give rather similar results with less than 0.3% difference in porosity rate (Fig. 14b). This is in contradiction with [29] who did
not find a good accuracy in pycnometry measurements of samples
having a low porosity rate (< 0.5%). The reason why lower porosity rates are obtained with helium pycnometry is possibly due to the fact that open pores are more likely to befilled with small helium atoms (0.31 Å) than with larger water molecules (2.75 Å). Thus fewer poros-ities will be considered with helium measurement. Another explanation is related to the difference of dynamic viscosities of helium and water, thefirst one being more than 40 time less viscous (Helium 25 °C, 1 bar : 19.68.10-6 Ns/m² ; water 25 °C, 1 bar : 891.10-6 Ns/m²). This is as-sumed to be the main reason why the density values obtained by helium pycnometry are greater than those obtained by the Archimedes method. Considering these results and the theoretical density of the material (stainless steel 316 L:ρtheoretical= 7,99 g.cm−3), it becomes possible to
calculate the porosity rate of each sample, and for each measurement method (Fig. 14b). However each theoretical density should be used with caution, and operators have to keep in mind that it probably does not correspond to the reality. Indeed, it is know that light elements used in alloys processed with SLM or EBM tend to evaporate [36,37], which modify the chemical composition and thus the material density.
According to Delesse’s principle, which states that “the ratio of the area occupied by a component relative to the entire profile area is a con-sistent estimate of the volume fraction of the component in the object” [38], we should measure similar porosity rates with the Archimedes’ method, the gas pycnometry and the micrographic cross section.
However, it appears that the micrographic cross sections method tends to underestimate the porosity rate, even if several cross sections are considered (parallel and perpendicular to the building direction), unlike [29] who shows similar results between the Archimedes method and the micrographic cross sections method. We can find that [39] explains that the Delesse’s principle should be used carefully, and can be applied only if equal reference areas are used. It means that the each micrograph must have the same size, which is our case in this study. This does not explains the underestimation of the porosity rates.
A possible explanation could be due to the porosities morphology, which is mainly random and irregular in additive manufacturing (especially for LOF at low VED,Fig. 3a). Depending on the depth at which the section is made, the porosity section is very different and the Delesse’s principle is not checked (Fig. 15). That is why it can be ne-cessary to repeat this method several times for a same sample (with a light polishing step between each observations), in order to stabilize the result by calculating an average porosity rate value over several sec-tions.
Another explanation may be that the sample surface or near-surface porosity rate, which are usually higher due to contour-hatching
transitions, are not considered in the micrographic observation. It is interesting to notice that in the case of the sample P2 (50 J/ mm3), LOF porosities are full of unmelted powder, which is taken into
account during the Archimedes’ Method or gas pycnometry. This gives the real volume of void for each porosity of the sample but, during the sample preparation for the micrographic cross sections analysis, this unmelted powder is evacuated from porosities and tends to distort the measured void volume.
Figs. 16and17show micrographic cross-sections of each sample, before and after being etched with 92:5:3 reagent (92% HCl + 5% H2SO4+ 3% HNO3, recommended in [40]) to reveal SLM beads. It can
be seen that at low VED (sample P2, 50 J.mm−3), porosities are mainly LOF. The increase of the VED progressively leads to a better densi fi-cation (sample P4). The remaining porosities are very localized melting defects (angular porosities) or entrapped gases (rounded porosities). These entrapped gas porosities can be promoted by the occurrence of a key-hole regime (larger pores), or by the presence of gas or humidity in the powder bed. Then, an excessive VED will melt the powder in key-hole mode and no longer in conduction mode, hence the presence of gas porosities (samples P5 to P7, respectively 125 and 250 J.mm−3).
Bead geometries were analyzed on micrographic cross-sections (Fig. 17), allowing to measure width to depth ratios (WDR). All the WDR are comprised between 0.48 and 0.8 (Table 5), which indicates that for all the experimental conditions e > > D, and that a full con-duction regime was not achieved. For all SLM conditions, bead shapes suggest the occurrence of key-hole formation, even if key-hole poros-ities are not visible in each sample micrographic cross sections (samples P2 or P3 for example).
Moreover, [41] suggests that lack of fusion porosity can be pre-dicted by the SLM bead overlap versus their dimensions (Eq.(2)). In the case where the bead overlap is inferior to 1, incomplete melting is avoided. It means that the overlap of SLM beads is sufficient between each bead of each layer, and between each layers of the sample to avoid LOF.
However, for all the conditions considered, the bead overlap is su-perior to 1 (Table 5), which means that Eq.(2)is not fully reliable to estimate the full consolidation limits.
Logically, the dimensional ratio calculated by Eq.(2)decrease as the densification increase, such as with sample P2 and sample P4 (respec-tively 1,78 ± 0,09 and 1,18 ± 0,08) (regardless gas porosities). This means that, even such ratios are superior to 1, they can be considered as an accurate geometrical method for estimating a-priori the degree of consolidation from the dimensions of single melt-pool geometries.
One explanation is that, at high VED, Eq.(2)is no longer relevant because porosities are not LOF anymore but entrapped gas due to the key-hole mode.
The repeatability of the three methods is related to the standard deviations of the samples compared to their average porosity rate. The
Table 6shows that Helium pycnometry and Archimedes methods ex-hibit an error ratio equal or lower than 10% for 10 measurements. This shows that several measurements (10 in our case) give quite similar results.
However, repeatability is probably not the best criterion for choosing one method over another. We advise instead to choose the method depending on the type of sample (shape, size, destructible or not), the results we want to obtain (type of porosity, location, average
Table 5
Porosity measurements, bead dimensions and bead overlaps for P2, P4, P5, P7 samples.
VED (J/mm3) % porosity WDR Bead overlap P2 50 1.835 +/- 0.188 0.8+/- 0.06 1.78 +/- 0.09 P4 100 1.124 +/- 0.156 0.48 +/- 0.01 1.18 +/- 0.08 P5 125 1.723 +/- 0.148 0.49 +/- 0.04 1.34 +/- 0.10 P7 250 4.04 +/- 0.172 0.5 +/- 0.03 1.47 +/- 0.03
Table 6
Repeatability of the measurement for each method, where % P is the average porosity rate;σ is the standard deviation and ER the error ratio (ER=(σ*100)/%P).
Samples references Helium Pycnometry Archimedes’ Method Micrographic cross section
%P σ ER %P σ ER %P σ ER
P2 1.539 0.168 10.9% 1.835 0.188 10.2% 1.009 0.43 42.6% P7 3.751 0.118 3.1% 4.040 0.172 4.3% 2.412 0.499 20.7%
porosity rate, trend between samples), the material available and the time allotted.
4. Conclusion
Based on a detailed comparison of three experimental methods, it can be concluded that the Archimedes’ method carried out in demi-neralized water is a reliable technique for estimating porosity rate in SLM samples.
Pycnometry measurements using helium and independent mea-surements of masses and volumes can be considered the most accurate technique for measuring porosity. However, because helium pycno-metry is very time consuming, this method is ill-adapted as a systematic porosity rate control method. The results obtained with the Archimedes’ method are very similar to those obtained by helium pycnometry. Because the Archimedes’ method is both rapid and reli-able, it is an efficient alternative to helium pycnometry. Another ad-vantage of the Archimedes’ method is that it is a non-destructive technique.
To ensure the reliability of the Archimedes’ method, some pre-liminary precautions are necessary: air bubbles must be evacuated with the aid of a brush before weighing the samples in thefluid and suffi-ciently large samples (2 cm3minimum) must be used. However, open
porosities and powder grains agglomerated on the surface are known to skew the measurements.
On the other hand, the position and the type of porosities present in the samples can only be determined by micrographic cross-section analysis. Because this method measures a 2D fraction area of a 3D porosity, the technique tends to underestimate the real porosity rate. Moreover, the volume of the pores cannot be accurately measured, especially in the case of irregular LOF pores.
Finally it has been shown that the VED input affects the overall porosity rate. Low input energies favor LOF pores, while excessive en-ergies promote key-hole pores and spatters. Between these two ex-tremes there is a wide range of VED in which it is fairly easy to densify material up to 99%, whereas if the SLM parameters are correctly op-timized, densities up to 99,95% [9] can be achieved.
Declaration of interests
The authors declare that they have no known competingfinancial interests or personal relationships that could have appeared to in flu-ence the work reported in this paper.
Acknowledgments
Authors would like to deeply thank the French Aerospace Lab (ONERA), and particularly Marc THOMAS, Odile LAVIGNE and Stefan DRAWIN for allowing them to carry out helium pycnometry measure-ments.
They would also like to thank BPI France forfinancial support of the FAIR project and Air Liquide for helpful discussions and technical support.
References
[1] P. Nandwana, A.M. Elliott, D. Siddel, A. Merriman, W.H. Peter, S.S. Babu, Powder bed binder jet 3D printing of Inconel 718: densification, microstructural evolution and challenges, Curr. Opin. Solid State Mater. Sci. 21 (2017) 207–218,https://doi. org/10.1016/j.cossms.2016.12.002.
[2] E. Herderick, Additive manufacturing of metals: a review, Mater. Sci. Technol. Conf. Exhib. 2 (2011) (2011) 1413–1425 MS T’11http://www.scopus.com/inward/ record.url?eid=2-s2.0-84856301323&partnerID=40&md5=
e02018d10b2ca37a7e2ae1773e4fcaec.
[3] B. Vayre, F. Vignat, F. Villeneuve, Metallic additive manufacturing: state-of-the-art review and prospects, Mech. Ind. 13 (2012) 89–96,https://doi.org/10.1051/meca/ 2012003.
[4] EPMA, Introduction to Additive Manufacturing Technology, A Guide for Designers
and Engineers, Eur. Powder Metall. Assoc., 2015, pp. 28–34http://www.sf2m.asso. fr/CommissionsThematiques/DocComThematiques/EPMA_Additive_
Manufacturing.pdf.
[5] D. Herzog, V. Seyda, E. Wycisk, C. Emmelmann, Additive manufacturing of metals, Acta Mater. 117 (2016) 371–392,https://doi.org/10.1016/j.actamat.2016.07.019. [6] W.J. Sames, F.A. List, S. Pannala, R.R. Dehoff, S.S. Babu, The metallurgy and
pro-cessing science of metal additive manufacturing, Int. Mater. Rev. 61 (2016) 315–360,https://doi.org/10.1080/09506608.2015.1116649.
[7] T. DebRoy, H.L. Wei, J.S. Zuback, T. Mukherjee, J.W. Elmer, J.O. Milewski, A.M. Beese, A. Wilson-Heid, A. De, W. Zhang, Additive manufacturing of metallic components– process, structure and properties, Prog. Mater. Sci. 92 (2018) 112–224,https://doi.org/10.1016/j.pmatsci.2017.10.001.
[8] A. Fatemi, R. Molaei, S. Sharifimehr, N. Phan, N. Shamsaei, Multiaxial fatigue be-havior of wrought and additive manufactured Ti-6Al-4V including surfacefinish effect, Int. J. Fatigue 100 (2017) 347–366,https://doi.org/10.1016/j.ijfatigue. 2017.03.044.
[9] A.M. Mancisidor, F. Garciandia, M.S. Sebastian, P. Alvarez, J. Diaz, I. Unanue, Reduction of the residual porosity in parts manufactured by selective laser melting using skywriting and high focus offset strategies, Phys. Procedia 83 (2016) 864–873,https://doi.org/10.1016/j.phpro.2016.08.090.
[10] D. Wang, S. Wu, F. Fu, S. Mai, Y. Yang, Y. Liu, C. Song, Mechanisms and char-acteristics of spatter generation in SLM processing and its effect on the properties, Mater. Des. 117 (2017) 121–130,https://doi.org/10.1016/j.matdes.2016.12.060. [11] V. Gunenthiram, P. Peyre, M. Schneider, M. Dal, F. Coste, I. Koutiri, R. Fabbro,
Experimental analysis of spatter generation and melt-pool behavior during the powder bed laser beam melting process, J. Mater. Process. Technol. 251 (2018) 376–386,https://doi.org/10.1016/j.jmatprotec.2017.08.012.
[12] N. Kaufmann, M. Imran, T.M. Wischeropp, C. Emmelmann, S. Siddique, F. Walther, Influence of process parameters on the quality of aluminium alloy en AW 7075 using Selective Laser Melting (SLM), Phys. Procedia 83 (2016) 918–926,https:// doi.org/10.1016/j.phpro.2016.08.096.
[13] H. Gu, H. Gong, P. Deepankar, R. Khalid, S. Thomas, B. Stucker, Influences of en-ergy density on porosity and microstructure of selective laser melted 17-4PH stainless steel, J. Chem. Inf. Model. 53 (2013) 1689–1699,https://doi.org/10. 1017/CBO9781107415324.004.
[14] S.L. Campanelli, N. Contuzzi, A. Angelastro, A.D. Ludovico, Capabilities and per-formances of the selective laser melting process, Ew Trends Technol. Devices Comput. Commun. Ind. Syst. (2010) 233–252,https://doi.org/10.5772/10432
Chapter 13.
[15] Joon-Phil Choi, Gi-Hun Shin, Mathieu Brochu, Yong-Jin Kim, Sang-Sun Yang, Kyung-Tae Kim, Dong-Yeol Yang, Chang-Woo Lee, Ji-Hun Yu, Densiication beha-vior of 316L stainless steel parts fabricated by selective laser melting by variation in laser energy density, Mater. Trans. 57 (2016) 1952–1959,https://doi.org/10.2320/ matertrans.M2016284.
[16] G. Kasperovich, J. Haubrich, J. Gussone, G. Requena, Correlation between porosity and processing parameters in TiAl6V4 produced by selective laser melting, Mater. Des. 105 (2016) 160–170,https://doi.org/10.1016/j.matdes.2016.05.070. [17] R. Li, Y. Shi, Z. Wang, L. Wang, J. Liu, W. Jiang, Densification behavior of gas and
water atomized 316L stainless steel powder during selective laser melting, Appl. Surf. Sci. 256 (2010) 4350–4356,https://doi.org/10.1016/j.apsusc.2010.02.030. [18] O. Andreau, I. Koutiri, P. Peyre, J.-D. Penot, N. Saintier, E. Pessard, T. De Terris, C. Dupuy, T. Baudin, Texture control of 316L parts by modulation of the melt pool morphology in selective laser melting, J. Mater. Process. Technol. 264 (2019),
https://doi.org/10.1016/j.jmatprotec.2018.08.049.
[19] V. Gunenthiram, P. Peyre, M. Schneider, M. Dal, F. Coste, R. Fabbro, Analysis of laser–melt pool–powder bed interaction during the selective laser melting of a stainless steel, J. Laser Appl. 29 (2017) 022303, ,https://doi.org/10.2351/1. 4983259.
[20] M. Taheri Andani, R. Dehghani, M.R. Karamooz-Ravari, R. Mirzaeifar, J. Ni, A study on the effect of energy input on spatter particles creation during selective laser melting process, Addit. Manuf. 20 (2018) 33–43,https://doi.org/10.1016/j.addma. 2017.12.009.
[21] M.J. Matthews, G. Guss, S.A. Khairallah, A.M. Rubenchik, P.J. Depond, W.E. King, Denudation of metal powder layers in laser powder bed fusion processes, Acta Mater. 114 (2016) 33–42,https://doi.org/10.1016/j.actamat.2016.05.017. [22] M. Tang, P. Chris Pistorius, J.L. Beuth, Prediction of lack-of-fusion porosity for
powder bed fusion, Addit. Manuf. 14 (2017) 39–48,https://doi.org/10.1016/j. addma.2016.12.001.
[23] William M. Steen, Jyotirmoy Mazumder, Laser Material Processing, 4th ed., (2010). [24] T. Qi, H. Zhu, H. Zhang, J. Yin, L. Ke, X. Zeng, Selective laser melting of Al7050
powder: Melting mode transition and comparison of the characteristics between the keyhole and conduction mode, Mater. Des. 135 (2017) 257–266,https://doi.org/ 10.1016/j.matdes.2017.09.014.
[25] R. Fabbro, Melt pool and keyhole behaviour analysis for deep penetration laser welding, J. Phys. D Appl. Phys. 43 (2010),https://doi.org/10.1088/0022-3727/ 43/44/445501.
[26] L.L. Parimi, G. Ravi, D. Clark, M.M. Attallah, Microstructural and texture devel-opment in direct laser fabricated IN718, Mater. Charact. 89 (2014) 102–111,
https://doi.org/10.1016/j.matchar.2013.12.012.
[27] A.B. Spierings, G. Levy, Comparison of density of stainless steel 316L parts pro-duced with selective laser melting using different powder grades, Solid Free, Solid Freeform Fabr. Symp. Proc. (2009) 342–353.
[28] A.B. Spierings, M. Schneider, R. Eggenberger, Comparison of density measurement techniques for additive manufactured metallic parts, Rapid Prototyp. J. 17 (2011) 380–386,https://doi.org/10.1108/13552541111156504.
the quality assessment of selective laser melted parts, CIRP Ann. Manuf. Technol. (2016),https://doi.org/10.1016/j.cirp.2016.04.054.
[30] P. Wang, X. Tan, C. He, M.L.S. Nai, R. Huang, S.B. Tor, J. Wei, Scanning optical microscopy for porosity quantification of additively manufactured components, Addit. Manuf. 21 (2018) 350–358,https://doi.org/10.1016/j.addma.2018.03.019. [31] ASTM International, Standard Test Method for Density Of Powder Metallurgy (PM) Materials Containing Less Than Two Percent Porosity, Astm, 2013, pp. B311–13. [32] W. York-, B. Fw, J. Wiley, N. York, W. York-, A.J. Angstrom, W. Rc, T. Chemical, R. Co, B. Roton, S. Angstrom, L.R.D. Aatcc, T. Chemists, Encyclopedic dictionary of polymers, Encycl. Dict. Polym. 61 (2007), https://doi.org/10.1007/978-0-387-30160-0_698.
[33] OIML, International Alcoholometric Tables (n.d.), (2019)http://2013.oiml.org/ publications/R/R022-f75.pdf.
[34] M. Zhang, S. Feng, L. Wang, Y. Zheng, Lotus effect in wetting and self-cleaning, Biotribology 5 (2016) 31–43,https://doi.org/10.1016/j.biotri.2015.08.002. [35] C. Tang, J.L. Tan, C.H. Wong, A numerical investigation on the physical
mechan-isms of single track defects in selective laser melting, Int. J. Heat Mass Transf. 126 (2018) 957–968,https://doi.org/10.1016/j.ijheatmasstransfer.2018.06.073.
[36] T. Mukherjee, J.S. Zuback, A. De, T. DebRoy, Printability of alloys for additive manufacturing, Sci. Rep. 6 (2016) 1–8,https://doi.org/10.1038/srep19717. [37] A. Klassen, V.E. Forster, V. Juechter, C. Körner, Numerical simulation of
multi-component evaporation during selective electron beam melting of TiAl, J. Mater. Process. Technol. 247 (2017) 280–288,https://doi.org/10.1016/j.jmatprotec. 2017.04.016.
[38] Stereology Terms | Stereology Information Center, (2019) (n.d.) (Accessed 27 March 2019),http://www.stereology.info/glossary-terms/.
[39] T.M. Mayhew, O. Mayhew, L.‐M. Cruz Orive, Caveat on the use of the Delesse principle of areal analysis forestimating component volume densities, J. Microsc. 102 (2) (1974) 195–207 102.
[40] G.F. Vander Voort, Metallographic techniques for tool steels, ASM Handbook, Vol. 9 Metallogr. Microstruct. 9 (2004), pp. 644–669,https://doi.org/10.1361/ asmhba0003766.
[41] M. Tang, P.C. Pistorius, Oxides, porosity and fatigue performance of AlSi10Mg parts produced by selective laser melting, Int. J. Fatigue 94 (2017) 192–201,https://doi. org/10.1016/j.ijfatigue.2016.06.002.
![Fig. 2. Illustration of the key dimensions to estimate the formation of LOF, according to [22].](https://thumb-eu.123doks.com/thumbv2/123doknet/7441533.220691/3.892.67.420.81.458/fig-illustration-key-dimensions-estimate-formation-lof-according.webp)