Title: clones stably expressing interferon-α2b Auteurs:
Authors: Edwige Arnold, Iness Hammami, Jingkui Chen, Sachin Gupte, Yves Durocher et Mario Jolicoeur Date: 2016
Type: Article de revue / Journal article Référence:
Citation:
Arnold, E., Hammami, I., Chen, J., Gupte, S., Durocher, Y. & Jolicoeur, M. (2016). Overexpression of G6PDH does not affect the behavior of HEK-293 clones stably expressing interferon-α2b. AIMS Bioengineering, 3(3), p. 319-336.
doi:10.3934/bioeng.2016.3.319
Document en libre accès dans PolyPublie Open Access document in PolyPublie
URL de PolyPublie:
PolyPublie URL: https://publications.polymtl.ca/3602/
Version: Version officielle de l'éditeur / Published versionRévisé par les pairs / Refereed Conditions d’utilisation:
Terms of Use: CC BY
Document publié chez l’éditeur officiel
Document issued by the official publisher Titre de la revue:
Journal Title: AIMS Bioengineering (vol. 3, no 3)
Maison d’édition:
Publisher: AIMS Press
URL officiel:
Official URL: https://doi.org/10.3934/bioeng.2016.3.319
Mention légale:
Legal notice:
Ce fichier a été téléchargé à partir de PolyPublie, le dépôt institutionnel de Polytechnique Montréal
This file has been downloaded from PolyPublie, the institutional repository of Polytechnique Montréal
27 July 2016 DOI: 10.3934/bioeng.2016.3.319 Received: 15 June 2016 Accepted: 18 July 2016 Published: http://www.aimspress.com/journal/Bioengineering Research article
Overexpression of G6PDH does not affect the behavior of HEK-293
clones stably expressing interferon-α2b
Edwige Arnold 1, Iness Hammami 1, Jingkui Chen 1, Sachin Gupte 2, Yves Durocher 3, and
Mario Jolicoeur 1,*
1 Research Laboratory in Applied Metabolic Engineering, Department of Chemical Engineering,
École Polytechnique de Montréal, Montréal, Québec, Canada
2 Department of Pharmacology, New York Medical College, Valhalla, NY 10595 3 National Research Council, Montréal, Québec, Canada
* Correspondence: Email: mario.jolicoeur@polymtl.ca; Tel: +1-514-340-4711 ext. 4525; Fax: +1-514-340-4159.
Abstract: HEK293 cells are gaining in interest for the production of recombinant proteins. However, further understanding and engineering of cell metabolism are still needed to improve protein titers. The importance of G6PDH has already been studied regarding redox balance, and a correlation has recently been established between the oxidative pentose phosphate pathway (PPP) and antibody peak production. In this work, HEK293 cells stably expressing interferon-α2b, a parental clone, and a further engineered clone expressing the cytosolic yeast pyruvate-carboxylase (PYC) were transiently transfected to overexpress glucose-6-phosphate dehydrogenase (G6PDH) and increase fluxes through the PPP. The aim of the study was thus to evaluate the effect of overexpressing G6PDH on the “pull” effect brought by the PYC phenotype. Results indicate that the cell metabolism is, however, highly robust, showing a highly regulated PPP damping the potential effects of overexpressing G6PDH. A metabolomic study also clearly demonstrates, by metabolites profiling, that the PYC clone has a highly robust and more efficient metabolic efficiency, compared to its parental clone.
Keywords: G6PDH overexpression; Pentose Phosphate Pathway; HEK-293; metabolomics; cell energetics; Pyruvate Carboxylase
Abbreviations
ADP Adenosine diphosphate Ala Alanine
AMP Adenosine monophosphate ATP Adenosine triphosphate Asn Asparagine
Asp Aspartate Arg Arginine
CTP Cytidine triphosphate
DHAP Dihydroxyacetone phosphate
DsRed A red fluorescent protein originally obtained from Discosoma sp. FAD Flavine adénine dinucléotide
G6P Glucose-6-phosphate GA3P Glyceraldehyde-3-phosphate Glu Glutamate Gln Glutamine Gly Glycine Gly3P Glycerol-3-phosphate GTP Guanosine triphosphate
HEK-293 Human embryonic kidney cell line 293 Ile Isoleucine
Leu Leucine Met Methionine
NAD+ Nicotinamide adenine dinucleotide, oxidizing agent
NADH Nicotinamide adenine dinucleotide, reducing agent
NADP+ Nicotinamide adenine dinucleotide phosphate, oxidizing agent
NADPH Nicotinamide adenine dinucleotide phosphate, reducing agent Phe Phenylalanine
Pro Proline
PYC Pyruvate carboxylase Thr Threonine
Tyr Tyrosine
UDPG Uridine diphosphate glucose UTP Uridine triophosphate
Val Valine
1. Introduction
The mammalian cell platform is now seen as the workhorse of the recombinant protein industry because of its ability to perform proper protein folding and assembly, and post- translational modifications. Even if CHO cell lines appear to be the preferred hosts, HEK293 cells are gaining in interest for the production of recombinant proteins. Firstly used for the production of various viral
vectors [1,2], their attractiveness lies in their human origin, a high transfectability and their capacity to grow in serum-free media in suspension [2,3]. Loignon et al. [4–6] have recently described the establishment of an IFN-α2b stably-expressing HEK293 clone (D9) and of its further improved pyruvate carboxylase (PYC) expressing clone (F5), which showed to allow an increase of the maximum cell density, and a decrease of lactate and ammonia production in batch culture, thus decreasing the secretion of toxic metabolic by-products [7–9]. This phenotype was successfully exploited by Vallée et al. [10] through a fed-batch culture strategy leading to an increase of the maximum cell density up to 107 cells/mL and a 4-fold increase of the yield in interferon, compared to
a batch culture of the parental clone. These achievements clearly showed the benefit of “pulling” on the metabolism bypassing a well- controlled entry point to the Krebs’ cycle (TCA), as showed by a 13C MFA (Metabolic Flux Analysis) study [4]. This work also reveals, however, the need of combining a coherent set of metabolic engineering works to succeed redirecting carbon flow maximizing the cell specific productivity without affecting cell growth rate, since the HEK293 PYC clone showed similar cell specific productivity in interferon. It is well known that the production of recombinant proteins results in a metabolic burden and is energetically costly with three ATP molecules required for the synthesis of one peptide bond [11,12]. This high energetic demand is not only related to the synthesis of the building blocks for protein synthesis and translation and transcription, such as amino acids and nucleotides, but also at all stages including protein folding [7].
The use of metabolic flux analysis (MFA) and 13C labeling recently showed that the peak antibody production occurs at late exponential and stationary phases, and is associated with elevated oxidative pentose phosphate pathway (PPP) activity and high NADPH production rate [12–14]. In the contrary, the peak cell growth rate is observed at mid-exponential phase and is characterized by a high glycolytic rate. Dean and Reddy [15] have hypothesized that high producer clones may be characterized by a highly active oxidative metabolism. Indeed, products of PPP include ribose-5-phosphate and erythrose-4-ribose-5-phosphate, which are involved in nucleotides and amino acids synthesis, and NADPH as a reducing agent. In previous works, we showed that the oxidative PPP was more active in CHO cell cultures performed at low-density with a higher specific production and growth rate compared to high-density cell cultures [16]. Furthermore, strategies aiming at redirecting the carbon flux through PPP have already been proven successful in bacteria and yeasts through G6PDH overexpression or combined with other enzymes [17–20], since NADPH is mostly synthesized via PPP by the G6PDH enzyme and to a lesser extent by 6PGD, malic enzyme and isocitrate dehydrogenase [21–24]. In addition and of interest, G6PDH is thought being necessary to counter the damages caused by reactive oxygen species (ROS) and restore the redox balance [22,25–28], such as a stressful metabolic load from recombinant protein processing.
In this work, we have investigated the effect of enhancing the rate of entry of G6P into PPP, thus bypassing the highly regulated glycolysis upstream [29], on the production yield and maximum cell density in HEK-293 cells. We have overexpressed the G6PDH gene level by transient transfection of HEK293 D9 and F5 clones in batch cultures, therefore exploiting the “pulling” effect of the PYC cells. The analysis of G6PDH activity and of the cell metabolome revealed a high cell metabolic robustness and a high PPP regulation level.
2. Material and Methods 2.1. Cell lines
The parental cell line HEK293-D9, stably expressing interferon-α2b, is derived from the HEK-6E cell line constitutively expressing the EBNA1 protein from the Epstein-Barr virus [6]. The HEK293-F5 clone was generated from the parental cell line by transfection of the cytoplasmic yeast pyruvate carboxylase 2 gene (PYC) [5] (Gene ID: 852519) as described by Henry and Durocher [4]. 2.2. Cell culture
Before culturing the cells, fresh Freestyle F17 expression medium (Invitrogen Life Technology, USA) was supplemented with 4 mM glutamine (Sigma-Aldrich, USA) and 0.1% (w/v) Kolliphor P188 (Sigma-Aldrich). Cells were inoculated at 0.2 × 10⁶ cells/mL in 125 mL shake-flasks (VWR, Canada) and grown in suspension at 37 °C under 5% CO2 on an orbital shaker at 120 RPM. Batch
experiments were carried out in duplicate at a 20 mL initial working volume. Cells (except negative control) were transfected at a 2 × 10⁶ cells/mL density. Cultures were harvested each day and supernatants were collected by centrifugation at 300 g for 5 min. Samples were stored at − 20°C for subsequent analyses.
2.3. Plasmids and cell transfection
Empty plasmid pDsRed-Monomer-N1 was obtained from Clontech Laboratories (USA) and was used as a control to assess the impact of transfection. The modified pDsRed1-N1 vector used to overexpress G6PDH was provided by Dr. Gupte [30]. Because of commercial unavailability, the two plasmids differ in that they have not the same fluorescent protein. The pDsRed-Monomer-N1 plasmid codes for the monomeric DsRed protein (max. excitation/emission at 557/592 nm) and the pDsRed1-N1 vector codes for the original DsRed protein (558/583 nm). DsRed is fused with G6PDH, thus allowing the direct screening of the secreted molecule. It has been reported that the DsRed from pDsRed-N1 is only fluorescent as oligomers [31]. 25 kDa linear polyethylenimine (PEI) was obtained from Sigma-Aldrich. The PEI solution was prepared as reported by Tom et al. [32]. DNA and PEI were incubated in 10% of the final volume in culture medium without Kolliphor for 10 min at room temperature and then added to cultures. Final DNA concentration in the media was set at 1 µg/mL. Early tests were performed to assess PEI/DNA ratios (data not shown) and a 2:1 PEI:DNA ratio was found to be optimal. Transfection efficiency was screened using a fluorescence microscope (ZEISS Observer.Z1).
2.4. Metabolites extraction
3 × 10⁶ cells were washed with cold PBS and extracted with 400 µL of 80% cold methanol in
the presence of 0.2 g of sand (Sigma-Aldrich). After 30 min on dry ice, the mixture was vortexed and sonicated in iced water bath for 5 min. The mixture was then centrifuged for 7 min at 21,000 g and 4 °C to collect supernatants. Pellets were extracted a second time with 200 µL of 50% cold methanol and a third time with 200 µL of cold water as described above. Supernatants were mixed, filtered
through 0.2 µm PTFE filters (VWR) and stored at −80°C for subsequent analyses. 2.5. Analytical methods
Cell density and viability were assessed with a hemocytometer and a standard light microscope using the trypan blue exclusion method. High cell density samples were diluted in phosphate-buffer saline (Sigma-Aldrich) before mixing with the exclusion dye. Glucose, lactate, glutamine and glutamate concentrations were measured using a dual-channeled immobilized oxidase enzyme biochemistry analyzer (2700 SELECT, YSI Inc. Life Sciences, Yellow Springs, OH, USA) using calibration buffers provided by the manufacturer. Interferon-α titers were measured using a commercial enzyme-linked immunosorbent assay (ELISA), the Human IFN-α Platinium ELISA kit (eBioscience, USA) according to the manufacturer’s instructions. G6PDH activity assay was performed using Bertin Pharma’s kit (France, Cat. #D05010) according to manufacturer’s instructions. Nucleotides, organic acids, sugar phosphates and extracellular amino acids concentrations were assessed using an Agilent 1290 HPLC system (Agilent technologies, Quebec, Canada) as previously described by Ghorbaniaghdam et al. [33]. Ammonia extracellular concentrations were analyzed using an ammonia assay kit (K-AMIAR, Megazyme International Ireland Ltd).
2.6. Western Blot analysis
4 × 10⁵ cells were first washed with cold PBS containing 1 mM sodium orthovanadate and then
lysed in 100 µL of lysis buffer (50 mM HEPES of pH 7.4, 150 mM NaCl, 1% Thesit, 0.5% sodium deoxycholate, 1 mM sodium orthovanadate) for 20 min on ice [34]. Insoluble materials were removed by centrifugation at 10,000 g for 5 min. Samples were mixed 3:1 (v/v) in a buffer containing 25% glycerol, 0.011% bromophenol blue, 2% SDS, 5% β- mercaptoethanol and 62.5 mM Tris HCl, pH 6.8, and boiled for 5 min. Proteins were separated at 200 V for ~35 min using 10% acrylamide gels. Proteins were transferred to a PVDF membrane (Bio-Rad, USA) using Tris-glycine buffer for 1 h at 200 mA. The membrane was blocked with 5% skimmed milk in 10 mM Tris-HCl, pH 7.4, 150 mM NaCl, 0.1% Tween-20. Probing was done with a 1:1,000 diluted G6PD rabbit primary antibody (Cell Signaling, USA, Cat. #12263) incubated at 4°C overnight and specific binding was detected after rinse using a 1:1,000 diluted HRP-linked anti-rabbit IgG (Cell Signaling, Cat. #7074) incubated 1 h at room temperature. The visualization was performed using a chemiluminescence HRP detection kit (Immun-Star, Bio-Rad, USA).
3. Results and Discussion
3.1. Active G6PDH can be overexpressed in both HEH293 cell lines
Transfection condition was first tested at 24 h, but showed to be highly detrimental to cell growth and viability (data not shown). Both cell lines were thus transiently transfected at late exponential phase, in order to maximize the potential effect on the cell oxidative state of overexpressing G6PDH. Transfections were thus performed at 67 h, while the cells are still within exponential phase with viabilities above 95%.
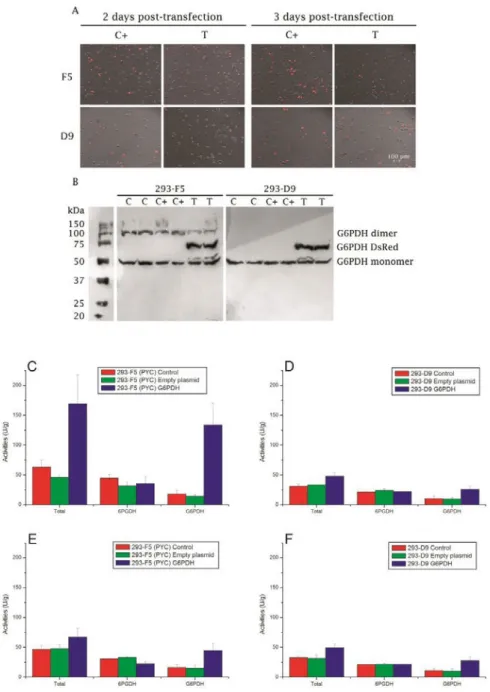
Figure 1. G6PDH overexpression in HEK-293 cells. (A) Fluorescence microscopy of transfected cells 48 h and 72 h post-transfection. “C+” stands for cells transfected with empty plasmid (max. excitation/emission at 557/592 nm) and “T” for cells transfected with fused DsRed-G6PDH (558/583 nm). (B) Western blot analysis of G6PDH expression. “C” stands for the control (non-transfected), “C+” for cells transfected with empty plasmid, and “T” for cells transfected with G6PDH. G6PDH, 6PGDH and total (G6PDH + 6PGDH) activities in: (C) PYC expressing (293-F5) at 48 h post-transfection and (D) at 72 h transfection, (E) in parental cells (293-D9) cells at 48 h post-transfection and (F) at 72 h post-post-transfection. Transfections were all performed at 67 h. Experiments were done in triplicates and error bars are standard error of the mean (SEM). U is defined as the amount of enzyme that will catalyze the conversion of 1 µmol of substrate per minute.
Both cell lines show fluorescence 48 h and 72 h post-transfection (Figure 1 A), in cells either transfected with empty plasmid or G6PDH. Plasmid integration was even confirmed 24 h post-transfection, with a slight fluorescence partly due to the slow maturation of the DsRed protein [35,36], and was maintained until the end of the culture (166 h). G6PDH expression was specifically assessed by western blot (Figure 1 B), with a clear confirmation of the fused G6PDH-DsRed protein at 75 kDa in all transfected batches, for both cell lines. Natural monomeric and dimeric G6PDH appear at 50 and 100 kDa respectively. Since G6PDH may be expressed without being active, its activity was quantified (Figure 1 C-F). Firstly, 48 h post-transfection, both F5 and D9 cells transfected with G6PDH exhibited an enhanced activity level of the enzyme compared to non-transfected cells (735 and 252% for the F5 and D9 clones, respectively). The differences between clones may be explained by the fact that they have not the same growth behavior and so are not at the same phase and state at that time of transfection; although the D9 cells were at stationary phase one day post-transfection while the F5 cells were still at late exponential phase, hence affecting plasmid uptake and transduction processes. 6PGDH activity was also assessed at the same time, and G6PDH overexpression did not appear to affect the activity of the second enzyme of the PPP in neither cell lines. Activities of the cells transfected with the empty plasmid were not significantly different to that of the control. Interestingly, G6PDH activity level remained higher than the control later in the culture, as measured 72 h post-transfection (280 and 248% for the F5 and D9 clones, respectively). The decrease of G6PDH activity in the F5 clone between 48 and 72 h post-transfection could be attributed to a clonal effect from the PYC-modified metabolism. The overall activities showed to decrease 72 h post-transfection, which is probably due to a reduced cell metabolism at the plateau phase. Interestingly, enzymes activities, even for the controls, are lower in the parental line than in the PYC cells, while it has been reported that the flux through PPP was reduced in the PYC cells, but in a 13C MFA study conducted using a different media formulation and semi- continuous cultures [4]. Indeed, in our study, activities are not measured at the same cell density nor with fresh media addition. However, enzyme activities are not necessarily representative of the fluxes, as it has already been reported that a 15-fold increase in G6PDH resulted in no significant flux improvement via PPP in E. coli [37]. Our results indicate that G6PDH was overexpressed and its activity significantly enhanced in the transfected cultures, with a large fraction of the cells transfected confirmed by the DsRed fluorescence, as already demonstrated by Gupte et al. [30] also in HEK 293 (clone T17) cells for the same plasmidic system.
3.2. G6PDH overexpression has no impact on both growth and nutrient consumption nor on interferon production
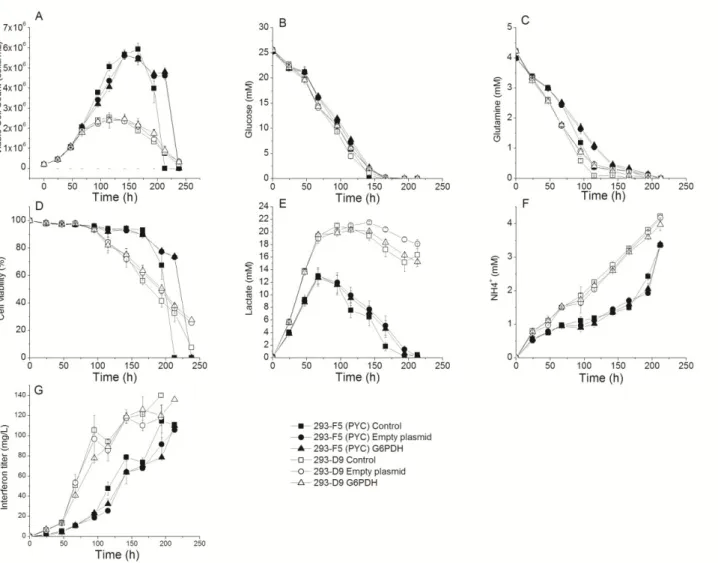
The parental and PYC clones were cultured in batch and transfected either with the empty plasmid or the plasmid coding for G6PDH at the end of exponential growth (F5 clone) and early plateau phase (D9 clone). Non-transfected cells of each clone served as a true control and cells transfected with the empty plasmid served as a control in regards of the transfection effect. No significant difference attributable to G6PDH overexpression or transfection was observed regarding maximal cell density or growth rate for the two clones (Figure 2).
Figure 2. Effect of G6PDH overexpression on HEK-293 cell behavior in shake flask culture. (A) Viable cell concentration, (B) glucose and (C) glutamine culture medium concentration, (D) cell viability, (E) lactate, (F) ammonia and (G) recombinant interferon titer concentration, during batch cultivation in shake flasks of parental (293-D9) (: Control, : Empty plasmid, : G6PDH) and PYC expressing (293-F5) (: Control,: Empty plasmid, : G6PDH) cells. Transfections were all performed at 67 h. Experiments were done in triplicates and error bars are standard error of the mean (SEM). However, a slight transfection effect with lower viable cell densities during the growth phase (67–145 h) and an extended cell viability (0% at 213 vs. 238 h for the PYC cells) can be observed for the cells transfected with the empty plasmid and the cells transfected with G6PDH, compared to the control. Glucose and glutamine uptake show slower rates, as well as for lactate to a lesser extent, following transfection (Figure 2). There was, therefore, no significant specific effect of G6PDH overexpression. The 293-F5 clone reached a maximum cell concentration of ~6 × 10⁶ cells/mL
compared to ~2.5 × 10⁶ cells/mL for the parental. These maximum cell densities are similar to those
reported by Vallée et al. [10] for the same clones. As reported previously [4], the cell density increase of the PYC clone compared to the parental one is due to a prolonged exponential phase with
growth rates of 0.036 and 0.035 h−1 for the PYC and the D9 clones respectively. Thereafter, cultures
of transfected cells lasted one day more than the control, but it is most likely due to nutrients depletion and not to G6PDH overexpression, since this phenomenon was also observed for cells transfected with empty plasmid. Apart from the slight differences mentioned above and attributed to a transfection effect, the two clones behaved similarly, as described previously [4,10]. The PYC cell line shows a more efficient metabolism in batch mode with a lower lactate production (13 vs 19 mM at 67 h for the F5 and D9 clones, respectively), although reaching higher maximum cell concentration, and a shift in lactate consumption at the mid-late exponential phase. Concomitant to a reduction of lactate production and of glutamine consumption for the F5 clone, less ammonia was produced (Figure 2), phenomena which favor cell growth [38].
Similarly to cell growth behavior, the maximal interferon titer was not significantly affected by the transfection process, although both clones transfected with empty plasmid or G6PDH exhibit a slower production rate (4.4 vs 3.7 and 8.2 vs 7.6 µg/106 cells/d, for the F5 and the D9, respectively)
(Figure 2). This result suggests that the synthesis of the fluorescent protein alone or of the fused G6PDH-DsRed might, together with the transfection conditions, be at the expense of growth and protein production. A slight decrease is observed at 115 h and 166 h for parental cells and PYC expressing cells respectively, i.e. culture times corresponding to the decrease of cell viability for both cell lines. Parental cells yielded a maximum interferon concentration of 140 mg/mL whereas the PYC clone reached 110 mg/mL. It is often reported in literature that high producing clones present a more efficient lactate metabolism [15,33,39]. Even if the PYC clone seems to be metabolically more efficient, this has not been translated into an improved production in interferon compared to the D9 clone, suggesting that the ameliorations gained in term of growth are detrimental to interferon production in batch mode.
3.3. PPP is highly regulated: G6PDH overexpression has no effective long-term effect on the cells metabolic behavior
Concomitant to the results on cell growth and interferon production, and apart for some epiphenomena, no significant effect due to G6PDH overexpression was observed at the metabolic level. It was expected that G6PDH overexpression would enhance NADPH production rate, and thus modifies the PPP dynamics such as for the trends of the NADPH-to-NADP+ratio. Comparing
average values one day post-transfection, transfected cells exhibit lower levels of NADPH and NADP+ (Figure 3), but the G6PDH transfected cells seem to compensate for the transfection effect,
Figure 3. Effect of G6PDH overexpression on HEK-293 cell energetic and redox status. (A) NADH-to-NAD+ ratio, (B) NADPH-to-NADP+ ratio, (C) ATP-to-ADP ratio, (D)
ATP-to- AMP ratio, and (E) UDPG, (F) AMP, (G) NADH, (H) NADP+, (I) NADPH, (J)
ADP, (K) CTP, (L) GTP, (M) ATP, (N) UTP and (O) NAD+ cell concentration profiles
during batch cultivation in shake flasks of parental (293-D9) (: Control, : Empty plasmid, : G6PDH) and PYC expressing (293-F5) (: Control,: Empty plasmid, : G6PDH) cells. Transfections were all performed at 67 h. Experiments were done in triplicates and error bars are standard error of the mean (SEM).
More interestingly, there is no significant effect of transfection on the NADPH-to-NADP+ ratio
with empty plasmid or G6PDH, and it stays interestingly constant for both cell lines and at a similar value, except for the transfected D9 cells with empty plasmid; although this difference is not significant when considering error bars. Templeton et al. [40] observed a drop of the NADPH-to-NADP+ ratio at peak flux through PPP in fed-batch culture of CHO cells, while no such drop was
observed in our work, even in the control cultures. The stability of the ratio indicates a strong robustness of the cells metabolism. The fact that 6PGDH activity is not affected by G6PDH overexpression, together with stable intracellular metabolites and nucleotides pools (Figure 3,4) are supporting this hypothesis. At first sight, it can be hypothesized that the overall NADPH production, including from other sources than G6PDH, is regulated and compensated. Henry and Durocher [4] reported that malic enzyme compensated a loss in NADPH production due to lesser fluxes to PPP in PYC cells. Indeed, Pollack et al. [41] showed that NAD kinase, producing NADP+ from NAD+, is an
efficient enzyme candidate to enhance NADPH pool, but it also provides only a moderate protection increase against oxidative stress. Re-reducing NADP+ into NADPH by the various dehydrogenases
study, overexpression of NADK did not affect mRNA levels of G6PDH, 6PGL or 6PGDH, so no increase in the activities of the overall reducers of NADP+ was observed, thus accounting that their activities are sufficient to reduce the excess of NADP+. Of interest, cells lacking NADK may only
show a slight increase of associated mRNA levels, and thus account for cell robustness. The hypothesis of refueling NADPH by re-reducing NADP+ is thus consistent with the constant ratio
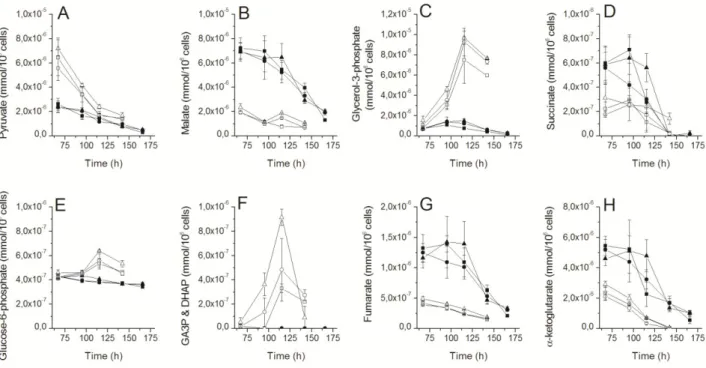
obtained in this study. The level of G6P, the entry point of PPP, seems slightly higher in both cell lines until 142 h when transfected with G6PDH (Figure 4). Oppositely to what could have been expected, G6PDH overexpression did not lead to a decreased pool of G6P. This suggests that the reaction is repressed even in the presence of large quantities of the active enzyme, as previously reported by Nicolas et al. [37]. D9 cells exhibit higher levels of G6P, glycerol-3-phosphate and GA3P & DHAP than the F5 cells, a result that can mostly be attributed to the pull effect toward the TCA cycle for PYC cells. The levels of GA3P & DHAP and glycerol-3-phosphate in the G6PDH transfected D9 cells are clearly higher (Figure 4), indicating an accumulation phenomenon, probably via PPP. Indeed, GA3P & DHAP are the point of return of PPP in the glycolysis.
Figure 4. Effect of G6PDH overexpression on HEK-293 cells central metabolism. (A) pyruvate, (B) malate, (C) glycerol-3-phosphate, (D) succinate, (E) glucose-6-phosphate, (F) GA3P & DHAP, (G) fumarate and (H) -ketoglutarate cell concentration profiles during batch cultivation in shake flasks of parental (293-D9) (: Control, : Empty plasmid, : G6PDH) and PYC expressing (293-F5) (: Control,: Empty plasmid, : G6PDH) cells. Transfections were all performed at 67 h. Experiments were done in triplicates and error bars are standard error of the mean (SEM).
3.4. The PYC gene expression has a strong effect on the cells energetic and redox states, but not the G6PDH
As shown earlier, G6PDH overexpression has no impact on the overall NADPH-to-NADP+ ratio,
and the same observation can be noted for the other energetic and redox compounds, apart from some epiphenomena attributed to transfection effect. One day post-transfection, ATP-to-ADP and ATP-to-AMP ratios increased in the transfected F5 cells, and NADH-to-NAD+ ratio decreased in
both cell lines, observations attributed to the lower levels of ADP and AMP in the F5 cells and lower NADH, NAD+ levels in the two cell lines (Figure 3). Surprisingly, the ATP-to-ADP, ATP-to-AMP
and NADH-to-NAD+ ratios are lower for the PYC clone than for the parental. The ATP-to-AMP
ratio is more sensitive to changes of the cell energetic state [42], and is thus suggesting an unfavorable energetic state in the PYC cells. Moreover, the cell concentrations in NAD+ and NADH
are also lower for the PYC clone compared to the parental. However, no elevation of the ATP pool was observed in the PYC cells, a behavior which has been reported for PYC expressing BHK cells; since high intracellular ATP level is normally interpreted as a higher energetic efficiency [43]. However, higher ADP levels in the F5 cells may be due to a higher ATP utilization rate. Lower energetic and redox ratios may indicate increased metabolic rates, or at least a higher and sustained energetic demand. A lower NADH-to-NAD+ ratio favors TCA cycle activity and the conversion of
lactate to pyruvate, and lower NAD+ in the PYC cells is consistent with its use in those reactions.
Indeed, lower concentration in electron carriers such as NADH can partly explain the lower interferon production level of the transfected PYC cells, since it has been reported by Chong et al. [44] for CHO cells that high producer cell lines exhibit higher levels of those molecules. Normally, the conversion of lactate to pyruvate and high flux rates through TCA cycle [4] should result in increased NADH levels in PYC cells, and even in increased NADPH via increased H+ gradients
through mitochondrial membrane [45]. An increased NADH-to-NAD+ ratio in PYC CHO cells was
observed by Wilkens and Gerdtzen [46], oppositely to the results reported in this work, showing that
increased NADH-to-NAD+ levels are consistent with low lactate synthesis. However, our results are
consistent with increased pyruvate recycling via malic enzyme as observed by Henry and Durocher [4], hence consuming NADH. Interestingly, redox ratio drops simultaneously to TCA intermediates concentration (Figure 3,4). Contrary to what is usually reported [45,47], NADH-to-NAD+ ratios are
higher than NADPH-to-NADP+ ratios in our study, maybe indicating that the overall NADPH
production is insufficient in both cell lines. The PYC cells also exhibit lower levels of glycerol-3-phosphate (Gly3P) and DHAP (Figure 4). Glycerol glycerol-3-phosphate shuttle (Gly3P, DHAP) main function is to re-oxidize cytosolic NADH and reduce FAD in the mitochondria, hence sustaining ATP production and NAD+ recycling. The low levels of Gly3P and DHAP in the F5 cell line indicate that
this shuttle is probably not efficient enough, thus explaining the lower levels of NAD+ and ATP. It
could be hypothesized that the prolonged exponential phase of the PYC cells requires a higher de novo synthesis of nucleotides [48]. Moreover, the importance of G6PDH in cell growth [22] as well as for providing R5P for nucleic acids synthesis [24] has been characterized, but no long term significant change was observed due to G6PDH in the nucleotides pools. F5 cells exhibit similar levels of CTP and UTP than in parental cells, but lower levels of GTP and higher levels of UDPG (Figure 3). It should be noted that G6PDH transfected D9 cells seem to compensate for the transfection effect in CTP and GTP at 115 h and even enhance UTP and UDPG at this time point (Figure 3), maybe due to an increased synthesis of precursors via PPP. Accumulation of GTP in D9
cells can be attributed to early cell growth arrest. Chong et al. [44] reported that high producers have more nucleotide-activated sugar precursors, such as UDPG, a precursor of N-glycans or glycolipids for plasmic membrane synthesis. UDPG high level in the PYC cells can thus be attributed to supporting cell growth and protein glycosylation processes.
3.5. TCA cycle activity is neither affected by G6PDH overexpression
None of the TCA metabolites assessed in this study were significantly affected by G6PDH overexpression, nor transfection (Figure 4). F5 (PYC) cells exhibit lower levels of pyruvate, glycerol-3-phosphate and GA3P & DHAP than the parental cells, accounting for the pull effect of the PYC toward TCA cycle. This is consistent with Luo et al. [49] where metabolites measured in the TCA and glycerol-3-phosphate were lower in CHO cells exhibiting a switch to lactate consumption. Pyruvate level decreases in both cell lines, but to a lesser extent in the D9 clone. Lactate consumption may fuel pyruvate levels in the PYC clone, and lactate production has already been linked to pyruvate accumulation in the cells [47]. Oppositely, D9 cells show lower levels of malate, succinate, fumarate and alpha-ketoglutarate. Interestingly, the levels of these metabolites drop in the F5 cells after 95 h, when entering late exponential growth phase, accordingly with the beginning of lactate consumption, suggesting a metabolic switch through TCA cycle. However, it seems that the PYC cells show lower concentrations in those molecules, as well as in pyruvate at the end of the culture. Extracellular amino acids concentrations behavior agrees with observations on central carbon metabolites. Concentrations of threonine, isoleucine, leucine, methionine, valine, tyrosine, serine, arginine, lysine and phenylalanine exhibit very similar trends (Figure 5) with decreasing levels and a plateau beginning at 115 h or 145 h.
The two cell lines show similar behavior except that PYC cells consume less amino acids per 106 cells with the exception of asparagine, lysine and histidine, and reach lower levels than those observed for the parental cells. They also produce less proline and more alanine, glycine and glutamate. However, Henry and Durocher [4] reported increased utilization of threonine, arginine, valine, isoleucine, leucine, lysine, phenylalanine, as well as lower glutamate and asparagine production by the PYC cells, while reaching a lower cell density cultured in a different medium formulation. The PYC cells showed depletion of serine and arginine earlier than for D9 cells, before entering the stationary phase. This result suggests these amino acids are essential growth-limiting nutrients. Asparagine is consumed in both cell lines, but at a higher extent by the PYC cell line. High asparagine consumption has been likely linked to replenishment of TCA cycle intermediates [50,51]. Indeed, most of these amino acids are precursors or products closely issued from the TCA cycle. It is also expected that with an extended exponential phase, PYC cells consume nutrients for a longer time to support prolonged cell growth. Proline is clearly produced during the culture of both cell lines, but it is more accumulated in the extracellular media of D9 cells (Figure 5). It can be synthesized from glutamate, and the higher level of proline for the D9 cells are concomitant with the lower glutamate level. Alanine level is more fluctuating but globally reaches higher levels in the PYC cells at the end of the culture. Alanine can be synthetized from pyruvate and other amino acids such as isoleucine, leucine and valine. Therefore, alanine concentration fluctuation can be related to an equilibrium with pyruvate. Aspartic acid, a precursor of pyrimidines used in nucleotides synthesis, is used equally in the two cells lines most probably to feed nucleotides synthesis and cell growth. Histidine level is quite constant over the whole culture of D9 cells, while it decreases in the PYC
cells, reaching a lower level at the end of the culture, maybe to supply alpha-ketoglutarate to the TCA.
Figure 5. Effect of G6PDH overexpression on HEK-293 cells amino acids metabolism. (A) threonine, (B) isoleucine, (C) leucine, (D) methionine, (E) tyrosine, (F) valinine, (G) proline, (H) alanine, (I) glycine, (J) serine, (K) glutamate, (L) asparagine, (M) aspartate, (N) arginine, (O) lysine, (P) histidine (Q) phenylalanine culture medium concentration profiles, and (R) global amino acids consumption/production during batch cultivation in shake flasks of parental (293-D9) (: Control, : Empty plasmid, : G6PDH) and PYC expressing (293-F5) (: Control,: Empty plasmid, : G6PDH) cells. Transfections were all performed at 67 h. Experiments were done in triplicates and error bars are standard error of the mean (SEM).
As seen previously for glucose and glutamine, a slight transfection effect can be observed on amino acids uptake, but can hardly be attributed to G6PDH overexpression. Thus, G6PDH did not impact on metabolites concentration in none of the cell lines, but given the modified metabolism of the PYC cell line, the two cell lines exhibit highly different metabolic profiles. The present results on cell management of external nutrients and metabolites globally agree with that of a previous 13C MFA study performed with the same HEK293 D9 and PYC cell lines [4]. However, our G6PDH activity level measurements clearly support the hypothesis of a tight regulation of the PPP, since G6PDH activity level differences among cell lines in this work do not agree with the differences reported for the PPP flux rates determined in a 13C MFA study [4]. Similar comparison based on a 13C MFA study can be drawn for CHO cells [13].
4. Conclusion
In this work, we have transiently transfected two filiated HEK 293 clones with G6PDH in an attempt to bypass the highly regulated glycolysis and increase NADPH and precursors production for both protein production and cell growth. The PYC cell line was expected to amplify and benefit from the effect of G6PDH overexpression because of the “pull” effect of PYC from glycolysis downstream toward the TCA cycle. Some epiphenomena can be observed, mostly one day post-transfection, where levels of metabolites for the transfected cells do not follow the same trends as for the control. The results show that both cell lines, parental and the F5 clone, are highly robust towards transient G6PDH overexpression, showing little change in terms of protein production, cell growth and metabolites concentration. In complement, similar transient experiments have been performed on IgG producing CHO cells in 6-well plates and shake-flasks (not shown data). However, no effect was observed on antibody titer nor cell growth, even for overexpressed and over-activated G6PDH, similarly as reported in the HEK 293 cell lines studied in this work. This also indicates that pentose phosphate pathway regulation should be reviewed and further implemented. This work thus exposes global metabolic signatures of the two cell lines, submitted or not to transient G6PDH overexpression, thus providing novel data on cell energetics, redox states and metabolites concentration. However, results may differ with cell lines stably overexpressing G6PDH.
Acknowledgement
The authors would like to thank the Natural Sciences and Engineering Research Council of Canada (NSERC) and the Monoclonal Antibody Network (MabNet) for their funding and their support for this work, as well as Nicole Pham and Jean-Sébastien Lord for their technical help. Conflict of Interest
The authors declare no competing financial interests. Contribution
E.A. designed and conducted the experiments, analyzed the data and wrote the paper. Y.D. provided the HEK cell lines and S.G. provided the plasmid pDsRed-N1. J.C. performed the HPLC
analysis. M.J. and I.H. conceived the project, and M.J. participated in experimental plan design, data analysis and paper writing. All authors reviewed the manuscript.
References
1. Kamen A, Henry O (2004) Development and optimization of an adenovirus production process. J Gene Med 6: S184–S192.
2. Durocher Y, Pham PL, St-Laurent G, et al. (2007) Scalable serum-free production of recombinant adeno-associated virus type 2 by transfection of 293 suspension cells. J Virol Methods 144: 32–40.
3. Baldi L, Muller N, Picasso S, et al. (2005) Transient gene expression in suspension HEK-293 cells: application to large-scale protein production. Biotechnol Progr 21: 148–153.
4. Henry O, Durocher Y (2011) Enhanced glycoprotein production in HEK-293 cells expressing pyruvate carboxylase. Metab Eng 13: 499–507.
5. Elias CB, Carpentier E, Durocher Y, et al. (2003) Improving glucose and glutamine metabolism of human HEK 293 and Trichoplusia ni insect cells engineered to express a cytosolic pyruvate carboxylase enzyme. Biotechnol Progr 19: 90–97.
6. Loignon M, Perret S, Kelly J, et al. (2008) Stable high volumetric production of glycosylated human recombinant IFNalpha2b in HEK293 cells. BMC Biotechnol 8: 65.
7. Klein T, Niklas J, Heinzle E (2015) Engineering the supply chain for protein production/secretion in yeasts and mammalian cells. J Ind Microbiol Biot 42: 453–464.
8. Dietmair S, Nielsen LK, Timmins NE (2011) Engineering a mammalian super producer. J Chem Tech Biot 86: 905–914.
9. Costa AR, Rodrigues ME, Henriques M, et al. (2010) Guidelines to cell engineering for monoclonal antibody production. Eur J Pharm Biopharm 74: 127–138.
10. Vallée C, Durocher Y, Henry O (2014) Exploiting the metabolism of PYC expressing HEK293 cells in fed-bach cultures. J Biotechnol 169: 63–70.
11. Seth G, Hossler P, Yee JC, et al. (2006) Engineering cells for cell culture bioprocessing--physiological fundamentals. Adv Biochem Eng Biotechnol 101: 119–164.
12. Templeton N, Dean J, Reddy P, et al. (2013) Peak antibody production is associated with increased oxidative metabolism in an industrially relevant fed-batch CHO cell culture. Biotechnol Bioeng 110: 2013–2024.
13. Ahn WS, Antoniewicz MR (2011) Metabolic flux analysis of CHO cells at growth and non-growth phases using isotopic tracers and mass spectrometry. Metab Eng 12: 598–609.
14. Sengupta N, Rose ST, Morgan JA (2011) Metabolic Flux Analysis of CHO Cell Metabolism in the Late Non-Growth Phase. Biotechnol Bioeng 108: 82–92.
15. Dean J, Reddy P (2013) Metabolic analysis of antibody producing CHO cells in fed-batch production. Biotechnol Bioeng 110: 1735–1747.
16. Sheikholeslami Z, Jolicoeur M, Henry O (2013) The impact of the timing of induction on the metabolism and productivity of CHO cells in culture. Biochem Eng J 79: 162–171.
17. Fang H, Xie X, Xu Q, et al. (2013) Enhancement of cytidine production by coexpression of gnd, zwf, and prs genes in recombinant Escherichia coli CYT15 Biotechnol Lett 35: 245–251.
18. Shi F, Li K, Huan X, et al. (2013) Expression of NAD(H) kinase and glucose-6- phosphate dehydrogenase improve NADPH supply and L-isoleucine biosynthesis in corynebacterium
glutamicum ssp. lactofermentum. Appl Microbiol Biot 171: 504–521.
19. Flores S, Anda-Herrera RD, Gosset G, et al. (2004) Growth-rate recovery of Escherichia coli cultures carrying a multicopy plasmid, by engineering of the pentose- phosphate pathway. Biotechnol Bioeng 87: 485–494.
20. Kwon D-H, Kim MD, Lee TH, et al. (2006) Elevation of glucose 6-phosphate dehydrogenase activity increases xylitol production in recombinant Saccharomyces cerevisiae. J Mol Cat B: Enz 43: 86–89.
21. Wang XT, Engel PC (2009) An optimised system for refolding of human glucose 6-phosphate dehydrogenase. BMC Biotechnol 9–19.
22. Tian W-N, Braunstein LD, Pang J, et al. (1998) Importance of glucose-6-phosphate dehydrogenase activity for cell growth. J Biol Chem 273: 10609–10617.
23. Duan YX, Chen T, Chen X, et al. (2010) Overexpression of glucose-6-phosphate dehydrogenase enhances riboflavin production in Bacillus subtilis. Appl Microbiol Biot 85: 1907–1914.
24. Stanton RC (2012) Glucose-6-phosphate dehydrogenase, NADPH, and cell survival. IUBMB Life 64: 363–369.
25. Pandolfi PP, Sonati F, Rivi R, et al. (1995) Targeted disruption of the housekeeping gene encoding glucose 6-phosphate dehydrogenase oxidative stress. EMBO J 14: 5209–5215.
26. Zhang Z, Yang Z, Zhu B, et al. (2012) Increasing glucose 6-phosphate dehydrogenase activity restores redox balance in vascular endothelial cells exposed to high glucose. PLoS ONE 7: e49128.
27. Ursini MV, Parrella A, Rosa G, et al. (1997) Enhanced expression of glucose-6-phosphate dehydrogenase in human cells sustaining oxidative stress. Biochem J 323: 801–806.
28. Tian WN, Braunstein LD, Apse K, et al. (1999) Importance of glucose-6-phosphate dehydrogenase activity in cell death. Am J Physiol 276: C1121–1131.
29. Ghorbaniaghdam A, Henry O, Jolicoeur M (2014) An in-silico study of the regulation of CHO cells glycolysis. J Theor Biol 357: 112–122.
30. Gupte RS, Ata H, Rawat D, et al. (2011) Glucose-6-phosphate dehydrogenase is a regulator of vascular smooth muscle contraction. Antioxydants Red Signal 14: 543–558.
31. Sacchetti A, Subramaniam V, Jovin TM, et al. (2002) Oligomerization of DsRed is required for the generation of a functional red fluorescent chromophore. FEBS Lett 525: 13–19.
32. Tom R, Bisson L, Durocher Y (2007) Expression Systems: Methods Express, Scion Publishing Ltd.
33. Ghorbaniaghdam A, Chen J, Henry O, et al. (2014) Analyzing clonal variation of monoclonal antibody-producing CHO cell lines using an in silico metabolomic platform. PLoS ONE 9.
34. Boucher C, St-Laurent G, Loignon M, et al. (2008) The bioactivity and receptor affinity of recombinant tagged EGF designed for tissue engineering applications is defined by the nature and position of the tags. Tissue Eng Part A 14: 2069–2077.
35. Cotlet M, Hofkens J, Habuchi S, et al. (2001) Identification of different emitting species in the red fluorescent protein DsRed by means of ensemble and single-molecule spectroscopy. Proc Natl Acad Sci USA 98: 14398–14403.
36. Baird GS, Zacharias DA, Tsien RY (2000) Biochemistry, mutagenesis, and oligomerization of DsRed, a red fluorescent protein from coral. Proc Natl Acad Sci USA 97: 11984–11989.
37. Nicolas C, Kiefer P, Letisse F, et al. (2007) Response of the central metabolism of Escherichia coli to modified expression of the gene encoding the glucose-6-phosphate dehydrogenase. FEBS
Lett 581: 3771–3776.
38. Cruz HJ, Freitas CM, Alves PM, et al. (2000) Effect of ammonia and lactate on growth, metabolism, and productivity of BHK cells. Enzyme Microb Tech 27: 3–52.
39. Dietmair S, Hodson MP, Quek LE, et al. (2012) A Multi- Omics Analysis of Recombinant Protein Production in Hek293 Cells. PLoS ONE 7: 8, e43394.
40. Templeton N, Dean J, Reddy P, et al. (2013) Peak Antibody Production is Associated With Increased Oxidative Metabolism in an Industrially Relevant Fed- Batch CHO Cell Culture. Biotechnol Bioeng 110: 2013–2024.
41. Pollak N, Niere M, Ziegler M (2007) NAD kinase levels control the NADPH concentration in human cells. J Biol Chem 282: 33562–33571.
42. Hardie DG (2004) The AMP-activated protein kinase pathway - new players upstream and downstream. J Cell Sci 117: 5479–5487.
43. Irani N, Wirth M, Heuvel JVD, et al. (1999) Improvement of the primary metabolism of cell cultures by introducing a new cytoplasmic pyruvate carboxylase reaction. Biotechnol Bioeng 66: 238–246.
44. Chong WPK, Thng SH, Hiu AP, et al. (2012) LC-MS-Based Metabolic Characterization of High Monoclonal Antibody-Producing Chinese Hamster Ovary Cells. Biotechnol Bioeng 109: 3103– 3111.
45. Ying W (2008) NAD+/NADH and NADP+/NADPH in cellular functions and cell death: regulation and biological consequences. Antioxydants Redox Signal 10: 179–206.
46. Wilkens CA, Gerdtzen ZP (2015) Comparative Metabolic Analysis of CHO Cell Clones Obtained through Cell Engineering, for IgG Productivity, Growth and Cell Longevity. PLoS ONE 10: e0119053.
47. Wilkens CA, Altamirano C, Gerdtzen ZP (2011) Comparative metabolic analysis of lactate for CHO cells in glucose and galactose. Biotechnol Bioproc Eng 16: 714–724.
48. Lane AN, Fan TW-M (2015) Regulation of mammalian nucleotide metabolism and biosynthesis. Nucleic Acids Res 43: 2466–2485.
49. Luo J, Vijayasankaran N, Autsen J, et al. (2012) Comparative metabolite analysis to understand lactate metabolism shift in Chinese hamster ovary cell culture process. Biotechnol Bioeng 109: 146–156.
50. Sellick CA, Croxford AS, Maqsood AR, et al. (2011) Metabolite profiling of Recombinant CHO Cells: Designing Tailored Feeding Regimes That Enhance Recombinant Antibody Production. Biotechnol Bioeng 108: 3025–3031.
51. Carinhas N, Duarte TM, Barreiro LC, et al. (2013) Metabolic Signatures of GS-CHO Cell Clones Associated With Butyrate Treatment and Culture Phase Transition. Biotechnol Bioeng 110: 3244–3257.
© 2016 Mario Jolicoeur, et al., licensee AIMS Press. This is an open access article distributed under the terms of the Creative Commons Attribution License (http://creativecommons.org/licenses/by/4.0)