HAL Id: hal-01745299
https://hal.archives-ouvertes.fr/hal-01745299
Submitted on 28 Mar 2018
HAL is a multi-disciplinary open access
archive for the deposit and dissemination of
sci-entific research documents, whether they are
pub-lished or not. The documents may come from
teaching and research institutions in France or
abroad, or from public or private research centers.
L’archive ouverte pluridisciplinaire HAL, est
destinée au dépôt et à la diffusion de documents
scientifiques de niveau recherche, publiés ou non,
émanant des établissements d’enseignement et de
recherche français ou étrangers, des laboratoires
publics ou privés.
Local strain redistribution in a coarse-grained
nickel-based superalloy subjected to shot-peening,
fatigue or thermal exposure investigated using
synchrotron X-ray Laue microdiffraction
G. Altinkurt, M. Fèvre, G. Geandier, M. Dehmas, O. Robach, J.S. Micha
To cite this version:
G. Altinkurt, M. Fèvre, G. Geandier, M. Dehmas, O. Robach, et al.. Local strain redistribution
in a coarse-grained nickel-based superalloy subjected to shot-peening, fatigue or thermal exposure
investigated using synchrotron X-ray Laue microdiffraction. Journal of Materials Science, Springer
Verlag, 2018, 53, pp.8567-8589. �10.1007/s10853-018-2144-4�. �hal-01745299�
(will be inserted by the editor)
Local Strain Redistribution in a Coarse-Grained Nickel
Based Superalloy Subjected to Shot-peening, Fatigue or
Thermal Exposure Investigated Using Synchrotron X-ray Laue
Microdiffraction
G. Altinkurt · M. F`evre · G. Geandier · M. Dehmas · O. Robach · J.-S. Micha
the date of receipt and acceptance should be inserted later
Abstract The Laue microdiffraction technique was used to investigate the strain field caused by the shot-peening operation and its redistribution after thermal hold or fatigue in a model nickel-based superalloy with an av-erage grain size of 40 mm. Micrometer and millimeter size mappings showed that the plastic deformation in-troduced by shot-peening in the whole sample partially relaxes after a thermal exposure at 450◦C and was fully redistributed by the fatigue of the material, except in the hardened layer close to the sample edge. Diffraction patterns permitted to measure separately the strains re-lated to the average alloy (γ+γ’) and to the γ’ phase. No difference was observed between the two deviatoric strain fields. Even if there are small stresses in the inner part of the samples, the sensitivity of the Laue microd-iffraction method was large enough to quantitatively characterize the crystal misorientations and the devia-toric strain redistributions. Useful data were provided not only at the grain scale but also at the mesoscopic scale, thus bridging the gap between the sin2ψ and Or-G. Altinkurt · M. F`evre
Laboratoire d’ ´Etude des Microstructures, UMR 104 CNRS-ONERA, 92322 Chˆatillon, France
G. Altinkurt · G. Geandier
IJL, UMR 7189 CNRS-Universit´e de Lorraine, Nancy, France M. Dehmas
CIRIMAT, UMR 5085 CNRS-UPS-INPT-ENSIACET, 31000, Toulouse, France
O. Robach · J.-S. Micha
Universit´e Grenoble Alpes, 38000, Grenoble, France O. Robach · J.-S. Micha
CEA-INAC-MEM, 17 rue des Martyrs, 38000, Grenoble, France
J.-S. Micha
CNRS, 17 rue des Martyrs, 38000, Grenoble, France
tner’s methods used to determine residual stresses re-spectively in fine and single grain microstructures. The obtained results are also of first interest for a quan-titative comparison with HR-EBSD measurements in the scanning electron microscope. Energy coupled mea-surements with an energy point detector were also per-formed to determine the full elastic strain tensors as-sociated with the γ and γ’ phases. We demonstrated that, for Ni based superalloys, the accuracy on strains and stresses are respectively of the order of 1×10⁻³and 250 MPa for the diagonal components of tensors. The measurements suffered from the 150 eV resolution of the detector which made it difficult to the separate the energies of the γ and γ’ phases. Owing to large crystal misorientations, the microdiffraction technique was not able to determine elastic strains and hardening in the highly deformed layer, where a large amount of plastic strain and a number of defects were accumulated. Some improvements are proposed to overcome these difficul-ties.
Keywords X-ray Laue microdiffraction · coarse-grained nickel-based superalloy · shot-peening · elastic strain field · strain redistribution
1 Introduction
Knowledge of the fatigue behavior of aeronautical high pressure turbine (HPT) disks is crucial to avoid bursts and uncontained engine failures. The low-cycle fatigue life of such components made of polycrystalline nickel-based superalloys is primarily influenced by the ampli-tude of applied loads and by the alloy microstructure (e.g., chemical composition, grain size, volume fraction of phases) [1]. The surface roughness and residual stresses inherent to the manufacturing process or imposed by
the surface treatment also affect the component life-time (e.g., shot- and laser-peening, deep rolling). Ow-ing to the complex thermal and mechanical repeated cyclic loading conditions during the engine service, the initial stress field may relax, be redistributed or evolve, particularly at high temperature (see [2] and references therein). Nonlinear elasto–viscoplastic models coupled to creep and a fatigue damage model [3] enable the identification of fatigue critical zones and crack initi-ation time, depending on the thermal and mechanical history of the disk [4]. The improvement of such lifetime analysis is nowadays realized through the development of methods that take into account residual stresses and can predict their static and cyclic relaxation [5].
At a macroscopic scale, the relaxation or the redis-tribution of stresses induced by shot-peening was in-vestigated in depth at different temperatures in the In-conel, Astroloy and Udimet superalloys after isother-mal treatments or fatigue loadings [6, 7, 8, 9]. The measurements were performed using the sin2ψ method and electrochemical polishing for material removal. The authors have shown that in the surface layer affected by the shot-peening operation, some significant frac-tion of the initial residual stresses relaxes in the first hour of isothermal holding [9] or in the first cycle of a fatigue loading [8]. Stresses are usually obtained with millimeter-sized incoming beams from the diffraction of several thousand grains by the crystal lattice planes cor-responding to fundamental reflections. Due to the large amount of plastic deformation and the small lattice mis-match between the two phases, the results are related to the average alloy (γ-matrix and γ’-precipitates) ac-cordingly. Although measurements with high-resolution spectrometers at the laboratory or in large facilities have been performed to separate the γ and the γ’ con-tributions for determining lattice misfits or microstrains in polycrystals [10, 11, 12, 13], such an analysis has not been reported for residual stresses arising from shot-peening. Numerically, some models have been devel-oped to predict stress relaxations in Astroloy and IN100 nickel-based superalloys under thermal and thermome-chanical solicitations with rather good agreement with experimental data [6, 14].
At a lower scale, the characterization and modeling of crack nucleation and growth in powder metallurgy alloys are also deeply investigated to understand the physical mechanisms responsible for the damage of ma-terials in relation to the microstructure (e.g., grain size distribution and crystal defects). However, the effects of shot-peening and related strain redistribution after isothermal treatment or fatigue are poorly documented [15, 16, 17]. Child et al. [15] demonstrated that the grain orientation spread (GOS) calculated from the
orienta-tion measurements by electron backscattered diffrac-tion (EBSD) can be used to understand the work hard-ening induced by shot-pehard-ening. However, Foss et al. [16] have observed that the depth of work hardening determined with an EBSD analysis was half of the one measured using microhardness tests or X-ray diffraction peak widths. Dislocation structures due to shot-peening were observed by transmission electron microscopy af-ter heat treatment [18] or fatigue loading [17] in or-der to investigate the effect of temperature, time and loading conditions on their annihilation. The main rel-evant point was that although the residual compressive stresses are largely relieved during the first fatigue cy-cle, a high dislocation density is retained close to the sample surface, even after 3×10⁶ cycles at 700◦C, and
the effectiveness of shot-peening persists. Numerically, Musinski et al. [19] have used the eigenstrain formal-ism to introduce residual stresses associated with shot-peening in a crystal plasticity model and have pre-dicted stress relaxations in IN100 after a single load-ing/unloading sequence. Owing to the lack of exper-imental data at the grain scale, the comparison with the sin2ψ measurements involved numerical averages over grains and the origin of discrepancies were not easy to localize. To improve these models, high-angular-resolution electron backscatter diffraction (HR-EBSD) in a laboratory or X-ray microdiffraction experiments in a synchrotron can measure residual elastic strains in-side the grains and geometrically necessary dislocation (GND) densities [20]. At this scale, total strains can be determined using the recently developed FIB-DIC ring core method which combines FIB milling and dig-ital image correlation (DIC) [21, 22, 23]. The method was applied to determine residual stresses arising from shot- peening operation at different locations in alu-minum notched specimens [24] and in a nickel-based compressor blade [23].
The previous review shows that in polycrystalline superalloys, quantitative data about the strain field aris-ing from the shot-peenaris-ing operation and its redistribu-tion under thermal and mechanical condiredistribu-tions are not available at the grain scale. The characterization of mi-crostrains related to the γ matrix and the γ’ phase after pre-stress treatments is also missing. Such information would (i) provide a better understanding of the relation-ship between the alloy microstructure and damage re-sistance and (ii) facilitate the development more physi-cally justified models (e.g., crystal plasticity- or disloca-tion dynamics-based models). Stress measurements at the millimeter scale are also needed by continuum me-chanics models taking into account the specific geom-etry of the mechanical components and surface treat-ments. The aim of this study is to address these issues
using X-ray microdiffraction measurements (mXRD) on samples that were subjected to shot-peening, isother-mal holding and fatigue. Measurements are performed in a N18 alloy where the 10mm initial average grain size is modified to 40mm. Increasing the grain size (GS) is a way to improve the mechanical properties of HPT disks at high temperature (creep or crack propagation resis-tance). The determination of residual stresses in coarse-grained microstructures (30 mm<GS<500 mm) using diffraction-based techniques is challenging because of the limitations of the most common measurement tech-niques (sin2ψ [25] and Ortner’s [26] methods). The sin2ψ method can be employed in such microstructures if a sufficient number of grains diffract. This can be performed using high-energy X-rays or neutrons exper-iments or by oscillating the sample when beams with a smaller penetration depth into the material are used. Then, measured quantities correspond to averages in mm3 or cm3 gauge volumes. The Ortner’s method
em-ploys a monochromatic beam and requires measuring about 20 Bragg angles arising from the same crystal-lite [27, 28]. The method is not adapted to grain sizes lower than 100mm due to (i) the uncertainties caused by the movements of the goniometer and (ii) the amount of time which would be required to investigate many grains of a polycrystal. ThemXRD method uses a sub-micrometric beam size and a polychromatic beam. This enables to record, without any motion of the diffrac-tometer and in a single shot, the many diffraction spots which are necessary to determine elastic strains with a good accuracy. For coarse-grained microstructures, the grain size is thus no longer an issue. This work aims to improve the characterization and the understanding of stress relaxations in high temperature alloys for aero engine applications and to assess the ability of the Laue microdiffraction technique to quantify residual stresses in coarse-grained microstructures.
The article is organized as follows. The samples and experimental detail are presented in section 2. The devi-atoric strain fields obtained for the reference, the shot-peened, the heat treated and the fatigued mechanical states are analyzed in sections 3.1 to 3.4. Full strain measurements are described in section 3.5. Finally, a discussion highlighting the redistribution of residual stresses and the crystal misorientations after the thermal and the mechanical loadings is provided in section 4.
2 Material and method
2.1 Material preparation and samples
Cylindrical specimens were removed using electro-discharge machining in a sector of high pressure turbine disk
Table 1 Chemical composition (in weight %) of the N18 nickel-based superalloy.
Ni Co Cr Mo Al Ti Hf Zr B C bal. 15.5 11.4 6.4 4.5 4.5 0.5 0.03 0.02 0.01
made of the N18 nickel-based superalloy produced with a powder metallurgy route at Safran Aircraft Engines (see composition in Tab. 1). The heat treatment was identical to that reported in Ref. [29]. Optical microscopy observations revealed that the as-received microstruc-ture was mainly characterized by a 10mm average grain size and 3 populations of γ’ precipitates (L12 simple
cubic structure) embedded into the γ matrix (A1 face centered cubic structure). To simplify the analysis of the diffracted intensities associated with the γ’ phase, a coarse-grained microstructure with a single popula-tion of intragranular γ’ precipitates was obtained after a supersolvus solution treatment of 4 h at 1205◦C fol-lowed by an air quench and an ageing treatment of 1 h at 900◦C followed by an air quench. The average grain size determined by EBSD on a 6 mm × 6 mm area using a 3 mm step size was 40 mm with a distribution rang-ing from 5mm to 200 mm. The average precipitate size was 200 nm with a distribution between 40 nm and 400 nm. The volume fraction of the γ’ precipitates measured using a Rietveld analysis was 44%. Figure 1 represents an example of the γ grain and γ’ precipitate structure of the N18 alloy obtained in a SEM by EBSD analysis and secondary electron imaging. It is worth mentioning that some abnormal grain growth may take place dur-ing the solution treatment of the samples. Therefore, some grains can exhibit sizes larger than 200mm in the investigated microstructures.
Fig. 1 Observation of the coarse-grained microstructure in the N18 superalloy. (a): EBSD map revealing γ grains (ran-dom colors) with an average size of 40mm. (b): Secondary electron image showing γ’ precipitates (dark gray) with an average size of 200 nm embedded in the γ matrix (light gray).
In the first instance, five cylindrical specimens were machined for fatigue testing. The gauge length was 14 mm, the gauge diameter was 6.2 mm and the radius of the transition to the M11 screw threads was 20 mm. A specimen was used as reference sample and the oth-ers were subjected to shot-peening, isothermal holding and/or fatigue conditions as summarized in Tab. 2. Ul-trasonic shot-peening (USP) was realized on the cir-cumference of the cylindrical specimens (gauge section and transitions to the screw thread) with 3 mm diam-eter 100Cr6 steel shots for 18 min. These conditions were chosen to have a coverage close to 100% and to introduce strain fields with characteristic wavelengths larger than the grain size. Low cycle fatigue (LCF) tests were performed at 450◦C with a cyclic frequency of 1 Hz and an imposed axial total strain varying in the range of 0% to 1%. These parameters correspond to a regime where plasticity is mainly accumulated dur-ing the first loaddur-ing cycle. A small amount of plastic deformation is further accumulated at each cycle (see detail in appendix. A). As shown by John et al. [9] in the IN100 superalloy, the residual stresses caused by the shot-peening operation may be fully relaxed at the failure of the specimen. In the absence of such data for the N18 alloy, the LCF tests were interrupted after 300 cycles (i.e., 1 h 40 min). This value corresponds to approximately 25% of the fatigue lifetime of an un-peened specimen [4]. After the thermal and mechanical treatments, the test sections were cut to obtain cylin-ders with 10 mm height (see Fig. 2). Cross sections were then mechanically and chemically polished to re-move the stresses induced by the machining operation. For this purpose, SiC grinding papers of Grades 1000 to 4000 were successively employed. Then, a polishing was realized with a 0.25 mm diamond paste. A 15 mm thick layer was finally removed electrochemically with a methanol solution containing 17% of sulfuric acid. The Laue microdiffraction technique was then used to map the strain fields and the crystalline misorientations on one of the two cross sections. mXRD measurements were performed on a reference sample which has been polished as described above and on a reference sample which has been polished with the grinding papers only. The comparison of the deviatoric elastic strain maps (2.5 mm × 1 mm) recorded with a 50 mm step size did not show any difference attributable to the sam-ple surface preparation. However, full stress relaxations due to polishing may not be excluded especially at the grain boundaries. This effect was not investigated in the present work.
Table 2 Summary of the different heat and mechanical treatments applied to the fatigue test specimen and the cor-responding sample labels used in the text. USP stands for ultrasonic shot-peening and LCF for low-cycle fatigue.
Label Mechanical and/or heat treatments S1 None
S2 USP at room temperature
S3 USP+ hold at 450◦C during 1 h 40 min S4 USP+LCF at 450◦C during 1 h 40 min S5 LCF at 450◦C during 1 h 40 min
2.2 X-ray Laue microdiffraction
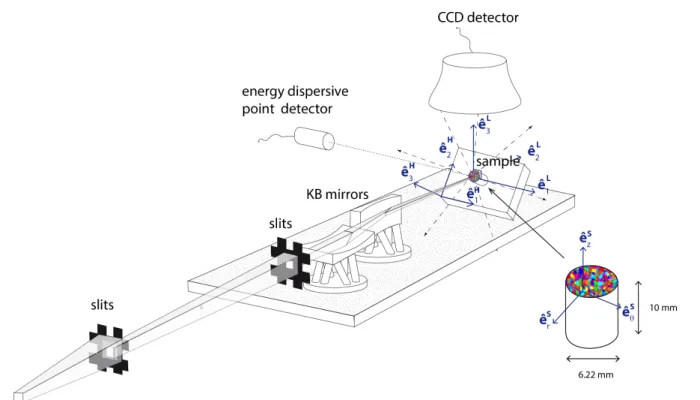
mXRD measurements were performed in the BM32 French CRG-IF beamline at the ESRF [30]. The incoming 5-22 keV polychromatic beam was focused with Kirkpatrick– Baez mirrors to have a 0.35 × 0.6mm2size on the
sam-ple surface, which was tilted by 40◦ with respect to the x-ray beam (Fig. 2). The absorption length of the beam into the material was in a 5-15mm range, depend-ing upon the photon energy and the angle of diffracted beams with respect to the sample surface. The diffrac-tion patterns were collected with a 2048 × 2048 pixels MAR165 circular CCD detector located 70 mm above the sample. Owing to the grain and beam sizes, Laue patterns are composed of diffraction spots originating from one or a few grains. During each acquisition, the incoming beam, the sample and the detector were in fixed positions. The mapping of the sample surface was realized with a motorized xyz linear translation stage. To measure the energy of specific Laue spots, a fluores-cence spectrum was collected using a silicon drift Ketek Vitus H7 detector mounted upon an yz linear transla-tion stage on the sample side [31].
The experimental geometry calibrations and the diffrac-tion pattern analyses were performed using the Laue-Tools software developed by the BM32 beamline staff of the ESRF [32]. Given a crystal structure, the (hkl) Miller indices of Laue spots arising from the same grain were obtained by matching the experimental pattern with simulated ones (Fig. 3b). The indexing process considers the spots with the highest intensity first. This means that indexed grains are not necessarily at the sample surface but can be deeper into the material (in the 5-15mm range). The grain size distribution of Fig. 1 revealed that about 10% of grains were in the 5-15 mm interval. If several grains are indexed in the depth probed by the x-ray beam, the information about the depth of these grains is not known although the accu-racy of the measured strains are approximatively 2 × 10⁻⁴. To know which grain is at the sample surface,
the grain orientation obtained by the Laue technique can be compared to the one obtained using EBSD.
Al-Fig. 2 Schematic of the diffractometer setup with polychromatic incident x-ray beam, slits, Kirkpatrick-Baez focusing mirrors (KB) mounted on hexapods, polycrystalline sample, 2D CCD detector and energy dispersive point detector. (ˆeL
1,ˆeL2,ˆeL3),
(ˆeH
1,ˆeH2,ˆeH3) are the fixed Cartesian coordinate systems of the laboratory and the sample holder. (ˆeSr,ˆeSθ,ˆe S
z) is the cylindrical
coordinate system related to the sample. The trajectories of the diffracted beams are symbolized by the multidirectional dashed arrows (see text for detail). Dotted lines are guidelines.
Fig. 3 Laue patterns in the CDD detector coordinate sys-tem (2θ,χ). (a): Raw data. (b): Simulated pattern with the fundamental (closed symbols) and superstructure (open sym-bols) reflections.
ternatively, the Differential Aperture X-ray Microscopy (DAXM) [33, 34] can be coupled to the Laue measure-ments at the expense of much higher acquisition times. If there is only one grain probed by the x-rays, strains are integrated over the penetration depth. A depth res-olution can be provided by the DAXM, or if a suffi-ciently large number of Laue spots are collected, by indexing the Laue spots which are associated to a
con-stant penetration depth. This issue is out of the scope of the present study. Once the pattern indexed, scalar products of four non collinear diffraction unit vectors corresponding to reflections of known Miller indices en-able the expression of the reciprocal lattice vectors in the laboratory coordinate system [35]. The coordinates of the crystal lattice vectors were finally obtained by the Fourier transform. This led to the determination of the crystal orientation matrix and the unit cell param-eters (b/a, c/a, α, β, γ). Owing to the fact that energy discrimination is not possible with the used CCD de-tector, the energy of Bragg spots is unknown and the a cell parameter is not determined. Assuming that the deformed unit cell has the same volume as the unde-formed unit cell, the six independent components of the deviatoric strain tensor, denoted by εd
ij (i, j = 1, 2, 3)
can be calculated within the small transformation hy-pothesis in the crystal system of coordinates. Then, us-ing the crystal orientation matrix, they are expressed in the laboratory, sample holder and the sample co-ordinate systems through changes of basis. Deviatoric strain measurements with errors smaller than 5 × 10⁻⁵
were reported for the BM32 setup in optimal condi-tions (highly perfect germanium single crystal) [36]. In this study, the uncertainties related to deviatoric strains
were estimated to be 2 × 10⁻⁴. This only includes as-sessments on the parameters used in the analysis soft-ware.
To determine the unit cell parameter a and thus the full strain tensor, the energy of at least one Bragg reflec-tion must be measured. Three methods were developed for that purpose: switching from polychromatic mode to tunable-energy monochromatic beam mode [37], us-ing 1D or 2D energy dispersive detectors [31, 38] and a crystal filter [39] while remaining in the polychromatic mode. In this study, an energy dispersive point detector was used (see Fig. 2). The advantage of this method is that it does not require any modification of the beam-line setup, it is easily implemented and provides easily interpreted data obtained with counting times around hundreds of seconds. The simulation capabilities of the LaueTools software provided the Laue pattern on the sample side and allowed to position the energy disper-sive detector in the axis of diffracted beams. The 150 eV energy resolution of the detector led to an accuracy on reflection energies ∆E of about 5-10 eV. The corre-sponding uncertainty on the crystal lattice parameter a depends on the energy E of the reflection (∆E/E= ∆a/a). With a close to 3.59 ˚A, ∆a is in the 1-3 × 10⁻³˚A range. Therefore, errors in the order of 0.3-0.8 × 10⁻³ are obtained for the diagonal components of the full strain tensor.
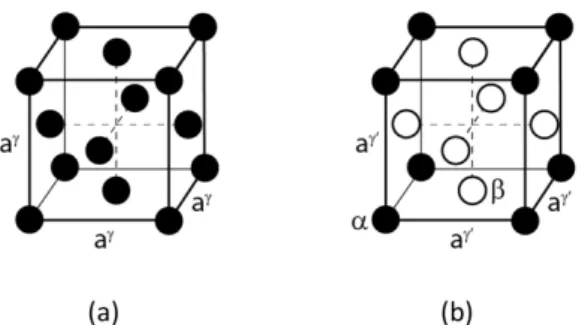
Fig. 4 The crystallographic structure of (a) the γ phase (A1), (b) the γ’ phase (L12).
The γ phase is a solid solution with a random distri-bution of the chemical species on a face-centered cubic lattice (see Fig. 4a). The γ’ phase corresponds to an ordered face-centered cubic L12 structure in which the
corner of the cubic lattice and the face centers are not equivalent atomic sites (α and β in Fig. 4b). The dis-tribution of atoms consists in chemical elements which occupy preferentially the α or the β sites, like aluminum and nickel, respectively. Some occupy indifferently the two sites like titanium. The space group of the γ and the γ’ phases are respectively Fm3m (225) and Pm3m (221). In the following, Bragg spots are divided in two
categories: those corresponding to fundamental reflec-tions for which the three Miller indices have the same parity and the superstructure reflections with Miller in-dices of different parities (see Fig. 3). The fundamental reflections are related to the face-centered cubic lattice. Due to the cube-cube orientation relationship between the γ and γ’ phases, they correspond to the sum of the intensities diffracted by the two phases and thus provide information associated with the whole irradi-ated volume. The superstructure reflections are relirradi-ated to the chemical ordering of the face-centered cubic lat-tice. They are thus only due to the diffraction by the γ’ phase.
The unstrained cubic lattice parameters of the γ and γ’ phases were measured by Wlodek et al. [29] af-ter chemical etching in an N18 alloy characaf-terized by an average grain size of 10 mm and three populations of γ’ precipitates. Although the microstructure investi-gated here is slightly different, the formation tempera-ture of the secondary γ’ precipitates can be assumed to be comparable. Therefore, the strain calculations were performed by considering the following cubic lattice pa-rameter values for respectively the γ’ phase and the av-erage alloy: aγ00=3.5873 ˚A and aγ+γ0 0=3.5917 ˚A. The last value was drawn from Vegard’s law; it applies to a microstructure with incoherent interfaces between the precipitates and the matrix.
3 Results
In the following, all the tensor components are expressed in the local cylindrical coordinate system (ˆer, ˆeθ, ˆez) of
Fig. 2. Two types of maps are analyzed: - Large maps recorded with a 50mm step size to quantify long range residual strain fields. - Fine maps recorded close to the edge of the sample with a 5 mm step size to observe how strain fields are accommodated at the grain scale. Uncertainties are indicated in parentheses. The next section describes the results related to the deviatoric strain tensor components. The results related to the full strain tensor determination are then presented in Section 3.5 for sake of clarity.
3.1 Initial state
Measurements were performed on the sample labeled S1 in Table 2, to quantify the initial deviatoric strain fields caused by the manufacturing process, the grain growth and coherency strains due to the lattice mis-match between the precipitates and the matrix.
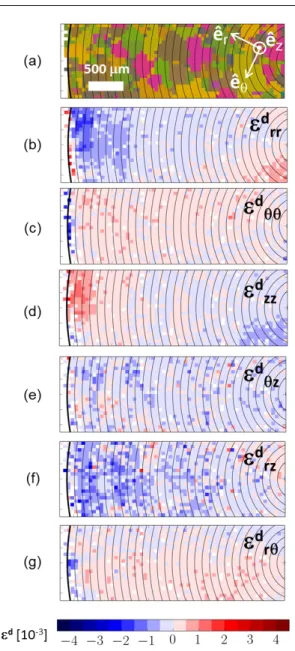
Figure 5 represents 3 mm × 1 mm grain orienta-tion and deviatoric elastic strain maps obtained from
Fig. 5 3 mm × 1 mm maps obtained from x-ray microd-iffraction measurements with a 50 mm steps size in the un-treated sample S1. (a): Grain orientation map (b)-(g): Aver-age alloy (γ+γ’ phase) deviatoric elastic strain components in the cylindrical coordinate system related to the sample surface represented in (a). The sample edge is at left of the maps and the sample center at the right. Lines are isoradius contours with 100mm spacings.
the fundamental reflections (50mm map step size). The sample edge is at the left of the maps and the sample center at right. Isoradius contours are represented by the solid lines which have spacings of 100mm steps. The grain orientation map in Fig. 5a includes 125 grains. The colors are related to the rotation angle between the Cartesian systems of coordinates associated with the crystal lattice and the laboratory (axis-angle represen-tation). Two neighboring pixels were considered in the same grain when the misorientation angle between the
crystal lattices was lower than 5◦. It is worth mention-ing that although the pixel size is 50 mm in maps, the beam size is close to 1 mm. Since the average grain size of the sample is 40 mm, some grains are not rep-resented in the orientation map. The amplitudes of de-viatoric strains were lower than 0.5 × 10⁻³, except in the 500 mm thick outer layer where they can reach 2 × 10⁻³ due to the machining (grinding) of the fatigue
test specimen. The analysis of superstructure reflections resulted in maps very similar to those of Fig. 5 (see ap-pendix B). When the strains in the average alloy and in the γ’ phase are identical, the same applies for the γ phase, which has a volume fraction close to 50%. There-fore, the measured strains are more representative of the manufacturing process and the grain growth than of coherency stresses caused by the lattice mismatch between the matrix and the precipitates; the latter are hardly detectable using deviatoric strains owing to their cube-cube orientation relationship.
3.2 Shot-peened state
Measurements were realized on the cross section of the cylindrical sample labeled S2 in Table 2, whose circum-ference was uniformly impacted by the steel shots. The radial direction ˆer corresponds to the average peening
direction and the axial direction ˆez is orientated along
the surface normal of the cross section.
Figure 6 represents the grain map and the maps of the six components of the deviatoric strain tensor (in units of 10−3) resulting from the analysis of fundamen-tal reflections in a 5 mm × 2 mm mapping area (50mm mapping step size). The sample edge corresponds to the thicker contour line on the left-hand side of maps. Arrows indicate the average shot-peening directions. In the 300mm thick white area close to the sample edge, the crystal lattice underwent high heterogeneous defor-mation. The diffraction spots were thus spread out (as-terism). Their intensity was so weak that it was not pos-sible to separate them from the intensity background due to a too small acquisition time. The determination of the grain orientation and strains was therefore not possible. In comparison to the reference state labeled S1 (Fig. 5), the shot-peening strongly modified the di-agonal components of the strain tensor (ed
rr, edθθ, e d
zz)
and weakly modified the shear components. The lat-ter exhibited variations of positive and negative strains with amplitudes lower than 0.5 × 10⁻³ in the biggest part of the maps. However, heterogeneous strains with amplitudes larger than 1 × 10⁻³ were measured at dis-tances between 300 mm and 800 mm from the sample edge (see Fig. 6e-g). For the diagonal components, the strain fields were modified in the entire sample and
Fig. 6 5 mm × 2 mm maps (50mm step size) obtained from the analysis of fundamental reflections of the shot-peened sample S2. (a): Grain maps and the cylindrical system of coordinates. (b)-(g): Average alloy (γ+γ’ phases) deviatoric elastic strain components. Arrows on the sample edge side indicate the average directions of the shot-peening. (h)-(m): Individual (symbols) and averaged values along the isoradius contour lines (line) spaced every 100 mm. Error bars corre-spond to standard deviations. Strains are given in units of 10−3.
mainly depended on the distance from its center. The average values of deviatoric strains on the isoradius con-tour lines are represented in Fig. 6 on the right side of maps. The three diagonal components behave dif-ferently:ed
rr is positive in the most external layer and
becomes negative after a distance of 400 mm, whereas ed
θθ and e d
zz are respectively negative and positive at
all distances. The standard deviation is close to 0.5 × 10⁻³. The shear strain components are zero on average (Fig. 6k-m) but strong fluctuations between grains (up to ±5 × 10⁻³) are observed up to a distance of
approx-imately 400mm from the sample edge (Fig. 6e-g). We now analyze the measurements recorded with a 5mm step size close to the shot-peened edge of the sam-ple. The 1 mm × 0.25 mm maps representing the grains and theedrr,edθθ andedrθ strain components are shown in Fig. 7. Results for the average alloy (γ+γ’) are on the left-hand side and those for the difference between the average alloy and the γ’ phase on the right-hand
Fig. 7 1 mm × 0.25 mm maps (5 mm step size) related to the shot-peening sample (S2). (a): Grain orientation. (b)-(d): Deviatoric strain components obtained from the analysis of fundamental reflections (γ+γ’ phases). (e)-(g): Differences between strains related to the average alloy and strains re-lated to the γ’ phase. The sample edge is located at the left side of figures. Arrows indicate the average shot-peening di-rection. The strain components are given with respect to the cylindrical coordinate system (ˆer,ˆeθ,ˆez) represented in (a).
Lines are isoradius contours with a spacing of 20mm.
side. The sample edge is located at left of the figures. For this set of measurements, the acquisition time has been increased to better differentiate the Laue spots from the background signal in the hardened layer. How-ever, due to the asterism, the position of each reflex-ion was not accurately defined. The intensity profile of the elongated spots was indeed composed of multiple peaks. The least-squared fitting with a regular func-tion (e.g., Gaussian, Lorentzian) yielded uncertainties on the Bragg angle of the order of several tens of mrad. This error related to the position of each Laue spot re-sulted in uncertainties on the grain orientation of sev-eral degrees and unrealistic values of strains. In Fig. 7, only the grain orientation is thus showed in the 300mm thick layer close to the sample edge (Fig. 7a) and white areas are represented on strain maps. This difficulty is also encountered with the EBSD technique [16, 17]. The general appearance of the strain field for all components was similar to the one described above. At this scale, the analysis clearly reveals the strain heterogeneities within grains and close to the grain boundaries. The strain heterogeneities and the grain microstructure of Fig. 7a are weakly related for the ed
rr and edθθ
com-ponents (Fig. 7b,c) and better related for theed rθshear
component (Fig. 7d). The analysis of the Laue patterns associated with the γ’ phase showed that the strain fields were very similar to those in the average alloy. As shown in Figs. 7e-g, which represents the difference be-tween the two strain fields for the ed
rr, edθθ, and e d
rθ
components, some significant deviations are measured in a specific grain indicated by arrows on the maps.
Fig. 8 Deviatoric elastic strain components of the average alloy as a function of the distance from the sample edge after the shot-peening operation and isothermal holding at 450◦C for 1 h 40 min (S3). The black solid lines correspond to aver-ages on isoradius, error bars to standard deviations and red square symbols to individual values. The average profiles of Fig. 6 related to the shot-peened sample S2 are represented by the black lines.
3.3 Strain redistribution after an isothermal holding The redistribution of deviatoric strains caused by the shot-peening was characterized after a 1 h 40 min hold at 450◦C (sample labeled S3 in Table 2). This tem-perature was representative of the thermal conditions endured by the inner part of high pressure turbine disks (bore area) [40, 41].
After the heat treatment, the dependence of strain fields on the distance from the sample center was again observed in large and fine maps. The highly deformed layer was also observed close to the sample edge (white areas). The behavior of the strain components was sim-ilar to those represented in Figs. 6 and 7 for the shot-peened sample S2 (see maps in appendix C). The main differences consisted in the presence of some accurate data in the hardened layer reflecting restoration effects (shown in Fig. 16), of lower strain levels and higher strain fluctuations. The last two effects are evidenced in Fig. 8, which represents the six independent compo-nents of the deviatoric strain tensor obtained from the large maps as a function of the distance from the sam-ple edge. For sake of comparison, the average profiles
Fig. 9 3 mm × 1 mm (50mm step size) grain orientation and deviatoric strain maps (average alloy) in, (a)-(g) sample S4 subjected to shot-peening followed by 300 cycles of fatigue at 450◦C, (h)-(n) sample S5 subjected to 300 cycles of fatigue at 450◦C. The sample edge is located at the left of the figures. Arrows indicate the average peening directions and lines with 100mm spacing are isoradius contours.
obtained in Fig. 6 for the shot-peened sample S2 are represented by the black lines. As for the shot-peened sample S2 (Fig. 7), the analysis of superstructure re-flections (γ’ phase) in the Laue patterns of sample S3 led to strain levels quite close to those obtained for the average alloy (not shown).
3.4 Strain redistribution after fatigue
The solicitation axis matches the ˆez direction of the
cylindrical coordinate system used to express strain com-ponents (see Fig. 2). The fatigue conditions, described in detail in appendix A correspond to a regime where a net plastic strain is accumulated during cycles, which consist of repeated tensile deformations. Assuming that strains introduced by shot-peening may have fully re-laxed at failure, the fatigue test was interrupted after 300 cycles (1 h 40 min, approximately 25% of the life-time [4]) at zero applied stress. To better verify the in-teraction of strain fields arising from shot-peening and fatigue, a sample subjected to fatigue only was also characterized usingmXRD.
Figure 9 represents 3 mm × 1 mm maps showing the grains and the deviatoric strain components related to the average alloy. Figures related to the shot-peened
sample S4 are at left of the figures and those related to the sample S5 only fatigued are at right. For the shot-peened sample, only a few characteristics of the strain maps of Fig. 6 are observed after fatigue at 450◦C (Fig. 9b-g): the 300mm thick white areas and the
average strain behavior of the neighboring shell located between 300mm and 800 mm from the sample edge. For all components, large strain heterogeneities were ob-served in the rest of the maps with amplitudes in the range ±2 × 10⁻³; they average to zero. The underlying grain microstructure was not identifiable in strain maps because some positive and negative strains occur from one pixel to the other. This means that heterogeneous intragranular deformation takes place in the material. Interestingly, no trace of the load direction (ˆez) was
found in the residual elastic maps. The strain fields re-lated to the sample S5 which, was only subjected to fatigue (Figs. 9i-n), differ significantly from those mea-sured in the sample S4 (Fig. 9b-g). Theed
zz component
which corresponds to the load axis was close to −1× 10⁻³ regardless of the distance. Theed
rr andedrz
com-ponents also display nonzero elastic strains regardless of the distance. Such behavior was similarly observed dur-ing an uniaxial tensile test in a nickel-based alloy [42]. The fine maps recorded on the sample edges of the shot-peened and fatigued sample S4 revealed weak mod-ifications of the surface layer with respect to the shot-peened sample S2. The strain amplitudes, the thickness of the hardened layer were similar. Only some restora-tion effects occurred in the hardened layer (white areas) due to the temperature (see Fig. 17 in appendix D).
3.5 Full strain tensor measurements
Energy measurements were performed at different sam-ple positions with the point detector located on the sample side (see Fig. 2). The energy, the Miller indices and the Bragg angle of selected reflections were used to determine the missing scaling factor in the analysis of the Laue pattern. This allowed to determine the full elastic strain tensor components. In principle, for each sample position, at least one fundamental and one su-perstructure reflection were searched within the trans-lation range of the detector to determine the strain com-ponents related respectively to the average alloy (γ+γ’) and to the γ’ phase. However, in practice, two limita-tions were encountered: (i) both refleclimita-tions could not be reached, and (ii) the energies of the reflections were superimposed to fluorescence energies of the chemical elements. For some sample positions, the energy of only one reflection was therefore determined.
3.5.1 Initial state
Conventional Laue diffraction measurements in a grain located at the center of the sample led to the following deviatoric elastic strain tensors for the average alloy (γ+γ0) and the γ’ phase:
εdγ+γ0[10−3] = 0.2(2) −0.3(2) 0.1(2) −0.3(2) 0.1(2) −0.8(2) 0.1(2) −0.8(2) −0.3(2) (ˆer,ˆeθ,ˆez) (1) εdγ0[10−3] = 0.3(2) −0.3(2) 0.1(2) −0.3(2) 0.4(2) −0.8(2) 0.1(2) −0.8(2) −0.7(2) (ˆer,ˆeθ,ˆez) (2)
Deviatoric components are close to zero for the two tensors. The measured energy of the 31¯5 (fundamental) and 31¯6 (superstructure) reflections were respectively 13416(4) eV and 16442(5) eV. This permits to calculate the full strain tensors:
εf ullγ+γ0[10−3] = 1.2(3) −0.3(2) 0.1(2) −0.3(2) 1.1(3) −0.8(2) 0.1(2) −0.8(2) 0.8(3) (ˆer,ˆeθ,ˆez) (3) εf ullγ0 [10−3] = −0.1(3) −0.3(2) 0.1(2) −0.3(2) −0.2(3) −0.8(2) 0.1(2) −0.8(2) −0.4(3) (ˆer,ˆeθ,ˆez) (4)
For the γ’ phase, the full and deviatoric strain tensors were very close to each other. For the average alloy, the hydrostatic part (Tr εf ull/3) was 1.0(3) × 10−3. This
means that most of the strains related to the diagonal components of the average alloy were caused by the γ phase. Further measurements in different grains showed that the amplitudes of deviatoric strains were below 1 × 10⁻³ for the two phases and that hydrostatic strains
up to 2 × 10⁻³ can be also reached in the γ’ phase.
3.5.2 Shot-peened state
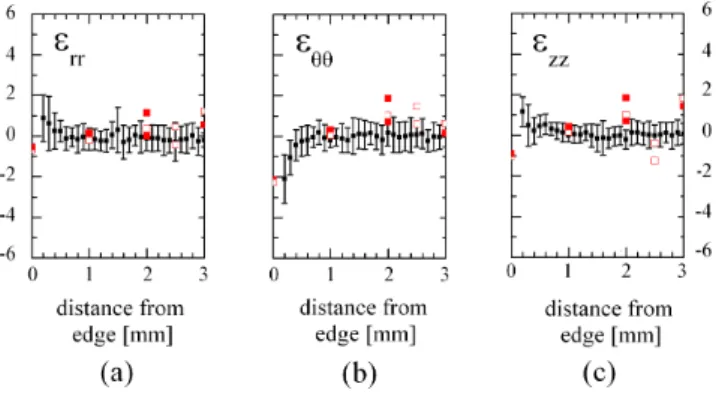
Figs. 10a-c represent the a, b and c lattice parameters of the crystal unit cell as a function of the distance from the shot-peened edge of the sample. Open sym-bols correspond to the γ’ phase and closed symsym-bols to the average alloy (γ+γ’). For the two sample positions labeled ”1” and ”2”, the energy of a superstructure and a fundamental reflection were measured. We observed that the crystal parameters were quite similar, showing that the coherency of the γ and the γ’ phases was not affected by the shot-peening operation. For some sam-ple positions, lattice parameters were calculated from two reflections of the same type (fundamental or su-perstructure). The accuracy on the lattice parameter values was of the order of 1-2×10⁻³˚A. The fluctua-tions of the lattice parameter values with respect to
Fig. 10 (a)-(c): Crystal unit cell parameters for the aver-age alloy (closed symbols) and the γ’ phase (open symbols) as a function of the distance from the shot-peened edge of the sample S2. Horizontal lines correspond to the strain-free lattice parameter values of the average alloy, the γ and the γ’ phases [29]. (d)-(f): Full and deviatoric strain components εrr, εθθ and εzz. The symbols correspond to the values
ob-tained from energy measurements, open for the γ’ phase and closed for the average alloy (γ+γ’). The line and errors bars are respectively the average deviatoric strain and the stan-dard deviations obtained from the maps in Fig. 6 (see text for detail).
the strain-free lattice parameters were due to the pres-ence of residual strains and to the different crystal lat-tice orientations with respect to the peening direction. The full strain profile calculated from the lattice pa-rameters and the crystal orientations is represented in Figs. 10d-f. Only diagonal components are shown be-cause deviatoric and full strain components are mathe-matically equal for non-diagonal terms (see e.g., Eqs. 3 and 4). The strain behavior was similar for the γ’ phase (open symbols) and the average alloy (closed symbols). For distances larger than 1 mm, strain amplitudes were lower than 2×10⁻³. For the two labeled sample
posi-tions, the difference of strain between the average alloy and the γ’ phase was lower than 1.5×10⁻³. For d=0.25
mm and d=0.5 mm, larger strain were measured for both the average alloy and the γ’ phase.
In figures 10d-f, the cross symbols correspond to the deviatoric strain values obtained from the full strain measurements. For a given distance from the sample edge, Laue patterns from only one sample position were analyzed. For sake of comparison, the average devia-toric strain profile obtained from the deviadevia-toric maps of Fig. 6 is also represented in Figs. 10d-f. (black line and standard deviation bars). The deviatoric strain values obtained from the full strain measurements (crosses) are very close to those obtained from the strain maps (black line). This shows that the data related to investi-gated sample positions are representative of the average behavior described in Sec. 3.2. We observe that the be-havior of the full and deviatoric components are roughly similar. They differ by less than 1-2×10⁻³. err is
pos-itive and becomes negative after about 0.5 mm from the sample edge, whereaseθθ andezz are respectively
negative and positive at all distances.
3.5.3 Shot-peened and fatigued state
Fig. 11 Deviatoric elastic strain components in 10−3units
as a function of the distance from the sample edge after shot-peening and 300 cycles of fatigue at 450◦(S4). The solid lines
correspond to averages of isoradius lines and error bars to standard deviations obtained from the large maps of Figs. 9b-d. Square symbols correspond to data obtained with energy measurements: the average alloy (closed symbols) and the γ’ phase (open symbols).
The diagonal components of the full strain tensor obtained from energy measurements for the sample S4 subjected to shot-peening and fatigue at 450◦C are rep-resented in Fig. 11 for the average alloy (closed sym-bols) and the γ’ phase (open symsym-bols). As in the pre-vious section, the solid line corresponds to the aver-aged deviatoric strains taken from isoradius contours of Fig. 9b-d. Fatigue has mostly removed the effects introduced by the shot-peening (see Fig. 10). Indeed,
all components behave in a similar manner with full strain amplitudes fluctuating between -2 × 10⁻³ and 2
× 10−3. In the investigated grains, the strain of the γ’
phase was very close to that of the average alloy. Such behavior could also have been attributed to a reference sample, which has not been subjected to shot-peening and/or fatigue. Finally, even if only one full strain value was measured in the hardened layer (white areas in de-viatoric maps), the fact that measured strains did re-lax deeper into the material suggests that the residual strains in the hardened layer were also significantly re-laxed for elastic equilibrium reasons. This was observed, for example, in the residual stress profiles measured in a shot-peened IN100 superalloy subjected to different thermal and mechanical loadings [9].
4 Discussion
4.1 Deviatoric stresses and crystal misorientations To estimate residual stresses from measured strains, single crystal elastic moduli should be known for each phase. This implies the manufacturing of a specific sin-gle crystal and in situ mechanical tests. Such work is out of the scope of this study. In this article, the Voigt and Reuss relationships between the macroscopic effec-tive elastic constants of the material (Young modulus and Poisson’s ratio) and the elastic constants of the cu-bic single crystal were used (see detail in appendix E). The difference between the Voigt and Reuss averaging methods is of the order of 10 MPa in the crystal coordi-nate system and the 2 × 10⁻⁴ uncertainty on strains is
equivalent to a 40 MPa uncertainty on stresses. There-fore, only the Voigt approximation was taken into ac-count for the stress calculation. In our measurements, deviatoric strain fields were identical for the average alloy and the γ’ phase. Because the γ0 volume faction was close to 50%, the deviatoric strain fields of the γ and γ’ phases were similar. Only differences in elas-tic constants would result in differences in deviatoric stresses. Fig. 12 summarizes the behavior of the three diagonal deviatoric components (sd
rr, sdθθ, s d
zz) and of
a shear component (sd
rθ) for each investigated
mechan-ical state of the N18 superalloy. The color scale ranges from -1000 MPa to 1000 MPa; the latter value is the measured yield strength of our samples at room tem-perature. Deviatoric stresses follow the same trends as the corresponding deviatoric strains: negative (positive) strains lead to compressive (tensile) stresses, respec-tively. The quantative results clearly show the effect of shot-peening on the reference state as well as the ef-fects of the applied thermal and mechanical loadings. Even if low stress amplitudes occur in the inner part
of samples, the sensitivity of the Laue microdiffraction technique (about 50 MPa) was large enough to reveal differences between each state in terms of stress ampli-tudes and stress heteregeneities. It is worth mentioning that the stress components in Fig. 12 are related to the deviatoric stress tensor. In all generality, the behavior of the stress field related to the deviatoric tensor σd
differs from the one related to the full tensor σ because of the relationship between their components: σd
ij= σij -1
3Tr σ (i,j=r,θ,z). Microhardness tests were performed
from the sample edge to 1 mm for each shot-peened state (S2, S3, S4). No differences were observed upon overlapping the profiles. The Vickers hardness linearly decreases from 650 HV to 460 HV at d=0.5 mm and then is constant.
The kernel average misorientation (KAM) in the EBSD/SEM is often used to estimate the plastic strain induced by surface treatments or mechanical loading conditions. The angular resolution for conventional and high resolution analyses is respectively 0.1-1◦and 0.01◦[43, 44]. With the mXRD technique, the resolution is close to 0.01◦ [39]. For the reference sample (S1), the KAM is lower than 0.02◦, except in the 100mm thick external layer, where misorientations are in the range of 0.3◦ -0.5◦ owing to the machining operation (not shown). Figure 13 represents KAM maps calculated frommXRD measurements with a 5mm step size, for the shot-peened (S2), the shot-peened and heated (S3), the shot-peened and fatigued (S4) and the fatigued (S5) states. On the left of the figure, the angular resolution is 0.1◦, which is similar to the better accuracy reachable with con-ventional EBSD. On the right side, the resolution is 0.02◦, which corresponds to the accuracy of our mea-surements. This value is also similar to the HR-EBSD resolution. Isoradius contour lines have a spacing of 100 mm. The dotted line separates the inner layer of the samples, in which the microhardnes is constant (460 HV), from the external hardened layer in which the hardeness linearly increases from 460 HV to 650 HV. black lines which are superimposed on maps represent the grain boundaries. Figure 13a-d show that, with the ex-ception of the 500mm thick layer affected by the shot-peening close to the sample edge, misorientations were mostly localized in the vicinity of the grain boundaries. When comparing Figs. 13a and 13c, it can be observed that fatigue did not introduce additional misorienta-tions at 1 mm from the edge (bottom of the figures). This is similar to the EBSD obervations reported in a shot-peened RR1000 superalloy also fatigued at 300◦C for 520000 cycles [17]. When the angular resolution is set to 0.02◦, the shot-peened state (S2, Fig. 13e) is
char-acterized by three layers: one highly deformed 300mm thick layer close to the sample edge, then a 300 mm
Fig. 12 Maps of deviatoric stress tensor components (σd
rr, σθθd , σ d
zzand σrθd ) calculated from measured strains (50mm step
size) in the reference (S1), shot-peened (S2), shot-peened and heated (S3), shot-peened and fatigued (S4) and only fatigued (S5) samples. The sample edge is localized at the left of the figures. Isoradius contour lines are represented with a spacing of 100mm.
Fig. 13 KAM maps (5mm step size) in the 0◦-0.5◦range for the peened (S2), peened and heated (S3), shot-peened and fatigued (S4) and fatigued (S5) states (see Ta-ble 2). In (a)-(d) a 0.1◦step (EBSD resolution) is uused and
in (e)-(h) a 0.02◦step (mXRD resolution) is used.. The sample
edge is localized at the top of the figures. Arrows indicate the shot-peened edge of the samples. The grain boundaries are su-perimposed on the misorientation maps and represented by the black lines. Isoradius contour lines have a 100mm spacing.
thick layer with intragranular misorientations and in the inner part, a 400mm thick layer where crystal mis-orientations were localized mostly in the vicinity of the grain boundaries. If KAM maps are used to quantify the effect of the shot-peening operation [15, 16], the af-fected depth may therefore vary with the used angular resolution. Here, a difference of 100 mm was observed between 0.1◦and 0.02◦. In addition to the fact that the three methods are not sensitive to the same physical quantities, this could also explain the differences ob-served when comparing results from Vicker
microhard-ness, XRD peak width and KAM or GOS measurements in EBSD/SEM. For the sample that was subjected to fatigue only (Fig. 13f), misorientations take place in grains and close to the grain boundaries when the an-gular resolution is set to 0.02◦. This contrasts with the angular resolution of 0.1◦(Fig. 13c) which suggests that LCF causes misorientations at only few grain bound-aries. Finally, the effect of fatigue on the initial shot-peened state was also better distinguished with a 0.02◦ resolution (S4, Fig. 13g).
4.2 Full stresses
In this study, an energy dispersive point detector was used to determine the energy of Bragg reflections and further to determine the full stress tensor components without any analytical assumption. This was done from the fundamental reflections related to the average alloy and from the superstructure reflections related to the γ phase. Due to the 150 eV resolution of the detec-tor, the accuracy on Bragg spot energies was close to 10 eV. Then uncertainties on the diagonal components of the strain and stress tensors were respectively close to 1 × 10⁻³ and 250 MPa. For Ni based superalloys, these values are too high to obtain quantitative data in areas where stresses are expected to be small that is, outside the hardened layer. Unfortunately, in this layer, the asterism of Bragg spots was too large and the de-termination of stresses was not possible. The fact that it was difficult to measure the energy of a fundamental and a superstructure reflections at each sample posi-tion was also an important limitaposi-tion of the method. The ”Rainbow” technique [39] would be a good alter-native because energy resolutions of 1 eV may be ob-tained for the two types of reflection at every sample
position [45]. Concerning, a better characterization of the hardened layer, a depth resolution is required in or-der to have workable outcomes. The differential aper-ture x-ray microscopy (DAXM) could help to reach this objective [33].
5 Conclusions
The residual elastic strain field caused by the shot-peening of the N18 polycrystalline nickel-based super-alloy was characterized at the grain scale and at the millimeter scale using the x-ray Laue microdiffraction technique coupled to energy measurements. The devia-toric elastic strain field clearly exhibits the trace of the peening operation in the whole sample cross-section. The sensitivity of the Laue microdiffraction method was large enough to quantitatively characterize the crystal misorientations and the deviatoric strain redistribution after an isothermal treatment and a LCF fatigue test both at 450◦C for the average alloy and the γ’ phase. This is the major result of this article. Although strains in the hardened layer were not accurately quantified ow-ing to strong crystal deformations, our measurements revealed that the deviatoric strain fields remaining af-ter fatigue are not equivalent in an only-fatigued sam-ple and in a shot-peened samsam-ple. Strains sensitive to the grain microstructure and to the load direction de-velop in the first case, whereas in the latter case, large heterogenous intragranular strains occur in a similar manner in all the strain tensor components. We also showed that the depth affected by shot-peening or the effects of the fatigue on the grain scale significantly dif-fer depending upon the angular resolution used in KAM calculations (0.1◦ or 0.02◦). In our measurements, only the KAM map can provide quantitative data in the 300 mm thick hardened layer produced by shot-peening.
This study also showed that the fast mapping capa-bilities of the Laue technique associated with the latest development of Bragg reflection energy measurements, is suitable for providing useful quantitative data for the residual stress determination in microstructures whose grain size is too large to use the sin2ψ method or too small to use the Ortner’s approach. The obtained micro-and macro- deviatoric strains, determined with an ac-curacy close to 2 × 10⁻⁴, can be confronted to HR-EBSD or FIB-DIC measurements, to modeling at the grain scale (e.g., crystal plasticity or dislocation dy-namics approaches) or at the mesoscopic scale (finite element based approaches). Concerning the full strain measurements, the results obtained for the reference, the shot-peened and the fatigued states suffered from the 150 eV resolution of the detector, which led to un-certainties close to 1 × 10⁻³ and 250 MPa on strain
and stress values respectively. The small translation range of the detector and the large number of fluores-cence emissions in the energy spectrum make difficult to measure the energy of a fundamental and a super-structure reflection at a fixed sample position. The use of the ”Rainbow” technique should improve these two limitations. The accuracy on the full stress tensor com-ponents obtained from the energy measurements was not good enough to extract a full stress profile on the cross section of the shot-peened sample. Therefore, it was not possible to quantify surface effects introduced by the cutting of the fatigue specimen on the residual stress components. However, for this purpose, the mea-sured deviatoric stress profiles could be compared (i) to those obtained from full stress measurements on the shot-peened surface using the sin2ψ method on a 500
mm depth or (ii) to the results of a finite element mod-eling in which stress relaxations caused by the cutting of the gauge can be simulated. Finally, a quantitative characterization of the hardened layer was not possible because a depth resolution is required in the analysis of the Laue patterns. The differential aperture x-ray microscopy coupled to the Laue microdiffraction tech-nique should be able to overcome this difficulty.
Acknowledgements This work benefited from the support of the REMEDDIES project (ANR-13-BS09-016) of the French National Research Agency (ANR) and the French Aeronauti-cal and Space Research Foundation (FRAE). The synchrotron data used in this article were collected during ESRF experi-ments MA3096, 32-02 778 and IN995. Authors gratefully ac-knowledge the BM32 staff for helpful discussions and techni-cal support, as well as D. Locq, C. Liard and P. Kanout´e from ONERA for the alloy development and mechanical testing.
A Fatigue testing
Fatigue tests were conducted under strain control with a 100 kN MTS 810 servo-hydraulic testing machine equipped with a split three-zone resistance furnace. Strains are determined with a 12 mm gage length extensometer attached on cylin-drical specimen with a diameter of 6.22 mm. A 25◦C/min ramp was applied to reach 450◦C. The repeated low cycle fatigue test was then realized with a triangular waveform defined by a 1 Hz frequency, a 10−3 s−1 strain rate, a 0
strain ratio (Rε=εmin/εmax) and a 0.5% strain amplitude
(∆ε/2=(εmax− εmin)/2). The stress-strain curve with the
first (dashed line) and the 300th (solid line) cycles is shown in Fig. 14.
B Deviatoric elastic strain components associated with the γ’ phase in the reference sample S1
Figure 15 is obtained from the analysis of superstructure re-flections (Miller indices with different parities) in the Laue
Fig. 14 Stress–strain curve corresponding to the interrupted fatigue tests performed at 450◦C in the coarse-grained,
shot-peened N18 superalloy with a 200 nm average size for the secondary γ’ precipitates (no tertiary). The first load cycle is represented by the dashed line and the 300th cycle by the solid line (see S4 in Table 2).
patterns recorded in the reference sample. The orientation map and the strain components are related to the γ’ phase. In comparison to Fig. 5, similar strain levels are observed. The larger fluctuations in the results arise from the fact that a smaller number of indexed Bragg spots are included in the analysis.
C Deviatoric elastic strain components associated with the sample S3 subjected to shot-peening and heating at 450◦C
Figure 16 is obtained from the analysis of fundamental re-flections (Miller indices with the same parity) in the Laue patterns recorded in the shot-peened and heated sample S3. Grain orientation and deviatoric strain maps recorded with a step size of 50mm are at the left of the figure, those recorded close to the sample edge with a 5mm step size are at the right side.
D Deviatoric elastic strain components associated with the samples S4 and S5 subjected to fatigue at 450◦C
Figure 17 is obtained from the analysis of fundamental reflec-tions (Miller indices with the same parity) in the Laue pat-terns recorded in the shot-peened and fatigued sample (S4) and in the only fatigued sample (S5).
E Relationships between the cubic crystal elastic constants and the effective isotropic elastic constants of the related polycrystal
The macroscopic effective elastic constants are found by aver-aging the anisotropic elastic properties of the individual crys-tal over all its possible orientations. In the so-called Voigt [46]
Fig. 15 3 mm × 1 mm maps obtained from x-ray microd-iffraction measurements using a 50 mm step size in the un-treated sample S1. (a): Grain orientation (b)-(g): Deviatoric elastic strain components associated with the γ’ phase (Voigt model) in the cylindrical coordinate system related to the sample surface represented in (a). The sample edge is at the left side of the maps and the sample center at the right side. The lines are isoradius contours with a spacing of 100mm.
and Reuss [47] approximations, the elasticity tensor and its inverse are averaged. For a cubic crystal symmetry, this leads to the following expressions for the Young modulus E, Pois-son’s ratio ν and shear modulus µ of the polycrystal:
EV = (C11 −C12+3C44)(C11+2C12) 2C11+3C12+C14 ER= 5 3S11+2S12+S44 νV = −4CC11+4C12−2C44 11+6C12+2C44 νR= − 2S11+8S12−S44 6S11+4S12+2S44 µV = C11−C125+3C44 µR= 4S 5 11−4S12+3S44 (5)
where V and R denote the Voigt and Reuss averaging meth-ods. {Cij} and {Sij} are respectively the three elastic
con-Fig. 16 Grain orientation and deviatoric elastic strain maps associated with the shot-peened and heated sample S3. Strain components are represented in the cylindrical coordinate sys-tem (ˆer, ˆeθ, ˆez) related to the sample surface and correspond
to the average alloy (γ+γ’ phases). The sample edge is lo-cated at the left-hand side of the figures. Arrows indicate the average direction of the shot-peening. The isoradius contour lines are spaced every 100mm. (a)-(e): 3 mm × 1 mm maps recorded with a 50 mm step size. (f)-(j): 1.1 mm × 0.1 mm maps recorded close to the sample edge with a 5mm step size.
Fig. 17 Grain orientation and deviatoric elastic strain com-ponents associated with (a-e) the shot-peened and fatigued sample S4, (f-j) the fatigued sample S5. The components are represented in the cylindrical coordinate system (ˆer, ˆeθ, ˆez)
related to the sample surface. They correspond to the average alloy (γ+γ’ phases). The sample edge is at left. The isoradius contour lines have a spacing of 100 mm. Arrows indicate the average direction of the shot-peening. A 5mm step size was used during themXRD measurements.
stants and compliances (in Voigt notation) of the cubic crys-tal. The Zener ratio A, which quantifies the elastic anisotropy, is defined by 2C44/(C11− C12). If we require that E, ν and A
are fixed quantities, the three elastic constants can be derived using the previous sets of equations:
Table 3 Single crystal elastic constants (in GPa) derived with the isotropic and anisotropic cubic elasticity from the isotropic Young modulus and Poisson’s ratio related to the investigated samples. C11 C12 C44 E ν A isotropic 291 125 83 216 0.3 1 cubic + Voigt 233 153 112 216 0.3 2.8 cubic + Reuss 248 146 143 216 0.3 2.8 CV 11= E · A+4+(A−6)ν (2+3A)(1+ν)(1−2ν) C R 11= E 5A· 3A+2−(A+4)ν (1−2ν)(1+ν) CV 12= E · A−1+(4+A)ν (2+3A)(1+ν)(1−2ν) C R 12= 5AE · A−1+(3A+2)ν (1−2ν)(1+ν) CV 44= EA · 5 2 1 (2+3A)(1+ν) C R 44= E 10· (2A+3) 1+ν (6)
The calculated values of {Cij} are listed in Table 3 for E =
216 GPa, ν = 0.3 and A = 2.8. The effect of the approxima-tion chosen to determine the elastic moduli is illustrated in Fig. 18 for the σd
rr deviatoric stress tensor component of the
shot-peened sample S2. The figure represents the profile of σd
rr calculated from the strain map of Fig. 6b with the Voigt
(black squares) and the Reuss (red circles) approximations. In Fig. 18a, all the data points of the map are represented as a function of the distrance from the shot-peened edge of the sample. Fig. 18b corresponds to the averaged profiles. Error bars represent the standard deviations. On the average over all data points, the relative difference between the Voigt and the Reuss approximations ranges from 20% to 23%. The mean value is 21% with a standard deviation of 0.3%.
Fig. 18 Profiles of the σd
rr deviatoric stress tensor
compo-nent related to the shot-peened sample (S2) calculated with the set of elastic moduli corresponding to the Voigt (black squares) and Reuss(red circles) approximations (see text for detail). (a) shows all points of the stress map as a function of the distance from the shot-peened edge. (b) corresponds to the averaged profiles; The error bars are standard deviations.
References
1. McClung R (2007) A literature survey on the stability and significance of residual stresses during fatigue. Fa-tigue Fract Eng Mater Struct 30(3):173–205
2. Antolovich D (2015) Microstructural aspects of fatigue in Ni-base superalloys. Phil Trans Roy Soc A 373(2038):1– 36
3. Chaudonneret M (1993) A simple and efficient mul-tiaxial fatigue damage model for engineering applica-tions of macro-crack initiation. J Eng Mater Technol 115 115(4):373–379
4. Boittin G, Locq D, Rafray A, Caron P, Kanout´e P, Gallerneau F, Cailletaud G (2012) Influence of γ’ pre-cipitate size and distribution on LCF behavior of a PM disk superalloy. In: Superalloys 2012, John Wiley & Sons, Inc., pp 167–176
5. Korsunsky A (2005) The modelling of residual stresses due to surface peening using eigenstrain distributions. J Strain Anal Eng 40(8):817–824
6. Cao W, Khadhraoui M, Brenier B, Gu´edou JY, Castex L (1994) Thermomechanical relaxation of residual stress in shot peened nickel base superalloy. Mater Sci Tech 10(11):947–954
7. Khadhraoui M, Cao W, Castex L, Gu´edou J (1997) Ex-perimental investigations and modelling of relaxation be-haviour of shot peening residual stresses at high tem-perature for nickel base superalloys. Mater Sci Tech 13(4):360–367
8. Evans A, Kim SB, Shackleton J, Bruno G, Preuss M, Withers P (2005) Relaxation of residual stress in shot peened Udimet 720Li under high temperature isothermal fatigue. Int J Fatigue 27(10-12):1530–1534, fatigue Dam-age of Structural Materials {V5th} International Confer-ence on Fatigue Damage of Structural Materials 9. John R, Buchanan D, Caton M, Jha S (2010) Stability
of shot peen residual stresses in IN100 subjected to creep and fatigue loading. Procedia Engineer 2(1):1887–1893 10. Stone H, Reed R, Holden T (1999) Determination of the
plane specific elastic constants of Waspaloy using neutron diffraction. Scripta Mater 40(3):1797–1808
11. Stone H, Holden T, Reed R (1999) On the generation of microstrains during the plastic deformation of Waspaloy. Acta Mater 47(17):4435–4448
12. Connor L, Stone H, Collins D, Preuss M, Hardy M, Rae C (2014) The effect of cooling rate from solution on the lattice misfit during isothermal aging of a Ni-base super-alloy. Metall Mater Trans A 45(5):2436–2444
13. Preuss M, da Fonseca JQ, Grant B, Knoche E, Moat R, Daymond M (2008) The effect of γ0 particle size on the
deformation mechanism in an advanced polycrystalline nickel-base superalloy. Proceedings of Superalloys 2008 14. Buchanan D, John R (2008) Relaxation of shot-peened
residual stresses under creep loading. Scripta Mater 59(3):286–289
15. Child D, West G, Thomson R (2011) Assessment of sur-face hardening effects from shot peening on a ni-based alloy using electron backscatter diffraction techniques. Acta Mater 59(12):4825–4834
16. Foss B, Gray S, Hardy M, Stekovic S, McPhail D, Shol-lock B (2013) Analysis of shot-peening and residual stress relaxation in the nickel-based superalloy RR1000. Acta Mater 61(7):2548–2559
17. Mess´e O, Stekovic S, Hardy M, Rae C (2014) Character-ization of plastic deformation induced by shot-peening in a ni-base superalloy. JOM 66(12):2502–2515
18. Viereck D, Lhe D, Vhringer O, Macherauch E (1991) Relaxation of residual stresses in nickel-base superalloy due to dislocation creep. In: International conference of strength of metals and alloys 9, Freund Publishing, pp 14–19
19. Musinski W, McDowell D (2015) On the eigenstrain ap-plication of shot-peened residual stresses within a crystal plasticity framework: Application to ni-base superalloy specimens. Int J Mech Sci 100:195–208
20. Barabash R, Ice G (2014) Strain and Dislocation Gradi-ents from Diffraction: Spatially-Resolved Local Structure and Defects. World Scientific Publishing Company 21. Kang K, Yao N, He M, Evans A (2003) A method for in
situ measurement of the residual stress in thin films by using the focused ion beam. Thin Solid Films 443(1):71– 77
22. Korsunsky AM, Sebastiani M, Bemporad E (2009) Fo-cused ion beam ring drilling for residual stress evaluation. Mater Lett 63(22):1961–1963
23. Salvati E, Lunt A, Ying S, Sui T, Zhang H, Heason C, Baxter G, Korsunsky A (2017) Eigenstrain reconstruc-tion of residual strains in an additively manufactured and shot peened nickel superalloy compressor blade. Comput Methods Appl Mech Eng 320(Supplement C):335–351 24. Benedetti M, Fontanari V, Winiarski B, Allahkarami M,
Hanan J (2016) Residual stresses reconstruction in shot peened specimens containing sharp and blunt notches by experimental measurements and finite element analysis. Int J Fatigue 87(Supplement C):102–111
25. M¨uller EMP (1961) Das sin2ψ-verfahren der
r¨ontgenographischen spannungsmessung. Z angew Phys 13(7):305–312
26. Ortner B (1983) Rontgenographische spannungsmes-sung an einkristallinen proben. In: Eingenspannungen, Deutsche Gesellschaft fur Metallkunde, Oberursel, pp 49– 68
27. Ortner B (1985) The choice of lattice planes in X-ray strain measurements of single crystals. Adv X-Ray Anal 29:113–118
28. Moran¸cais A, F`evre M, Fran¸cois M, Guel N, Kruch S, Kanout´e P, Longuet A (2015) Residual stress determina-tion in a shot-peened nickel-based single-crystal superal-loy using X-ray diffraction. J Appl Cryst 48(6):1761–1776 29. Wlodek S, Kelly M, Alden D (1992) The strucuture of N18. In: SD Antolovich RM RW Stusrud (ed) Superalloys 1992, John Wiley & Sons, Inc., pp 467–471
30. Ulrich O, Biquard X, Bleuet P, Geaymond O, Gergaud P, Micha JS, Robach O, Rieutord F (2011) A new white beam X-ray microdiffraction setup on the BM32 beam-line at the european synchrotron radiation facility. Rev Sci Instr 82(3):033,908
31. Robach O, Micha JS, Ulrich O, Gergaud P (2011) Full local elastic strain tensor from Laue microdiffraction: si-multaneous Laue pattern and spot energy measurement. J Appl Cryst 44(4):688–696
32. Micha JS, Robach O (2010) Available on: http://sourceforge.net/projects/lauetools/
33. Larson B, Yang W, Ice G, Budai J, Tischler J (2002) Three-dimensional X-ray structural microscopy with sub-micrometre resolution. Nature 415(6874):887–890 34. Yang W, Larson B, Tischler J, Ice G, Budai J, Liu W
(2004) Differential-aperture X-ray structural microscopy: a submicron-resolution three-dimensional probe of local microstructure and strain. Micron 35(6):431–439 35. Chung J, Ice G (1999) Automated indexing for texture