Sensitivity Analysis of Glazing Parameters and Operational Schedules on
Energy Consumption and Life Cycle Cost
Mohamed Amer, Waqas Ahmed Mahar, Guirec Ruellan, Shady Attia
Sustainable Building Design Lab, Faculty of Applied Sciences, Université de Liège, Belgium
Abstract
Building on rooftops has been evident in many European cities. However, there is no specialized code providing guidelines to achieve high performance roof stacking construction. Accordingly, we aim to support the decision-making on cost-optimal zero-energy roof stacking when selecting glazing parameters.
A reference model for a passive house made of timber construction has been developed. A set of variables have been identified with definitive ranges based on previous literature and the available materials in the Belgian market. Then, the objective functions for energy and cost have been defined for the sensitivity analysis. Finally, sensitivity analysis has been conducted, in which variables are evaluated individually based on their significance on energy consumption and cost has been.
Introduction
As stated by the European Commission, construction sector is responsible for more than 40% of the total energy consumption and 36% of the CO2 emissions in Europe. Thus, building’s energy performance has been put forward as a key element to achieve the European Union’s (EU) targets for 2020 to reduce each of the Green House Gas (GHG) and primary energy savings by 20%. A safe way towards fighting climate change could be achieved through providing cost-effective and highly energy efficient buildings (Knoop & Lechtenböhmer, 2017). Achieving zero-energy buildings requires using thick walls and insulations, which is accompanied in most cases with additional weight in construction (Attia, 2018). Moreover, cost-optimal measure has been a big concern in the last decade. Recently, new research agendas for urban densification started to emerge in response to the upcoming needs of Europe to accommodate increasing population while limiting urban sprawling (Attia, 2015). Many researchers have explored the implications of urban densification stating that higher densities support efficient infrastructure and reduces carbon emissions (Amer & Attia, 2017, 2018, 2019; Amer, Mustafa, Teller, Attia, & Reiter, 2017; Attia, 2016; Dieleman & Wegener, 2004; Nabielek, 2011; Skovbro, 2001). Others argue that more compact forms significantly reduce the energy consumption on the building and transportation scale (Ewing, Bartholomew, Winkelman, Walters, & Chen, 2008; Riera Pérez & Rey, 2013; Steemers, 2003). Marique and Reiter (2014) found that by increasing the
density of a neighbourhood alone without applying retrofitting measures can reduce up to 30% of the total energy consumption. Nilsson et al. (2014) came up with four strategies as an approach towards sustainable urban-rural futures. Yet, a package of polices should be provided to integrate increasing urban density with higher concentrations of employments, good transit network, parking areas and carbon taxing system (Brownstone, 2008; Gaitani et al., 2014; Lehmann, 2012; Madlener & Sunak, 2011).
On 2010, the European Commission has produced the Energy Performance of Building Directive EPBD-recast (European Commission, 2010), which made it possible to make informed choices that aim to help saving energy while increasing cost-effectiveness. Since then, several tools and methods have been proposed scientifically and practically to achieve zero-energy levels while maintaining cost-optimal targets. For instance, Georges et al. (2012) examined a single-family houses in Belgium by investigating a combination of heating systems and building designs. Marszal and Heiselberg (2011) aimed to find optimum life cycle cost measure for net-zero energy residential house in Denmark by examining three energy demand and supply systems. Hamdy et al. (2013) carried out a multi-stage, multi-objective optimization that aims to achieve cost-optimal and nearly zero energy building solutions through optimizing building envelop, active system and onsite renewable energy resources respectively, followed by a sensitivity analysis for the escalation rates of energy prices and their effect on the overall optimization results.
However, none of those methods or tools have been dedicated to study thoroughly the effect of glazing parameters and operational schedules on the overall performance of energy and cost. Only U-values were concerned for the glazing parameters, which lacks the description of the operational conditions and their consequent performance. Accordingly, in this study, we propose a framework that aim to achieve cost-optimal energy-efficient construction for roof stacking, by the mean of studying glazing parameters. In this study, sensitivity analysis has been conducted using Building Performance Simulation (BPS) tools, such as EnergyPlus, and parametric graphical user interface, such as Grasshopper. The decision-making on cost-optimal and energy-efficient glazing parameter is given through the provision of a solution space of glazing design options and operational parameters.
Methodology
The methodology of this paper is composed of 3 stages as shown in Figure 1. First, boundary conditions are set for the case study in terms of location, layout, and building parameters. Second, design variables and objectives are identified on which sensitivity analysis are conducted. Third and last step, simulation model is setup and sensitivity analysis is run for design variables.
Figure 1: Research methodology for the sensitivity analysis
Boundary conditions
This study is a part of an ongoing research project that investigates new construction on the rooftops of existing buildings around Europe. Accordingly, a reference model has been developed for a roof stacking residential module located in Brussels, Belgium. The module has to follow the same layout of the existing residential building. Given that there are several housing typologies, middle-class residential houses represents the majority of existing building in Brussels, with a percentage that reaches more than 75% as shown in Figure 2 (Van de Voorde, Bertels, & Wouters, 2015). The typical layout for a ground floor is composed of living, dinning, stairs and additional room on the backyard. The upper floors consist of bedrooms and bathrooms as shown in Figure 3.
Figure 2: A perspective for a middle-class housing typology
Figure 3: Typical layout for middle-class residential houses in Brussels
Case Study
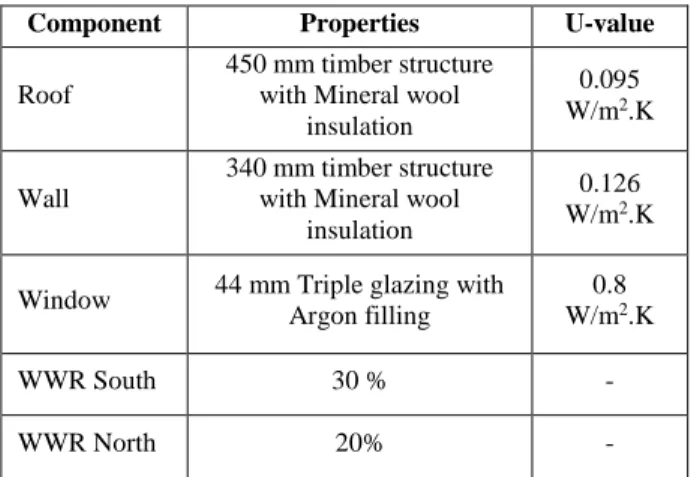
The case study is modelled and calibrated as a theoretical reference building. The roof-stacking module follows the same layout of an upper floor of a middle-class residential house. Moreover, as a prerequisite set by Brussels Capital region, every new construction should follow the Belgian passive house standards, which has been adopted in this research in the calibration process. The added module is made of timber framing as a best practice for lightweight construction. Therefore, as shown in Table 1, wall and roof sections are well insulated with U-value of 0.126 W/m2K, and 0.095 W/m2K respectively. The windows are
double glazed with U-value of 0.8 W/m2K and Window
to Wall Ratio (WWR) of 30% in the south façade and WWR 20% in the north façade. However, for sensitivity analysis, glazing properties, WWR of each façade, in addition to shadings with different operational schedules are going to be examined in the following section.
Table 1: Case study building properties
Component Properties U-value
Roof
450 mm timber structure with Mineral wool
insulation
0.095 W/m2.K
Wall
340 mm timber structure with Mineral wool
insulation
0.126 W/m2.K
Window 44 mm Triple glazing with Argon filling
0.8 W/m2.K
WWR South 30 % -
WWR North 20% -
A mechanical ventilation with 70% efficiency of heat recovery has been used, in addition to a heat pump for heating and cooling, with a value of Coefficient of Performance (COP) equal to 4.0, with 20C heating set
point, and 26C for cooling set point temperatures, based on ASHRAE standard 55-2004 for adaptive comfort model. Most importantly, indoor air temperature should not exceed 27C for 5% of the occupied hours to comply with passive house standard in Belgium.
Modelling, simulation and calibration
Before running sensitivity analysis, the model has been simulated and calibrated based on the monthly monitored values of the heading demand and average indoor air temperature of the reference model of a passive house. The calibration process has been carried out with the parameters of the boundary conditions, which includes building envelope and HVAC system.
Rhinoceros 3D and Grasshopper parametric tool have been used for modelling. While, Ladybug and Honeybee plugins have been used for the simulation process (Sadeghipour Roudsari & Pak, 2013). Ladybug and Honeybee plugins are used as interfaces for OpenStudio simulation software and EnergyPlus simulation engine. In order to run the simulation parametrically, an additional plugin has been used named Colibri. This plugin is capable of exporting the results directly to Excel files, in which the post processing phase takes place.
Design Variables
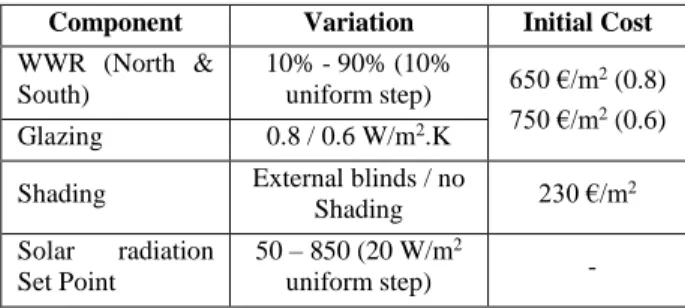
In this paper, design variables have been limited to building envelope’s glazing surfaces, this includes glazing properties, WWR for each of north and south façade, shading, and operational schedule based on various set point direct solar radiation values as shown in Table 2. The properties of building materials for each of the boundary conditions and design variables have been obtained from “Dataholz”, the European timber based materials database. Whereas the prices have been obtained from the annual Belgian database of construction works “Bordereau des Prix Unitaires”. The discount factor is equal to 15.43, taking in account the escalation rate of energy price in Belgium with a value of 2.7%.
Table 2: List of variables and values
Component Variation Initial Cost
WWR (North & South) 10% - 90% (10% uniform step) 650 €/m 2 (0.8) 750 €/m2 (0.6) Glazing 0.8 / 0.6 W/m2.K
Shading External blinds / no
Shading 230 €/m 2 Solar radiation Set Point 50 – 850 (20 W/m2 uniform step) - Design objectives
Two design objectives have been set in this paper: Energy consumption and Life Cycle Costing (LCC). Energy consumption takes into account heating, cooling and fan consumption for each of the heat pump and ventilation system as shown in Equation (1).
EC = He + Ce + Fe (1)
Where He stands for heating consumption, Ce stands for cooling consumption, and Fe stands for consumption of the fans for each the heat pump and ventilation system. LCC takes in consideration each of the initial cost of building elements, replacement, and operational cost as shown in in Equation (2). Operational costs are based on the energy prices in Belgium and count the effect of the change in building element’s parameter on each of the heating and cooling. Maintenance costs have also been excluded from this equation because sensitivity analysis is going to be conducted for window and shading elements, which are only counted in the replacement costs. Therefore, there are not maintenance costs during their lifetime.
LCC = ∑ij=1ICj+ ∑ij=1RCj+ OC (2) Where IC stands for investment cost for each building element. RC stands for the replacement cost for replaceable building elements such as windows and shading. OC stands for operational costs. LCC has been calculated on a 30 years span, which takes in consideration inflation rates in Belgium in each of the replacement and operational costs, i denotes the indexes for each design solution, while j denotes the index for each design parameter. Yet, the difference of LCC (dLCC) between the base case and simulated parameter is more important than predicting the actual value of LCC, which has been considered in this study. For instance, additional costs related to labour and installation, as well as HVAC system, have not been considered in this study since that they are given a constant value, which will not make a difference when comparing the results with each other in the sensitivity analysis.
The outcome of the dLCC varied between positive and negative values. Negative values represents a cost-efficient solution. Whereas positive values represents solutions with higher LCC than the base case.
Sensitivity analysis results
Sensitivity analysis has been carried out on two different levels. The first level aims to test different WWR with different thermal transmittance values for each of the north and south facades without any shading. While the second level aims to test the operation of shading elements under different set points of solar radiation on the southern façade. Sensitivity analysis has been conducted on the energy consumption for heating, cooling, and ventilation, and the difference of LCC between the base case and the new simulation parameter. Different WWR have been examined ranging between 20% and 90% with a uniform step of 10%. Moreover, two different glazing types have been examined. The first glazing have 0.8 u-value, which complies with passive house standards. The second glazing have 0.6 u-value, which has higher performance than the threshold required by passive house standard. On the same level, dLCC has been calculated for each case of WWR and both glazing thermal transmittance values.
Sensitivity analysis for window ratio – South
By changing window ratios, a difference has been resulted in terms of energy consumption and LCC. However, changing window ratio on the southern façade has shown a higher effect from that on the northern façade. As shown in Figure 4, by increasing window ratio on the southern façade, more energy is consumed for heating and cooling. However, the rate of increase in energy consumption for 0.6 u-values glazing is higher between 20% and 40% WWR, and then there is barely an increase with WWR higher than 50%, with a total increase of 3%. Whereas for 0.8 u-values, the significant increase in energy consumption starts from 70% WWR and more, with a total increase of 6%.
When comparing the difference in LCC, there has not been a significant change between 0.8 and 0.6 u-value glazing, where both have a linear increase when increasing WWR. However, using 0.6 u-value glazing tends to cost more than 0.8 u-value glazing due to the increase in the initial and replacement costs without significant decrease in the energy consumption values. In both cases, it has shown that when reducing the WWR, there is a significant reduction in the energy consumption as well as the difference in LCC.
Figure 4: Sensitivity analysis for WWR and glazing on the southern façade
Sensitivity analysis for window ratio – North
The results are relatively the same in the northern façade regarding energy consumption and difference in LCC as shown in Figure 5. The more window ratio the more energy is consumed and LCC. The rate of increase for each of both glazing types are the same, with a slightly better performance in terms of energy consumption and dLCC for glazing with 0.8 u-value.
The energy performance of both glazing u-values are negligible with bigger WWR on the north façade. However, there is a significant difference in the dLCC between both glazing values, with a difference of more than 20 Euros/m2. Yet, the difference in energy
performance in smaller WWR between glazing values is very small, with a value of 0.5 kWh/m2/yr. Thus, it makes
a difference using different glazing on different façade in the initial and running cost of the building.
Figure 5: Sensitivity analysis for WWR and glazing on the northern façade
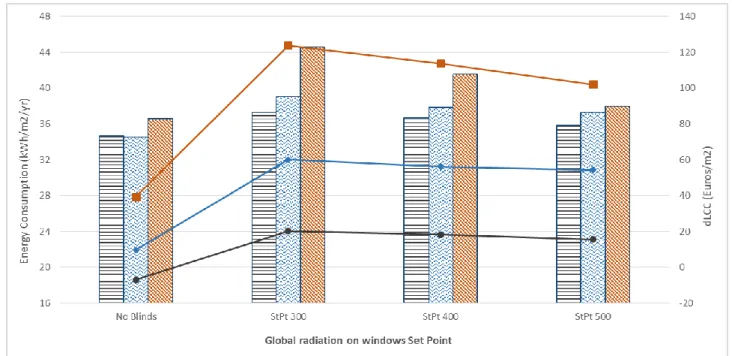
Sensitivity analysis for solar radiation set points On the second level of the sensitivity analysis, the orientation and WWR have been fixed. A shading element, venetian blinds, has been added to the window externally. The parameters of the shading element in terms of spacing, width, and distance to window have been fixed. The variation has been made to the operational schedule, which has been linked to the global solar radiation (the accumulation of direct solar radiation from the sun and diffuse solar radiation form the sky) that falls on the window surface. As shown in Figure 6, three different set points of solar radiations have been compared to no shading blinds as a base case, which are 300, 400, and 500 W/m2. The operational schedule works
on an hourly basis, where the operation of the shading elements has been linked to the hourly global radiation extracted from the Typical Meteorological Year (TMY) weather file of Brussels city. As given by the weather file, the global solar radiation in Brussels reaches up to 878 W/m2 in the most sunny days.
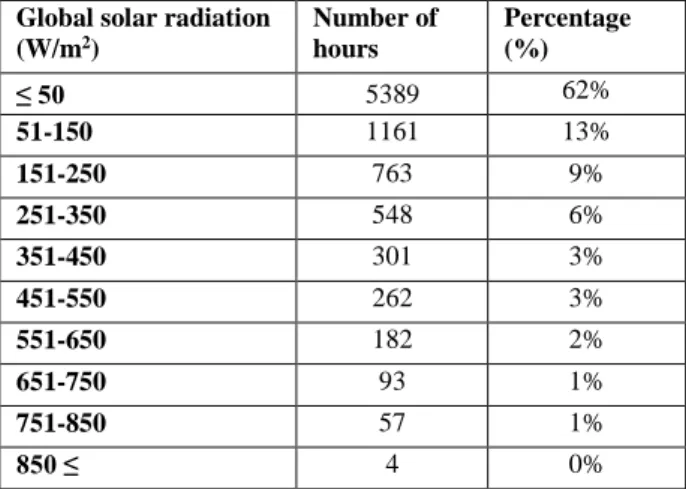
Table 3: The percentage of global solar radiation values in Brussels
Global solar radiation (W/m2) Number of hours Percentage (%) ≤ 50 5389 62% 51-150 1161 13% 151-250 763 9% 251-350 548 6% 351-450 301 3% 451-550 262 3% 551-650 182 2% 651-750 93 1% 751-850 57 1% 850 ≤ 4 0%
As shown in Table 3, the values of global solar radiations are divided into 10 segments, which shows that more than 60% of the yearly hours lie under has a minimum
radiation that ranges between 0 and 50 W/m2. This range
includes night hours. The second most dominant range lies between 51 and 550 W/m2, which represents more than 30% of the yearly hours. Whereas only 13% of the year has global solar radiation more than 350 W/m2.
As shown in Figure 6, different set points of solar radiations are examined on three different window ratios: 20, 50, and 90%. By adding external blinds, additional costs significantly affects the dLCC on all levels. However, the significance of external blinds is different
based on the set points solar radiation. When having smaller WWRs, the difference in set points do not make a huge significance in reducing energy consumption, and therefore the dLCC. In contrary, the larger WWR, the higher significance we achieve from external blinds. The results shows that when adjusting lower set points, there is tendency to consume higher energy. This is due to blocking solar gains needed for passive heating. Whereas when adjusting higher set points (e.g. 500 W/m2), it helps
blocking excess solar gains, and therefore reducing cooling demands.
Figure 6: Sensitivity analysis for set points of solar radiation on different window ratios
Discussion
The comparative difference in the costs (initial cost & present worth) of one meter square for each of the wall and window surface without any external shading is significant. Thus, the local prices of building materials makes a difference in terms of LCC, and as a results, dLCC for one solution in one country would definitely differ from another country. As shown in the previous results, dLCC has been affected by the initial prices of building materials more than that of the operational energy prices. According to the prices of building materials in the Belgian market, one square meter of a timber wall with insulation is equal to more than 260 Euros, and 300 Euros for roof construction. Whereas the price of one square meter of glazing surface reaches between 650 and 750 Euros, depends on the type of glazing. Therefore, on the building level, the more surfaces examined, the higher the difference in the prices. On the building level, even though the present worth (initial + replacement cost) have the same range
difference, in term of price, on both façade, their effect on the dLCC differs. On the southern façade, the difference in LCC is higher than that of the northern façade. This is due to the higher difference in energy consumption, and therefore the operational cost for heating and cooling. Even though, since that energy savings from the glazing with higher efficiency is more than that with relatively lower efficiency, there is no significant improvement in the dLCC. The difference in the present worth of both window types is around 15% higher, whereas energy consumption reduction has reached a maximum of 4% in the southern façade, and 0.5% in the northern facade. According to the examined case study, a reasonable trade off could be made for thermal transmittance of glazing when window ratios range between 20% and 70% on the southern facade. Whereas on the northern façade, glazing with higher transmittance (e.g. 0.8 W/m2.K) has better
performance on both the energy consumption and dLCC. While, when having higher WWRs (more than 80%), it is recommended to use external blinds, which reduces the solar heat gains and therefore cooling loads when adjusted
on 500 set points solar radiation. When adjusting on lower set points, there is a potential of reducing solar gains needed for passive heating and therefore reducing heating loads. Even though, when adding no blinds, there is significant reduction in the LCC due to eliminating the additional cost of the shading element, it is still recommended to add external blinds. This is due to its added function of blocking direct sunlight in the summer, which could affect the visual comfort for the occupants, which has not been studied due to the limitations in the scope of this research.
Conclusion
This research contributes in the field of decision making based on multi-disciplinary design approach. The results of this study shows the effect of window configurations on the energy consumption and dLCC. As mentioned in the boundary conditions of the case study, glazing surfaces have wall section has a u-value of 0.8 and 0.6 W/m2.K compared to walls section with a u-value 0.12
W/m2.K, which are equivalent to 5.6 and 4 times the wall
section. Sensitivity analysis shows the effect of the higher thermal losses occur by increasing window surface, which tends to make to alter simulation results in the favour of higher performance glazing.
In the given case study, it is recommended to use lower u-values for glazing on the northern façades for all window ratios. Whereas, it is recommended to use higher u-value for glazing on the southern façade for all window ratios, especially when having WWR more than 60%.
Further studies are recommended to study the effect of shading elements on different window ratios. Given the results of this research, set points of global solar radiation could be reduced to include those that ranges between 50 and 550 W/m2, with higher interval ranges (e.g. 50 W/m2
instead of 20 W/m2). Thus, parametric simulations and
sensitivity analyses could be conducted on different window ratios on the southern façade.
The importance of this research lies in providing robust and scientifically proven guidelines for those who are in charge in taking the decision in the design and construction. By improving the quality of roof construction in terms of energy and finance, there is a huge potential to provide the opportunity for a complete and deep renovation, and therefore reducing the overall ecological footprint on the city level when applying the best practices in construction.
Acknowledgement
This research was funded by a welcome grant provided by Liège University, which is gratefully acknowledged. We would like to acknowledge the Sustainable Building Design (SBD) Lab for the access to dataset and the use of monitoring equipment in this research and the valuable support during the experiments and the analysis of data.
References
Amer, M., & Attia, S. (2017). ROOF STACKING:
Learned Lessons from Architects. Retrieved
from SBD Lab, Liege University, Belgium website:
http://orbi.ulg.ac.be/handle/2268/210472 Amer, M., & Attia, S. (2018). Urban Densification
through Roof Stacking: Case Study. European
Network for Housing Research (ENHR) Annual Conference 2018. Presented at the European
Network for Housing Research (ENHR) Annual Conference 2018, Uppsala, Sweden. Retrieved from https://orbi.uliege.be/handle/2268/226538 Amer, M., & Attia, S. (2019). Identification of sustainable
criteria for decision-making on roof stacking construction method. Sustainable Cities and
Society, 47, 101456.
https://doi.org/10.1016/j.scs.2019.101456 Amer, M., Mustafa, A., Teller, J., Attia, S., & Reiter, S.
(2017). A methodology to determine the potential of urban densification through roof stacking. Sustainable Cities and Society,
35(Supplement C), 677–691. https://doi.org/10.1016/j.scs.2017.09.021 Attia, S. (2015). Overview and recommendation on urban
densification potential in Liège, Belgium.
Retrieved from
http://orbi.ulg.ac.be/handle/2268/182805 Attia, S. (2016). Towards regenerative and positive
impact architecture: A comparison of two net zero energy buildings. Sustainable Cities and
Society, 26, 393–406.
https://doi.org/10.1016/j.scs.2016.04.017 Attia, S. (2018). Net Zero Energy Buildings (NZEB):
Concepts, Frameworks and Roadmap for Project Analysis and Implementation.
https://doi.org/10.1016/c2016-0-03166-2 Brownstone, D. (2008). Key Relationships Between the
Built Environment and VMT (Special Report No.
298). University of California.
Dieleman, F., & Wegener, M. (2004). Compact City and Urban Sprawl. Built Environment, 30(4), 308– 323.
https://doi.org/10.2148/benv.30.4.308.57151 European Commission. (2010). Directive 2010/31/EU
Energy Performance of Building Directive (recast). Official Journal of the European Union,
153, 13–25. Retrieved from Scopus.
Ewing, R., Bartholomew, K., Winkelman, S., Walters, J., & Chen, D. (2008). Growing Cooler: The
Evidence on Urban Development and Climate Change. Washington, D.C: Urban Land
Institute.
Gaitani, N., Santamouris, M., Cartalis, C., Pappas, I., Xyrafi, F., Mastrapostoli, E., … Efthymiou, Ch. (2014). Microclimatic analysis as a prerequisite for sustainable urbanisation: Application for an urban regeneration project for a medium size city in the greater urban agglomeration of Athens,
Greece. Sustainable Cities and Society, 13, 230– 236. https://doi.org/10.1016/j.scs.2014.02.006 Georges, L., Massart, C., Van Moeseke, G., & De Herde,
A. (2012). Environmental and economic performance of heating systems for energy-efficient dwellings: Case of passive and low-energy single-family houses. Energy Policy, 40, 452–464.
https://doi.org/10.1016/j.enpol.2011.10.037 Hamdy, M., Hasan, A., & Siren, K. (2013). A multi-stage
optimization method for cost-optimal and nearly-zero-energy building solutions in line with the EPBD-recast 2010. Energy and
Buildings, 56(Supplement C), 189–203. https://doi.org/10.1016/j.enbuild.2012.08.023 Knoop, K., & Lechtenböhmer, S. (2017). The potential
for energy efficiency in the EU Member States – A comparison of studies. Renewable and
Sustainable Energy Reviews, 68, 1097–1105.
https://doi.org/10.1016/j.rser.2016.05.090 Lehmann, S. (2012). Can rapid urbanisation ever lead to
low carbon cities? The case of Shanghai in comparison to Potsdamer Platz Berlin.
Sustainable Cities and Society, 3, 1–12.
https://doi.org/10.1016/j.scs.2011.08.001 Madlener, R., & Sunak, Y. (2011). Impacts of
urbanization on urban structures and energy demand: What can we learn for urban energy planning and urbanization management?
Sustainable Cities and Society, 1(1), 45–53.
https://doi.org/10.1016/j.scs.2010.08.006 Marique, A.-F., & Reiter, S. (2014). Retrofitting the
suburbs: Insulation, density, urban form and location. Environmental Management and
Sustainable Development, 3(2). Retrieved from
http://orbi.ulg.ac.be/handle/2268/173790 Marszal, A. J., & Heiselberg, P. (2011). Life cycle cost
analysis of a multi-storey residential Net Zero Energy Building in Denmark. Energy, 36(9), 5600–5609.
https://doi.org/10.1016/j.energy.2011.07.010
Nabielek, K. (2011). Urban Densification in the Netherlands: National Spatial Policy and Empirical Research of Recent Developments.
Global Visions: Risks and Opportunities for the Urban Planet. Presented at the The 5th
International Conference of the International Forum on Urbanism (IFoU), National University of Singapore.
Nilsson, K., Nielsen, T., Aalbers, C., & Bell, S. (2014).
Strategies for Sustainable Urban Development and Urban-Rural Linkages.
Riera Pérez, M. G., & Rey, E. (2013). A multi-criteria approach to compare urban renewal scenarios for an existing neighborhood. Case study in Lausanne (Switzerland). Building and Environment, 65, 58–70. https://doi.org/10.1016/j.buildenv.2013.03.017 Sadeghipour Roudsari, M., & Pak, M. (2013). Ladybug:
A Parametric Environmental Plugin for Grasshopper to Help Designers Create an Environmentally-Conscious Design.
Proceedings of BS2013: 13th Conference of International Building Performance Simulation Association, Chambéry, France, August 26-28.
Presented at the 13th Conference of International Building Performance Simulation Association, Chambery, France.
Skovbro, A. (2001). Urban densification: An innovation
in sustainable urban policy? Presented at the
Area based initiatives in contemporary urban policy, Copenhagen, Denmark.
Steemers, K. (2003). Energy and the city: density, buildings and transport. In Energy and
Buildings, Volume 35, Issue, 3–14.
Van de Voorde, S., Bertels, I., & Wouters, I. (2015).
Post-war building materials in housing in Brussels 1945-1975. Vrije Universiteit Brussel: Graphius