Publisher’s version / Version de l'éditeur:
Journal of Thermal Insulation, 13, pp. 48-61, 1989-07
READ THESE TERMS AND CONDITIONS CAREFULLY BEFORE USING THIS WEBSITE. https://nrc-publications.canada.ca/eng/copyright
Vous avez des questions? Nous pouvons vous aider. Pour communiquer directement avec un auteur, consultez la première page de la revue dans laquelle son article a été publié afin de trouver ses coordonnées. Si vous n’arrivez pas à les repérer, communiquez avec nous à [email protected].
Questions? Contact the NRC Publications Archive team at
[email protected]. If you wish to email the authors directly, please see the first page of the publication for their contact information.
NRC Publications Archive
Archives des publications du CNRC
This publication could be one of several versions: author’s original, accepted manuscript or the publisher’s version. / La version de cette publication peut être l’une des suivantes : la version prépublication de l’auteur, la version acceptée du manuscrit ou la version de l’éditeur.
Access and use of this website and the material on it are subject to the Terms and Conditions set forth at
Measurements of the rate of gas diffusion in rigid cellular plastics
Schwartz, N. V.; Bomberg, M. T.; Kumaran, M. K.
https://publications-cnrc.canada.ca/fra/droits
L’accès à ce site Web et l’utilisation de son contenu sont assujettis aux conditions présentées dans le site
LISEZ CES CONDITIONS ATTENTIVEMENT AVANT D’UTILISER CE SITE WEB.
NRC Publications Record / Notice d'Archives des publications de CNRC:
https://nrc-publications.canada.ca/eng/view/object/?id=e4b50363-f537-40b5-bf83-c295b8c0302b https://publications-cnrc.canada.ca/fra/voir/objet/?id=e4b50363-f537-40b5-bf83-c295b8c0302bI R e f
S e r
TH1
Natlonrrl
Reseafch C o n d natlonalno. 1620
' BLDG Institute for lnstitut de
Research in recherche en b. -- - -- ~ -- L - - Construction construction I
'
IRC PUB
Measurements of the Rate of
-
Gas Diffusion in Rigid Cellular
Plastics
by N.V. Schwartz, M.T. Bomberg and M.K. Kumaran
Reprinted from
Journal of Thermal Insulation Vol. 13, July 1989
p. 48-61
(IRC Paper No. 1620)
mm
Ce document dCcrit une mCthods &
mesme de
diffusion d a gazdnns
les plastiqaes cellulairts. Un Cchanltillon est plact dans unc chambre, qui est ensuite fern&? h d r i q u e m a t et mist en pression h l'aide du gaz d'essai. L'aagmentadoode
la pression f a t pCdm unecerrmne
quantitt de gaz dans L'tchantiilon, a qui rtduit la pression dansIa
chamhe.
En
analysant l'tvolunon dt cem pression en f d o n du temps, on dtmmine lecoefficient de diffusion du mattriau.
~ a u t ~ m r s ~ ~ t m I ' a p p ~ & c c t a e m C t t a o d s 1 d e s 6 c h s n t i U 0 l l ~ p n w e n a m d e l a p a r t i e cenaale d'un
pmmu de
polystyrhc~ exrmde.Measurements of the Rate of Gas
Diffusion in Rigid Cellular Plastics
N.
V.
SCHWARTZ,
M.
T.
BOMBERG
ANDM.
K.
KUMARAN
National Research Council of CanadaInstitutr~ for Research in Construction Montreal Road, Building M24 Ottawa, Ontario, Canada KIA OR6
ABSTRACT: This paper dcscribcx a method for measuring gas diffusion through cellular plastics. A spccirnen is placed in a chamber, which is thcn scaled and prcssur- izcd with the t c ~ t gas. The prcssurc increase causes some gas to enter the spccimcn, and this entry results in a reduction of the chambcr prcssurc. By following the change in chamber prcssurc with time an appropriate transport characteristic for the rnatcrial is determined.
An application of this method to a core spccimcn of an extruded polystyrcnc board is presented.
INTRODUCTION
G
AS-FILLED CELLULAR PLASTICS (GFCP) are usually manufactured us- ing blowing agents, e.g., chlorofluorocarbons (CFC), that provide these products with thermal resistance higher than that of air-filled cellular plastics. During the service life of GFCP, a simultaneous inward diffusion of air components and outward diffusion of the blowing agent take place. This causes a progressive dilution of the blowing agent present in the cell-gas and results in decreased thermal efficiency, a process often referred to as aging. Thus, to predict the rate of changes in thermal performance of the GFCP one needs information on the rate of transfer for all gases which participate I in the aging process.I
Usually, rate of gas transfer through a material is measured on a specimen placed between two chambers with different gas pressures; the rate of gas flow and the corresponding pressure difference are then measured. These L measurements [I-41 require careful sealing of the specimen to the partitionI
dividing the high and low prcssurc chambers. I'crforming thcsc. types of .' measurements, the authors found that effective scaling around the spccitncn could be achieved only for cylinders with thickness larger than the dia1nctc.r. Attempts to increase the diameter to thickness ratio wcrc itnsucccssfi~l bc-
cause the specin~en would dcflcct and danlage the scal when the prcssurc
!
difference was applied.Since the main difficulty in thcsc mcasurcnlcnts is with the quality of the seal, any method which docs not rc>quirc a scal around the spccinlcn would be worth considering. Thcrcforc, a concept proposed in 1963 151, in which the specimen is placed inside a scaled chanlbcr was sclcctcd for this in- vestigation. In this method (51, the initial gas prcssurc thoughout the whole specimen volume had to be itniform. This condition may not be satisfied when testing C F C transfcr through a CFC-blown cellular plastic. As the rate of C F C transfcr is 10 to 1000 times lower than that o f t h c air conlpo- nents, it takes 10 to 1000 tinlcs longer to conditiotl the spccinlcn with C F C than with air. Thcrcforc, a non-unifornl distribution will prevail cvcn after lengthy conditioning of the specimen. The C F C transfcr, therefore, needs to be determined from another cxpcrinlcnt; c.g.. from the measurement of thermal resistivity versus time.
The fact that the aging proccxs of G F C P involves the transfer of two gases (or more) in and out of the specimen, leads to an additional requirement; the method must permit the analysis of a simultaneous transfer of a minimum of two gases. To perform calculations of chamber pressure versus time one must solve numerically a set of differential cquations. These equations, one for each gas being transferred, describe the conservation of mass along the gas flow path, from chamber to the specimen center. Similar cquations were solved by the procedure developed for an aging model [6], and therefore this procedure was used for calculations of the pressure chamber-time curves.
METHOD Experimental Set-Up
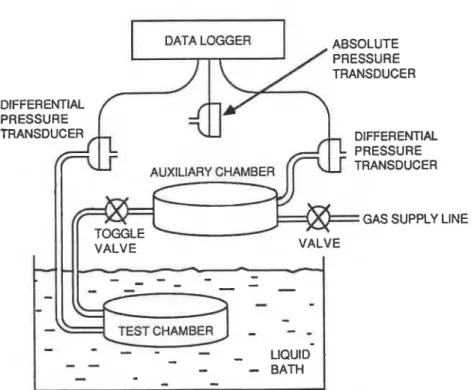
A schematic of the experimental set-up 1s shown in Figure 1. A test cham- ber is immersed in a liquid bath which is equipped with a heater and a con- troller maintaining the requlred temperature within 0.02 C. The test cham- ber is connected, through a valvc, to an auxiliary chamber, whlch in turn is connected through another valve to a supply o f pressurized gas. Each o f the chambers is connected to a differential pressure transducer with a measuring range of 0 to 133 kPa, measuring the difference between atmospheric and chamber pressures. An a b s o l v t ~ pressure tyansducer, with nwasuring range o f 0 to 133 kPa, is used to measure the atmospheric pressure. All pressure
I
TRANSDUCER
GAS SUPPLY LINE
-
- -
FIGURE 1. Schematic rcprcscntation of the sct-op to Incasurc the rate o f gas transfcr through cellular plastics.
transducers are connected to a P C computer used as the data acquisition system.
The test chamber is a brass cylinder with internal diameter of 153 mm, depth of 38 mm and cell wall thickness of 8 mm. The cylinder is soldered to the bottom plate. The top plate is removable and is fastened by eight bolts to the bottom plate. The sealing between the top plate and the cylinder walls is achieved by an indium gasket positioned in a groove of the top plate and melted before each assembly of the chamber. The pressure lines, of 6 mm copper tubing, are soldered to the brass chamber.
Test Procedure
SPECIMEN CUTTING
I
i
Specimens are prepared in two stages. First a thin sheet approximately 2mnl thicker than the required specimen thickness is cut using a horizontal band-saw. Discs, 150 mm in diameter, are then cut from this sheet and smoothed to the required thickness with a vertical spindle surface grinder ! equipped with a Carborundum disc.
M c ~ s u n ~ m i * r i t s i$ thc Kotc c ! f <;'IS L)itfirsiorr irr K ( ~ i t / <:c*//rr/(rr. I'/,r.ific-s 5 1
S P E C I M E N C O N D 1 7 7 0 N I N ~ ;
AS previously stated, one nlust know the initial prcssurc distribution of all
gases considered in the experiment. (In case of CFC, one ]nay cstimatc its
pressure distribution with help of the aging model caIc.i~lations.) T h c gas
I
pressure distributions arc known cithcr for a freshly manufactured foam or
for the foam subjected to a suitable conditioning. The Icllgth of thc condi-
tioning period is approxinlatcd assunling a diffi~sion into a slab iindcr condi-
tion o f constant anlbicnt gas prcssurc and for ;I Fourier number of 0.5 (71.
Thus, for the spccimcn with thickness, L, and a n cstim;ltcd effective diffii- sion coefficient, D, the required period, t , may bc, calcul;ltcci as:
T h e mcasurcmcnt is pcrfi)rnlcA in ail apparatus shown in Figurc
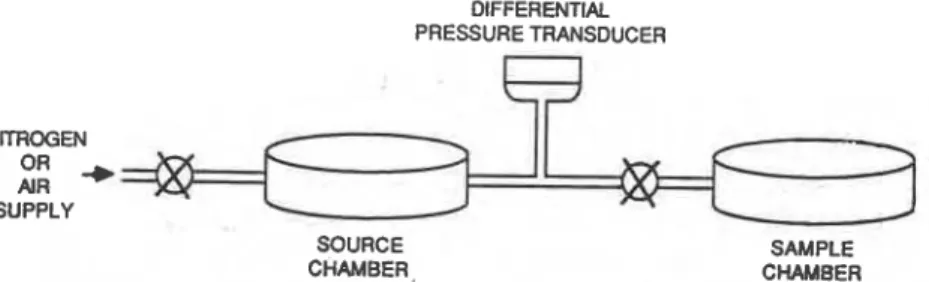
9.
which consists of t w o cylindrical pc~lynlt.thyti1~cthacwlatc (Plrxiglass) chambcrs. The source c h a t ~ ~ h ~ r with ;I v o l u ~ n c I',
= 0 5 0 111l. is counectrd through avalvc to a supply of prcsstrrizcii air, and through another valvc to a s.~mplt. chambcr. A diEcrciiti,~l prcssurc trattsdt~ccr, with tttrasuring rangc up to 13
kPa, is attachcd to the sottrcc r-hanib'.r.
The* saiiiplc c h ~ t i i b ~ r
has at1 inside dianirtcr o f 175 nun and volume Is2 = '380 ml. T h c samplc chnmber is cquippcd with a valve ct>rlnru-ting it t i ) at~nosphrric prcssurc.Thc rnrasurr.mcnt starts with thc sprci~iirn in the sarnplc chamhcr and both cha111bc.n a t a tr~lr,sphcric prcssurc. Thcs valvc cormccting rhc t w o chambcrs is closrd arid thr. sourr-c chari~bcr is prcssurizcd to d b i ~ t 1.3 kl'a above atnlosphcrlc prcssurc. T h c prcssurc difference is rccordcd as y,. The valve conncctlrlg both ch~lllbcrs is then opcncd ~ n d ~ f t c r prcssurc ~u both chambcrs has cqual~zcd, the diffcrentl~l prcssurc r c ~ d i n g is rccordcd as y,. Using the ideal gas law, the cffcct~vc spccllncn volume, I.,/, IS given by:
DIFFERENTIAL PRESSURETRANSDUCER
NITROGEN
::
+SUPPLY
y
CHAMBER^ SOURCE SAMPLECHAMBER
FIGURE 2 . Sc.licmatic rcpriscnt:~tic)~i 01' the, .;ct-tcp to t i ~ r . i s u r c ~ tlir c K ~ t i \ ~ c voh~riic oi the. spccimcil.
In this research, the effective volume was determined on three or four slices
I
stacked together, and reported as the average of nine repeated measurements. T H I C K N E S S O F D E S T R O Y E D SURFACE L A Y E R ( T D S L )Specimen thickness is measured with a micrometer. For calculations of gas transfer, however, the specimen thickness must be corrected for the thickness of the destroyed surface layer (TDSL) [8]. This correction accounts for the fact that during specimen preparation some cells at the material sur- face are broken. To determine the TDSL, one measures the effective volume of the specimen using a gas displacement technique, and calculates the dif- ference between geometric and effective specimen volume. This difference divided by the specimen surface area gives the thickness of the destroyed surface layer.
PRESSURE M E A S U R E M E N T S
After the specinlens are placed in the test chamber and sealed the record- ing of pressure in the auxiliary and test chamber is started. Now, the aux- iliary chamber, which is used to impose a controlled pressure step in the test chamber, is pressurized to thc required level and the valve to the test cham- ber is opened. This valve is closed when the pressure in both chambers is equalized (approximately 5 seconds). The output from the absolute pressure transducer which measures atmospheric pressure, and the output from the differential pressure transducer are added to give the absolute pressure in the chamber. This is done by a computer used as the data acquisition system. The chamber pressure-time curve may now be used to determine the effec- tive diffusion coefficient.
Since only one diffusion coefficient may be determined from a single ex- periment, the need to acconlmodate simultaneous diffusion of two or more gases implies a need for performing two or more experiments and then using an iterative procedure to optimize all determined material characteristics. Such an iterative procedure to calculate diffusion coefficients for oxygen, nitrogen and CFC, comprising three steps, is presented below.
Step 1. A conditioned specimen is placed in the test chamber, the oxygen pressure in the chamber is increased in the manner discussed above and the decay of the chamber pressure is measured. To calculate an approximate
C
transport coefficient for oxygen, one may either take a C F C diffusion coeffi-cient from the literature or disregard C F C diffusion for this initial calcula- tion. Then, assuming an oxygen diffusion coefficient one calculates a pres-
I!
sure decay curve and compares it with the measured one. The value of the oxygen diffusion coefficient is then adjusted proportionately to the differ-ence between measured and calculated curves. This process is repeated until the agreement between measured and calculated chamber prcssurc-time curves is judged acceptable, i.c., whcn it givcs, in a graphic display, a suffi- cient correspondence with mcasurcnlcnts.
Identical operations arc then performed aftcr cumplctinp the r ~ r a s i t r r m c n t
of chambcr prcssurc-tirnc curvus for nitroger1 diffusion.
Sftp 2. Using the apprt)ximatr oxygen 3 r d ~ i i t m g c n diffilsion cncfficic~~ts. undcr ~ i v c n initial (oxygen. nitrogen. CFC concrntrations) and boundary conditions, thc change in thermal resistivity with timr. is calcx~latcd with thc aging model [6] and cotnparcd with the results o f mcasurcnlcnts (using a thin layer o f the material). lliffcrcnt valucs of the CFC diffusion cocfficicnt are tried, until a sufficient corrcspondcncc with the Incasurcnlcnt is ob- tained.
Step 3. Using the above determined CFC diffusion cocfficicnt, the cham- ber pressure-time curvcs arc calculated again, as in step 1, and steps arc rc- peated until the final selection o f the cffcctivc diffi~sion cocfficicnt for oxy- gen and nitrogen is made.
Use of the Relative Pressure
Use o f the relative prcssurc is convcnicnt whcn comparing tests pcr- formed on the same material but undcr different conditions. The dimension- less relative prcxsurc is defined as:
where is the relative prcssurc, P i s the actual prcssurc which changes from the initial valuc o f P, to the final valuc at equilibrium, P,. To use the relative pressure, howtvcr, one must either mcasurc or estimate the initial and final prrssurc valucs. If a constant diff~~siori coefir-icnt is assunlrd, otw nlny usc Equations (4) m d
(5)
to calcalatc the initial and final prcssurcs.T h r proccsr; oF gas transfitr from the charnbcr t c ~ thc spcdmen conlpriscs two stagcs. Whcn prcssurc is incrcoscd in the tcst chanlbcr, thc gas cntcrs holes and crcviccs on rhc spcdmctl surfacc, some o f which arc induccd dur- ing the sample preparation. Only after a certain period, whcn the pressure reaches some initial Icvcl, P,, the second stage o f gas transfer process begins and gas starts to diffuse into the closed-cell volunlc o f the specimen. At this moment the process becon~cs independent o f the open cclls and cracks adja- cent to the material surfaces.
To determine the pressure separating thcsc two stages, P,, one must know the quantity o f gas injected to the test chamber. This information conlcs from the use o f a calibrated volunlc, called hcrc an aux~liary chamber. Thus, the initial .pressure level is dctcm~incd from Equation (4):
1 where P, is the equilibrium pressure before the introduction of the gas from the auxiliary chamber, P, is the pressure level in the auxiliary chamber, V,,, is the volume of the auxiliary chamber,
Vf,
is the free volume of the test chamber, i.e., the difference between the chamber volume, V,,, and the effec- tive volume of the specimen? Ve.For an ideal gas, the final equilibrium pressure is:
Pi '
v,
+
P,
.
v,
-
(1-
,I,)P,
=1;
.
+
ife (I-
d " ) (5)where d, is the ratio between densities of the foam and the solid polymer. Having defined the initial and final pressure levels, the actual pressure may be presented in the form of a relative pressure, Equation (3). Moreover, if the use of Equations (4) and (5) is permissible and the final equilibrium pressure is estimated, the measurements may be ended before reaching the final equi- librium conditions.
APPLICATION OF THE METHOD Materials
All measurements discussed in this paper were performed on the middle part (core) of an extruded polystyrene with average density of 35.5 kglm3. Measurements of gas transfers were made on three discs with mean thick- ness of 8.64 mm and diameter of 150.2 mm. Measurements of thermal resis- tivity were made on 5.2 mm thlck, 300 mm square specimens. The core layer of the extruded polystyrene is assumed to be homogeneous enough to disre- gard differences in structure of 5 and 9 mm thick layers.
This material was also characterized with the values of the initial thermal resistivity and the mass extinction coefficient. The latter property, measured with an infrared spectrophotometer by the Division of Physics NRCC, gave an average mass extinction coefficient of 46 m2/kg.
Results
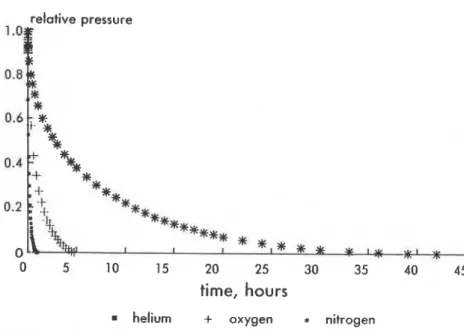
Results of the measurements of helium, oxygen and nitrogen diffusion are shown in Figure 3. Results of the measurements of thermal resistivity versus
i
time, that were performed on 5 mm thick specimens, are shown in Figure 4.'
*For semi-flexible and flexible foams, a correction must be introduced for specimen'comprer,
.,flative pressuretime, hours
helium
+
oxygen*
nitrogenFIGURE 3. Ilclativc prcxstirc curves k)r hcliuin, oxygcn .ind nitrogcti diffi~sion mca-
surmlcnts. 44
-
thermal resistivity, m.K/W 42 t F 40t
I1
38!'
36-'$
32 30 34!
!
4. 28-
0 50 100 150 200 250 300 350 time, days\
5.15 mm+
5.26 m m -- calculatedFIGURE 4. Aging curvc for core layers o f cxtrudcd polystyrene; the continuous curvc was calculated using model o f aging 161 and the cxpcr~n~cntally dctcrn~incd oxygcn, nitrogcn diffu- sion coeficients. Selected CFC-12 diffus~on coefficient 1s I x m21s.
56 N. V. SCHWARTZ, M. T. BOMBERG A N D M. K. KUMARAN
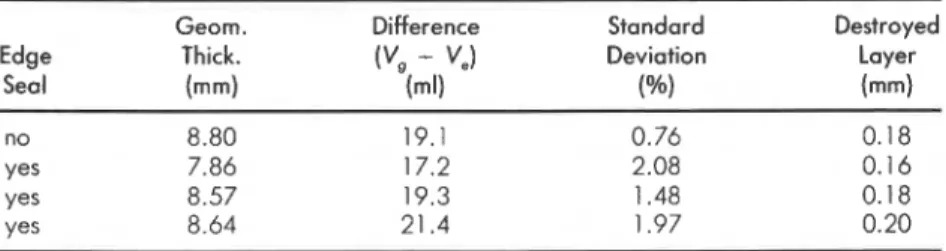
Table I . Measurements of the thickness of the destroyed surface layer from the
difference between geometrical, V,, and effective, V,, volumes and the standard
deviation in V, measurements on core of the extruded polystyrene board.
!
Georn. Difference Standard DestroyedEdge Thick.
(v, -
v.1
Deviation LayerSeal (rnrn) (YO) (mm)
no 8.80 19.1 0.76 0.18
Yes 7.86 17.2 2.08 0.16
Yes 8.57 19.3 1.48 0.18
Yes 8.64 21.4 1.97 0.20
Results of the measurements of the thickness of destroyed surface layer (TDSL) are given in Table 1.
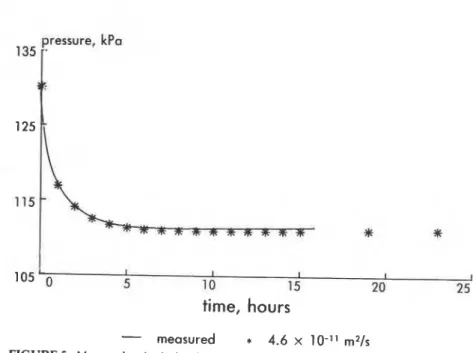
The best correspondence with measured aging curve, in step 2 listed above, was obtained with a CFC-12 diffusion coefficient of 1 x m2/s, see Figure 4. Using this CFC-12 diffusion coefficient, the measured mass extinction coefficient of 46 m2/kg and assumed initial pressure distribution of CFC-12 (estimated in such a manner that the measured initial thermal resistivity of 48 m-KIW would be obtained), calculations of the chamber pressure were performed for nitrogen and oxygen. It was found that the best correspondence to the chamber pressure curves, in step 3, was given by an effective diffusion coefficient 4.6 x lo-" m21s for oxygen, cf Figure 5, and 6.5 x lo-'' m2/s for nitrogen, cf Figure 6.
The uncertainties in the optimized values for the diffusion coefficients are discussed below. However, to check the reliability of the values arrived at, two independent series of measurements were performed on the same mate- rial as follows.
In one series, changes in nitrogen pressure in the chamber were intro- duced as five successive step changes, as shown in Figure 7. The figure also shows calculated changes in pressure for which the previously determined diffusion coefficients were used. The agreement between the measured and calculated pressure changes is good.
In the second series, one side of the specimen was coated with an epoxy resin to simulate one-sided nitrogen diffusion. Figure 8 compares the ex- perimental data with those calculated using the previously determined diffu- sion coefficient. Once again the agreement is sound.
UNCERTAINTY OF THE DIFFUSION COEFFICIENT DETERMINATION
b
There are two sources of uncertainty in effective diffusion coefficient:135 pressure, kPa
I
105 0 5 I 10 1 15 1 20 I 2 5 I
time,
hours
-
measured*
4.6 x l o - " m2/sFIGURE 5. Mcasurcd and calculated oxygen ch:lnlhcr pressure curves. Oxygen diKi~sion co- rfficicnt of 4.6 x 10P' t11~1s was usrd in the c.11~~1l.ltion.
pressure, kPa
145
TO
time,
hours
--
measured.
6.2 x 1 0 - l 1 m2/s x 6.8 x 1 0 - l 1 m2/s FIGURE 6. Measured and calculated nitrogen chanlbcr pressurc curves. Nitrogen diffusion coefficients 6.2 x lo-'= m'ls and 6.8 x lo-" m'ls wen. used.pressure, kPa
100 1 I t I I
-
0 50 100 150 200 250 300
time,
hours=
measured+
calculated FIGURE 7. A series of step changcs in nitrogen prcssurc.110; I I I I I 20 40 60 80 100
I
time,
hours pressure, kPa 140r
1351
1309
I i measured+
calculatedI FIGURE 8. Nitrogcn diffusion from onc sidc.
i
. . 2 5 120 115-
\
-
'k".i
+
,b wb+*-,*+.-
Mrasun,mi,nts cf rhc Kntc, c!f'C;as lli~iisiorr irc Ki,qitl (:c.//rr/t~t. /'ltwric.s 59 2. Uncertainty in selection of the diffusion cocfficicnt that gives best fit to
the measured chamber pressure-time curvcs
The first source of unccrtainty has much smallcr contribution to the total uncertainty than the sccond source. The uncertainties in physical Incasilrc- merits are as follows:
1. The standard deviation of series of the thickness measurements per- formed on a specimen with carefully ground surface was 0.03 mm. Nor- mally, 7 measurements are performed on a specimen with 5 mm thick- ness. Assuming normal distribution of errors (t-distribution) and probability level of 95'/0, one may calculate a two-sided confidence inter- val. For 7 measurements at 95% probability t-factor of 1.9 may be found
[9], and the percentage uncertainty of thickness measurement becomes (1.9 x 0.03)/(5 x 7) = 0.0043 or 0.43'%1.
2. Percentage uncertainty o f diameter rncasurcmcnt, even though only three readings are taken is much smalIcr bccausc it relates to a large measured value. For the same standard dcviation of 0.03 mm and 95% probability
level but three measurements, I-factor is 2 3 5 and thc uncertainty is (2.35
x
0.03)1(150 x 3) = 0.0003 or 0.03%.3. The differential pressure transducer is calibrated with a transfer standard with an accuracy 0.08 percent.
4. The uncertainty of the data acquisition systcm is estimated 0.1 percent. 5. A 25 mm thick alu~ilinuti~ disc was precision nlachincd and the gconlct- ric volume of 431.98 cm3 was determined. Using the technique described above, the cffcctivc volume was determined as 432.61 cm3, i.c., within 0.2%) of the geometric volume. The standard dcviation of these measure- ments was 1.8 cm3. Norn~ally, 9 mcasurcmcnts arc made on a specimen with approximately 400 cm3 cffcctivc volu~l~c~. For 9 ~ncasurcmcnts and for 95% probability Icvcl, I-factor is 1.83 and the unccrtainty of cff'cctivc volume is (1.83 x 1.8)/(400 x 9) = 0.0027 or 0.27'%1.
The sccond sourcc of unccrtainty is thc sc~lsitivity of thc crrrvc fit uscd for selecting diffusion cocfficicut.
Thc
importallcc of this uncrrtainty sourcc is displayed in Figurc 6 whew chanlbcr prcssun. rccordsd during nitrogcn dif- fusion nlcasurcnlcnts is shown in a scnli-lqarithrnic scale. Such a plot should br linmr cxccpt f i r thc initial and final stagcs oFthc diftilsion prorcss,and the intcrmcdiatc part o f thc plot can bc uscd for curvc firting.
Two curvcs wcrc calct~lat~d with thc cffirtivc diffi~sion cocficicnt of 6.2 x 10-" m21s and 6.8 x lo-" m21s. For each of thc~il, during a period from 3 to 20 hours (linear part of the curvc) an average diffcrcncc between calculated and measured pressures was established in the same manner as one calculates standard deviation, i.c., a square root of the sum of the squares of
the diffcrcnccs between calculated and measured pressures divided by 11,
where i r is the number of measurements. The average diffcrcnccs were 499
and 439 l-'a for cach of calculatcd curvcs respectively. In relation to the avcr-
I age pressure of 122700 Pa, these differences were 0.41 and 036'%,. For all practical purposes, cach of the curvcs whether calculated with cf- fcctivc diffusion coefficient of 6.2 x 10-I' m21s or 6.8 x lo-" ni21s is equally probable. Thus, despite high precision of pressure, volunlc and thickness measurements, as shown above, determination of the cffcctivc diffusion may not be reliable to niore than one significant figure.
COMMENTS O N LIMITATION OF THIS METHOD
The limitations of this test nlethod stem from the limitations in the valid- ity of the governing equations, which assume:
(a) Constant effective diffusion coefficient (since diffusion coefficient is a ratio of permeability to mass storage factor this assumption implies that both permeability and mass storagc factor remain constant)
(b) For a given changc in partial pressure of the gas the changc in niass (niass storagc factor) follows ideal gas equation.
(c) Predominantly one directional transfer in presence of unidirectional gradient of pressure, i.c., prcdonlinantly isotropic structure
(d) Specimen volume is large enough to consider material property as indc- pendent of the volunic tested.
Concern (a) requires a fundamental analysis of gas sorption and penctra- tion into polymer matrix, and is not easy to address. To address concern (b), two cdmputcr programs were written. One program used separate values of gas permeability and mass storage factors, and allowed modification of each of the values. The other program used an effective diffusion coefficient, i t . , a ratio of these two variables and ideal gas law to calculate the mass storage factor. For the measurements examined in this work, namely nitrogen and oxygen diffusion in polystyrene, both programs gave the same results.
Concerns (c) and (d) were partly addressed by Shankland [3] who postu- lated that the specimen thickness must exceed 20 cell-layers, i t . , the thick- ness of cellular plastic specimens must not be less than 3-5 mm.
CONCLUDING REMARKS
This paper presented an iterative procedure to calculate gas diffusion coefficients involving two sets of measurements:
b
1. The rate of gas diffusion in cellular plasticsMi,asurc.rnc,tits id'tlrc. Kntc, of' <;(is Djflirsiorr irr Kiyirl <.'c~lIrrL~r. I'l(rstic.2; 6 1
Both heat and gas flow measurements were pcrforiiicd o n thin niatcrial
layers, not only to reduce the measurement period but ~ l s o to prcparc test
specimens with structure as uniform as possible.
T h e procedure was applied to a core of an extruded polystyrene board and
three effective diffusion cocfficicnts were determined. Thcsc cocfficicnts
!
were then used for calculations and conipared with other independent ex-
periments, see Figures 5-8. O n e may observe that thc values of oxygen,
nitrogen and CFC diffusion cocfficicnts dctcrinincd with the proposed pro-
cedure were representative for the cxaniiilcd material and can be iiscd in evaluation o f long-term thermal resistance.
ACKNOWLEDGEMENTS
T h e authors arc indebted to C;. l? Mitalas for assistaiicc in numerical cal-
culations and to J. G. Thcriaillt and
K.
G. Marchand w h o constructed theapparatus described. Thanks arc also due to Dr. N. L. Kowcll, Division of
Physics, NRCC for determination o f the extinction coefficient of the foain.
REFERENCES
I. Ilayncs, H. A. "The l'roccss ofl)iK~~sion through a Rubber Mcnlbranc," I'roc. Roy.
Sir., A97:286-307 (1920).
2 . Hcnncssy, l3. J., J. A. Mead 2nd T. C. Stcnning. Tlrc- R,rrrrc,rlbility qf'l~lli2;rics Alrrrs,
The Plastics Institt~tc. England, N I X rcfcrcncc number 678.5; 539.23; 539.217, pp. 1-60 (1967).
3. Shankland, I. R. "Gas Transport in Closed Cell Foanis:' in A~l~uirtrts irr Fi)rlrrr A.~irr,y,
M)I. 1 . Brandrcth, cd. Yorklyn, 1lE:Caissa Editions (1986).
4. Mukhcrjcc P. S. "A Study of the I)iKt~sion and I'crnic.;~tion Characteristics o f
Fluorocarbons through Polymcr Films," Thcsis. Widcncr Uliivcrsity. School of Engineering, Chcstcr, PA (1988).
5. Michacls. A. S., W. R. Victh and H. J. L3ixlcr.J. i!/'l'i~lyrrrc.r Scii,rrcc; 1'1irt H: R)lyrrrrr
Lettc~rs, 1 : 19-23 (1 963).
6. Bomberg, M. "A Model of Aging for Gas-Filled Cellular Plastics:'J. i$'Cr~ll~.rlnr
Plaslics, 24:327-347 (July 1988).
7. Carslaw, H. S. and J. C. Jacgcr. Corrd1rctii)rr qf H t u ~ in Solids. Oxford at Clarcndon
Press, p. 97 (1959).
8. Bombcrg, M. "Scaling Factors in Aging of Gas-Fillcd Cellular Plastics," sub-
mitted to J. i$ Cc~lltrlar Plastics.
9. Natrclla, M. G. Exyi~rinrc~trtolStatistics, Natit)tral Burisau cfStnrrlk~rtt: Handbtwk 91, US
This paper is being distributed in reprint form by the Institute for Research in Consnuction. A list of building practice and research publications available from the Institute may be obtained by writing to
the Publications Section, Institute for Research in Construction, National Research Council of Canada, Ottawa, Ontario, KIA OR6.
Ce document est dishbud sous forme de M-&-part par 1'Institut de recherche en construction. On peut obtenir une liste des publications de l'lnstitut portant sur les techniques ou les recherches en matikre de Mtiment en eaivant B la Section des publications. Institut de recherche en construction. Conseil national de recherches du Canada, Ottawa (Ontario). K 1A 0R6.