1
Simulation of humidity and temperature distribution in green roof with
pozzolana as drainage layer: influence of outdoor seasonal weather conditions
and internal ceiling temperature
Mostafa Kazemi1*, Luc Courard2
Corresponding author *
1- Ph.D. Candidate, GeMMe Building Materials, Urban and Environmental Engineering (UEE), University of Liege, Liège, Belgium, E-mail: mostafa.kazemi@uliege.be
2- Full Professor, GeMMe Building Materials, Urban and Environmental Engineering (UEE), University of Liege, Liège, Belgium, Email: luc.courard@uliege.be
Abstract
The outdoor seasonal weather conditions can influence the insulation performance of extensive green roof. In addition, the thermal behavior of extensive green roof can be affected by the thickness of its layers including substrate and drainage layer. On the other hand, the replacement of polyethylene modular panel with porous aggregates as drainage layer can affect the water retention capacity of green roof. Therefore, in this study, the green roofs with pozzolana (porous volcanic gravel) as drainage layer under constant and variable inside temperatures were modeled and subjected to the weather conditions of winter and summer to assess the humidity and temperature variations in the depth of the systems. The results showed that there was a decrease in temperature through the depth of the green roof system for the winter period, while the reverse occurred for the relative humidity. During the winter period, the green roof model with the 10-cm substrate and 8-cm pozzolana was recommended to be used. However, the model with the 8-cm substrate and 6-cm drainage layer had the best insulation performance, particularly for the summer period. Moreover, the internal ceiling temperature fluctuation of system under variable inside temperature was higher than that under constant inside temperature.
Keywords: humidity and temperature distribution; green roof; pozzolana; seasonal weather conditions; internal ceiling temperature.
2 1. Introduction
In recent years, the low energy performance of buildings has made a great demand on using the systems and materials with high insulation efficiency in the construction sector (Kumar and Kaushik 2005; Rincón et al. 2014). The replacement of common flat roof with extensive green roof is proposed as one of the viable solutions to improve the energy efficiency of houses and buildings (Azizkhani and Haberl 2020; Coma et al. 2016; Culligan 2019). The thickness of extensive green roof ranges from 60 mm to 200 mm (Oberndorfer et al. 2007) and it is basically formed by different layers: vegetation, substrate, filter, drainage and insulation layers (Tabares-Velasco et al. 2012).
The extensive green roof has some advantages over common flat roof as reported by researchers to improve the insulation efficiency of buildings (Castleton et al. 2010; D’Orazio et al. 2012; Jim 2014; Niachou et al. 2001; Tam et al. 2016). However, it is still based on non-environmentally friendly materials in the drainage layer such as the polyethylene modular panel (Pérez et al. 2012; Rincón 2014; Shahmansouri et al. 2021; Vila et al. 2012). Regarding this, the replacement of the aforementioned panel with natural aggregates has been proposed by some researchers for the drainage layer of green roof (Wanielista et al. 2008). The performance of natural gravel and polyethylene modular panel as drainage layer was compared to each other by Wanielista et al. (2008). The results showed that increasing the atmospheric temperature caused to enhance the evapotranspiration process, once the natural gravel aggregate was utilized as drainage layer. Furthermore, there was no significant difference between the quality of water either leaked from the polyethylene modular panel or from natural gravel aggregate. Parizotto and Lamberts (2011) used the pebble and gravel as drainage layer in the green roof. The results showed that the diffusive properties of substrate and drainage layer caused to add the thermal mass to the green roof to absorb large amounts of heat. This process led to slowing heat transfer down within green roof layers and reducing the daily temperature fluctuation.
The permeability of drainage layer can be improved using natural aggregates such as pebble and gravel as drainage layer (AzariJafari et al. 2015; Uhl and Schiedt 2008; Vijayaraghavan et al. 2012). However, the water retention capacity of these materials is not so much. Concerning this, the use of some materials with more porosity such as crushed bricks and pozzolana (volcanic porous gravel) can be considered as a promising approach to enhance the water absorption capacity of drainage layer as stated by some researchers (Akbarzadeh Bengar et al. 2020; Berardi
3
et al. 2014; Coma et al. 2016; Courard et al. 2010; Jahandari et al. 2017; Kazemi et al. 2020; Nematzadeh et al. 2020; Saberian et al. 2019a). Regarding this, Ngan (2004) showed that the recycled crushed brick can be used in the substrate and drainage layers. As a porous lightweight material, the crushed brick was able to increase the water retention capacity of green roof system and it relieved pressure on substrate and drainage layer. Berndtsson et al. (2006) observed that the crushed brick as drainage layer kept small particles of soil and didn’t allow them to pass through the bottom of green roof. Another study by Palla et al. (2009) showed that the drainage layer of Lapillus (a volcanic porous material) generated a suitable condition for the dewatering of the green roof. Cascone et al. (2018) performed a study on green roof in the city of Catania (Italy) with a Mediterranean climate. In this study, the overloading of older building structures with new green roofs was compared to those with the existing roof. They also compared the energy performance of the former to that of the latter in terms of surface temperatures and energy savings. According to the results, the use of green roof during the cold period caused to reduce the energy consumption for the heating of building by 2–10%.
The energy saving performance of green roof was evaluated by Coma et al. (2016; 2014), Pérez et al. (2012) and Rincón et al. (2014) in Puigverd de Lleida (Spain) where had a Mediterranean climate with low precipitation and mean annual temperature between 12°C and 14 °C. It had also a thermometric regime with large differences between a very hot summer and a long winter (between autumn and the last frost may take more than 160 days). In the summer 2011, Coma et al. (2016; 2014) and Pérez et al. (2012) made some identical house-like cubicles with the green roof without filter and insulation layers and with the drainage layer of pozzolana in Puigverd de Lleida (Spain) with low rainfall. So, the effect of rainfall on the insulation performance of green roof could be ignored, particularly during the summer 2011 in Lleida. These climate and weather conditions in turn provided a stimulating research work to assess the thermal performance of green roof. On the other hand, the vegetation scarcely covered the top of substrate, because it was in the growth phase, and therefore the solar radiation protection was poor at the top of the green roof. For this reason, the substrate and drainage layers played a key role in the insulation performance of green roof. According to the results, the thermal insulation of green roof with the substrate and drainage layer of pozzolana was better than that of the conventional flat roof. To assess the insulation performance of green roof systems particularly in the winter period, the same identical house-like cubicles was tested by Coma et al. (2016) in
4
Puigverd de Lleida, once the vegetation coverage decreased at the top of green roof owing to the disappearance of plants during the winter period. This condition in turn made the study more objective to assess the insulation performance of substrate and drainage layers, subjected to the solar radiation and outside temperature in the winter period. However, the influence of moisture could not be ignored during this period. So, the simultaneous influence of humidity and temperature over the green roof with the drainage layer of pozzolana was evaluated. The thicknesses of substrate and drainage layer were 5 cm and 4 cm, respectively. The results showed that the green roof with the aforementioned thicknesses could not provide energy savings for the buildings compared to the traditional flat roofs in a Mediterranean continental climate, particularly during the winter period.
Generally, the climate characteristics or the building loads substantially affect the energy saving potential of green roofs (La Roche and Berardi, 2014). In addition, the heat flow through green roof system can be affected by the moisture content in the substrate layer (Mukherjee et al. 2013). Moreover, the soil depth can influence the indoor daily temperature swings in warm and humid climate (Ascione et al. 2013; Bates et al. 2013; Lazzarin et al. 2005; Qin et al. 2012; Simmons et al. 2008; Wong et al. 2003) and it is able to play a fundamental role in reducing the thermal load over the rooftop (Nardini et al. 2012). Concerning this, the effect of different parameters including the substrate depth on thermal performance of green roof system in different climate zones was assessed by researchers (Berardi et al. 2017; Mukherjee et al. 2013). According to the results, the green roof without insulation layer was proposed for rooftop of buildings in a cooling dominated climate due to high thermal mass of substrate layer and the generation of evapotranspiration cooling phenomenon in substrate and vegetative layers (La Roche and Berardi, 2014). However, the substrate layer performance was less favorable in a heating dominated climate. Therefore, the use of insulation layer for the green roof system was recommended particularly for winter period to decouple the indoor environment from external influences. Similarly, Coma et al. (2016) showed that the green roof layers including substrate and drainage layers of pozzolana was unable to provide a suitable insulation performance for the inside of the buildings particularly for the cold period. They suggested that increasing the thickness of substrate and drainage layer might improve the insulation performance of extensive green roof in winter season. So, it was required to optimize the thickness of green roof layers to provide an adequate thermal mass for the top of houses and buildings particularly during the
5
winter period (Coma et al. 2016; Mickovski et al. 2013). Meanwhile, European standards have not proposed the optimum thickness for green roof layers with respect to their thermal resistance for different climate conditions (Bellazzi et al. 2020; Saadatian et al. 2013). Therefore, there is a demand for modelling the thermal and humidity performance of green roof in winter to optimize the thickness of its layers and then comparing its results with summer period. In addition, the constant and variable inside temperatures can influence the humidity and temperature variations in the depth of green roof systems. In this study, the WUFI software was used to model the integration of temperature and humidity variation in the depth of the green roof subjected to the weather conditions of Lleida and then the insulation performance of substrate and drainage layer of pozzolana in the green roof was assessed, particularly during the winter period. Later on, a parametric study was performed to assess the effect of different thicknesses of substrate and drainage layer of pozzolana on the thermal and humidity variation in the depth of the green roof. Thereafter, the green roof models were subjected to the weather conditions of Lleida for the summer period to compare their results with those of the winter period. In the next step, the thermal performance of green roof system was modeled using ABAQUS software and after verifying the models, they were numerically subjected to the variable inside temperature (free floating temperature) and then the thermal performance of green roof models under constant and variable inside temperatures was compared to each other.
2. Construction of green roof models
2.1. WUFI implementation
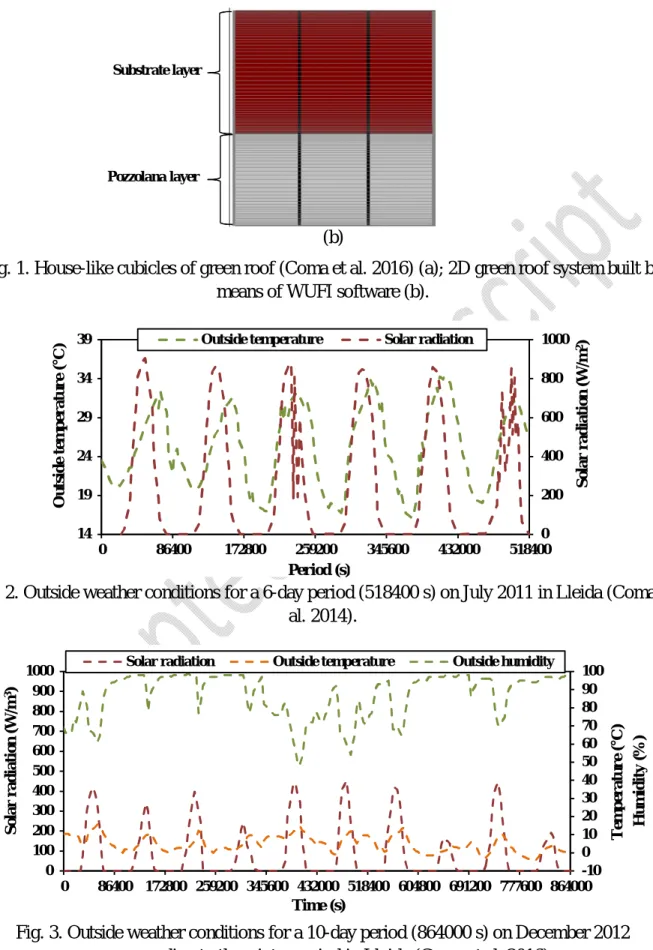
In this study, the WUFI software was used to evaluate the simultaneous influence of humidity and temperature over thermal performance of green roof system including drainage layer of pozzolana and substrate. The WUFI software is capable of modeling the simultaneous moisture and temperature distribution through the depth of building materials (Azizkhani and Haberl 2020; Nore et al. 2017; Salo et al. 2018). Table 1 presents the characteristics of green roof’s layers. According to the other research results (Stovin et al. 2015; Tommasi et al. 2015), the values of 57% and 40% were supposed for the porosity of pozzolana and substrate, respectively. The experimental cubicle specimen fabricated by Coma et al. (2016) is depicted in Fig. 1(a). As shown in Fig. 1(b), the fine grid was automatically introduced to the two-dimensional (2D)
6
system to validate the models by green roof specimens at the top of presented house-like cubicles made by Coma et al. (2016) and Pérez et al. (2012). According to the experimental works, the rooftop of house-like cubicles was made with different layers including substrate, drainage layer, waterproofing membrane, thin concrete layer for the generation of a slope, and roof structure. As mentioned by Coma et al. (2016) and Pérez et al. (2012), contrary to the control cubicle specimen, the insulation layer at the bottom of the drainage layer was omitted from house-like cubicles with green roof system and since the insulation performance of lower layers was negligible, the bottom of drainage layer was easily exposed to constant inside temperature (24 °C) generated by a heat pump with an automatic function. Therefore, the simulation of substrate and drainage layers was adequate to reliably assess the thermal performance of green roof models between indoor and outdoor spaces.
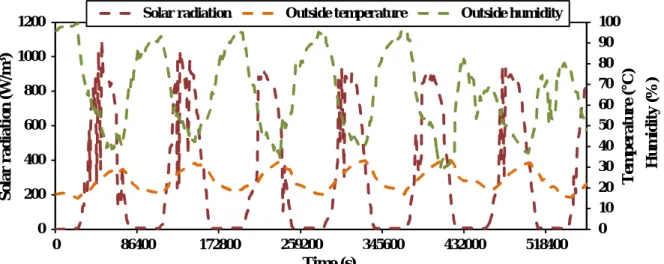
The outside temperature and solar radiation for the beginning of July 2011 (summer period) in Lleida (Fig. 2) were provided by Coma et al. (2014). In the aforementioned period, the effect of rainfall was negligible. In addition, since Lleida had a dry Mediterranean climate condition of Lleida, Coma et al. (2014) only considered solar radiation and temperature as outside influences on green roof performance as shown in Fig. 2. The fluctuation of internal ceiling temperature of green roof specimen with the drainage layer of pozzolana was measured for the same period by Pérez et al. (2012). Therefore, similar to the experimental works, the green roof model of GR-P-D5-S5 was subjected to the outside climate changes for the beginning of July 2011 (Fig. 2) and constant inside temperature (24 °C), where the thickness of substrate and drainage layer was 5cm and 4cm, respectively. Thereafter, the fluctuation of internal ceiling temperature of green roof model (temperature at the bottom of the 2D green roof model) was obtained and verified with that of the green roof specimen given by Coma et al. (2016) and Pérez et al. (2012). After verification of 2D green roof model, it was subjected to the variable outside humidity, temperature and solar radiation for the end of December 2012 in Lleida (Fig. 3) and constant inside temperature (22 °C), measured by Coma et al. (2016) to assess the simultaneous influence of humidity and temperature over the green roof model, particularly during the winter period. Later on, to perform a parametric study on the green roof model during the winter period, the thickness of pozzolana as drainage layer increased up to 5, 6, 7, and 8 cm (the reference numbers of 2-5 in Table 1). Then, the thickness of substrate increased up to 6, 7, 8, 9, and 10 cm (the reference numbers of 6-10 in Table 1). Finally, the thickness of substrate and drainage layer
7
increased by keeping constant the ratio of substrate to drainage layer, equal to 1.25 (the reference numbers of 11 and 12 in Table 1).
In the next step, the verified green roof models using WUFI software were subjected to the weather conditions of Lleida on July 2012 and constant inside temperature (24°C), corresponding to the summer period. Then, the thickness of drainage layer and substrate increased by keeping constant the ratio of substrate to drainage layer, equal to 1.25 (the reference numbers of 11 and 12 in Table 1). Thereafter, the results of summer period were compared with those of winter period.
It is noteworthy that the idea of this study was to assess the effect of substrate and drainage layers’ thickness on thermal performance of green roof system without change in materials’ properties. Therefore, the specific heat and thermal conductivity of substrate and drainage layers were assumed to be constant once the thickness of models increased as presented in Table 1.
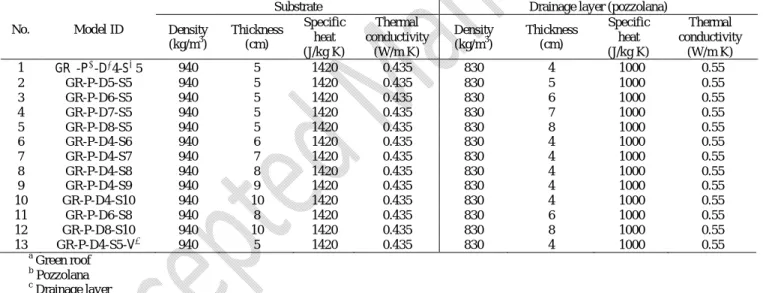
Table 1. Characteristics of green roof layers.
No. Model ID
Substrate Drainage layer (pozzolana)
Density (kg/m3) Thickness (cm) Specific heat (J/kg K) Thermal conductivity (W/m K) Density (kg/m3) Thickness (cm) Specific heat (J/kg K) Thermal conductivity (W/m K) 1 GR -P -D 4-S 5 940 5 1420 0.435 830 4 1000 0.55 2 GR-P-D5-S5 940 5 1420 0.435 830 5 1000 0.55 3 GR-P-D6-S5 940 5 1420 0.435 830 6 1000 0.55 4 GR-P-D7-S5 940 5 1420 0.435 830 7 1000 0.55 5 GR-P-D8-S5 940 5 1420 0.435 830 8 1000 0.55 6 GR-P-D4-S6 940 6 1420 0.435 830 4 1000 0.55 7 GR-P-D4-S7 940 7 1420 0.435 830 4 1000 0.55 8 GR-P-D4-S8 940 8 1420 0.435 830 4 1000 0.55 9 GR-P-D4-S9 940 9 1420 0.435 830 4 1000 0.55 10 GR-P-D4-S10 940 10 1420 0.435 830 4 1000 0.55 11 GR-P-D6-S8 940 8 1420 0.435 830 6 1000 0.55 12 GR-P-D8-S10 940 10 1420 0.435 830 8 1000 0.55 13 GR-P-D4-S5-V 940 5 1420 0.435 830 4 1000 0.55 a Green roof b Pozzolana c Drainage layer d Substrate e
Variable inside temperature (free floating temperature)
(a)
8 (b)
Fig. 1. House-like cubicles of green roof (Coma et al. 2016) (a); 2D green roof system built by means of WUFI software (b).
Fig. 2. Outside weather conditions for a 6-day period (518400 s) on July 2011 in Lleida (Coma et al. 2014).
Fig. 3. Outside weather conditions for a 10-day period (864000 s) on December 2012 corresponding to the winter period in Lleida (Coma et al. 2016).
0 200 400 600 800 1000 14 19 24 29 34 39 0 86400 172800 259200 345600 432000 518400
Outside temperature Solar radiation
O u ts id e te m p e r atu r e ( °C ) S o lar r ad iati o n (W/ m 2) Period (s) -10 0 10 20 30 40 50 60 70 80 90 100 0 100 200 300 400 500 600 700 800 900 1000 0 86400 172800 259200 345600 432000 518400 604800 691200 777600 864000
Solar radiation Outside temperature Outside humidity
Te m p e r atu r e ( °C ) H u m id ity (% ) S o lar r ad iati o n (W/ m 3) Time (s) Substrate layer Pozzolana layer
9
Fig. 4. Outside weather conditions for a 6.5-day period (561600 s) on July 2012 corresponding to the summer period in Lleida (Coma et al. 2016).
2.2. ABAQUS implementation
To compare the thermal performance of green roof system under constant inside temperature with that under variable inside temperature, ABAQUS software was employed as already used to model the building materials (Kazemi et al. 2020; Madandoust et al. 2017; Mohammadi et al. 2019; Roque et al. 2019; Yousefi Moghadam et al. 2017). Moreover, this finite element software has recently been proposed by researchers (Lei et al. 2019; Ting 2011) to evaluate the potential thermal distribution within green roof models. One of the advantages of this software is that the thermal distribution through different depths of green roof layers can be precisely assessed and the temperature value in each node of three-dimensional (3D) green roof models can be accurately obtained. This capability of ABAQUS software is useful once it is required to predict the temperature variation through different depths of green roof layers. In addition, the thermal parameters for modeling of green roof layers in ABAQUS software can be easily measured in lab-scale (Ting 2011; Lei et al. 2019). To reliably simulate the thermal performance of the green roof specimen made by Coma et al. (2016) and Pérez et al. (2012), the element sizes for the length and width of 3D green roof model were supposed to be equal to 8cm and 1 cm, respectively. In addition, the 3D hexahedral element, with 8 nodes and reduced integration (C3D8R) was used for mesh configuration in ABAQUS software (Fig. 5). The tie constraint between substrate and drainage layers was chosen to easily transfer the temperature through green roof model. The top of the green roof model (Fig. 5) was subjected to weather conditions
0 10 20 30 40 50 60 70 80 90 100 0 200 400 600 800 1000 1200 0 86400 172800 259200 345600 432000 518400
Solar radiation Outside temperature Outside humidity
Te m p e r atu r e ( °C ) H u m id ity (% ) S o lar r ad iati o n (W/ m 3) Time (s)
10
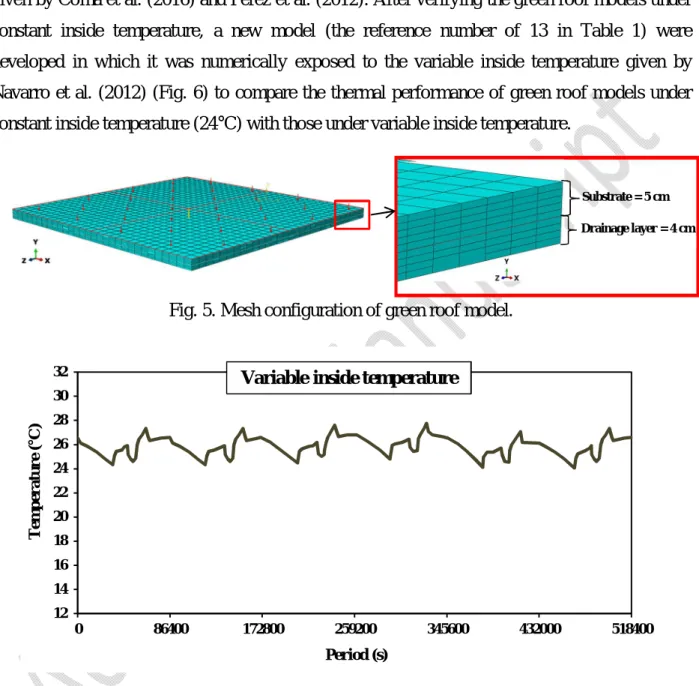
of Lleida on July 2011 (Fig. 2). In addition, the bottom of the green roof model was subjected to the constant inside temperature (24°C) and then they were validated by the experimental results given by Coma et al. (2016) and Pérez et al. (2012). After verifying the green roof models under constant inside temperature, a new model (the reference number of 13 in Table 1) were developed in which it was numerically exposed to the variable inside temperature given by Navarro et al. (2012) (Fig. 6) to compare the thermal performance of green roof models under constant inside temperature (24°C) with those under variable inside temperature.
Fig. 5. Mesh configuration of green roof model.
Fig. 6. Variable inside temperature (free floating temperature) for a 6-day period (518400 s) of summer in Lleida (Spain) (Navarro et al. 2012).
3. Validation of the simulation models
For the validation of models, the green roof model of GR-P-D5-S5 was subjected to the outside climate changes on July 2011 in Lleida (Fig. 2) and constant inside temperature (24 °C).
12 14 16 18 20 22 24 26 28 30 32 0 86400 172800 259200 345600 432000 518400 Period (s)
Variable inside temperature
Te m p e r atu r e ( °C ) Substrate = 5 cm Drainage layer = 4 cm
11
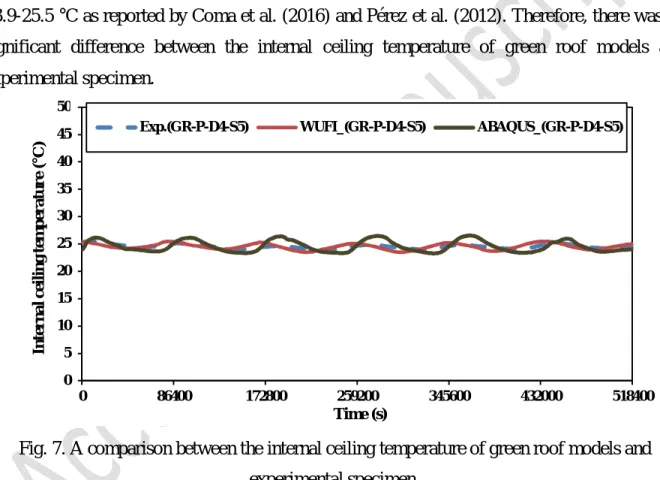
To achieve this goal, the internal ceiling temperature of green roof system built using the WUFI and ABAQUS software was compared with that of the house-like cubicles of green roof sample made by Coma et al. (2016) and Pérez et al. (2012) as presented in Fig. 7. It is noteworthy that the center and bottom of green roof models (Figs. 1(b) and 5) was considered to measure the internal ceiling temperature. As per the modeling outputs, the green roof models appeared to have the same fluctuation of internal ceiling temperature as obtained for the experimental specimen. In addition, the internal ceiling temperature for the green roof model in WUFI software was in the 23.5-25.5 °C range. The corresponding range for the green roof model in ABAQUS software was obtained 23.3-26.3 °C. This range in the experimental program was 23.9-25.5 °C as reported by Coma et al. (2016) and Pérez et al. (2012). Therefore, there was no significant difference between the internal ceiling temperature of green roof models and experimental specimen.
Fig. 7. A comparison between the internal ceiling temperature of green roof models and experimental specimen.
4. Results and discussions
4.1. Humidity and temperature distribution through the depth of green roof models
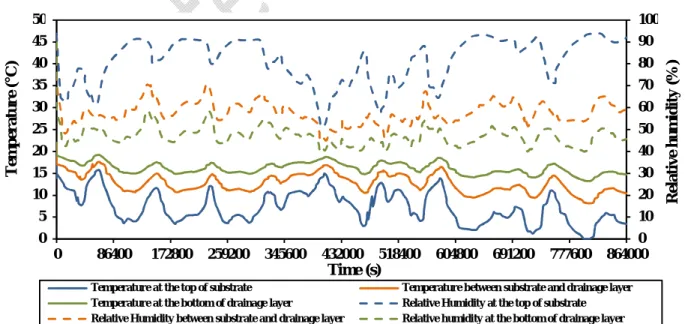
The humidity and temperature distribution in different depths of the GR-P-D4-S5 model particularly for the winter period is shown in Fig. 8. As per the modeling outputs, the relative humidity with the range of 51.31-93.89 % was obtained for the top of substrate. This range
0 5 10 15 20 25 30 35 40 45 50 0 86400 172800 259200 345600 432000 518400
Exp.(GR-P-D4-S5) WUFI_(GR-P-D4-S5) ABAQUS_(GR-P-D4-S5)
In te r n al c e il in g te m p e r atu r e ( °C ) Time (s)
12
appeared to be 44.98-70.74% between the substrate and drainage layer. The 39.83-58.7 % range was obtained for the bottom of the drainage layer, which was within the internal relative humidity range for comfort 30-70% as stated by Gilmore (1972). It can be stated that high retention capacity of pozzolana (porous volcanic gravel) and substrate led to decreasing the relative humidity from the top to the bottom of system.
As shown in Fig. 8, the 0-15.78 °C range of temperature was obtained for the top of substrate. The range of 8.12-17.64 °C was observed between the substrate and drainage layer. This range was found to be 13.28-19.21 °C for the bottom of drainage layer. Therefore, it can be concluded that high heat resistance of drainage layer of pozzolana and substrate (Coma et al. 2016, Dahanayake and Chow 2018) led to decreasing the thermal variation from the top to the bottom of system. As mentioned by Coma et al. (2016), the comfort temperature for the inside of the experimental cubicle of green roof was about 22 °C during the winter period and they used it as a set point for the experiments. The range of internal ceiling temperature of green roof (temperature at the bottom of drainage layer) was lower than the comfort temperature of 22 °C. That’s why the current design of green roof could not improve the insulation performance of extensive green roof as observed by Coma et al. (2016). In addition, since the outside air temperature was lower than the internal comfort temperature (22°C) during the winter period, the thermal transmittance of green roof increased, leading to higher energy consumption, similar to what Coma et al. (2016) concluded.
Fig. 8. The humidity and temperature distribution in different depths of the GR-P-D4-S5 model during the winter period.
0 10 20 30 40 50 60 70 80 90 100 0 5 10 15 20 25 30 35 40 45 50 0 86400 172800 259200 345600 432000 518400 604800 691200 777600 864000
Temperature at the top of substrate Temperature between substrate and drainage layer Temperature at the bottom of drainage layer Relative Humidity at the top of substrate Relative Humidity between substrate and drainage layer Relative humidity at the bottom of drainage layer
Te m p e r atu r e ( °C ) R e lati v e h u m id ity (% ) Time (s)
13
4.2. Effect of layers’ thickness on the insulation performance
4.2.1. Thickness of drainage layer (winter period)
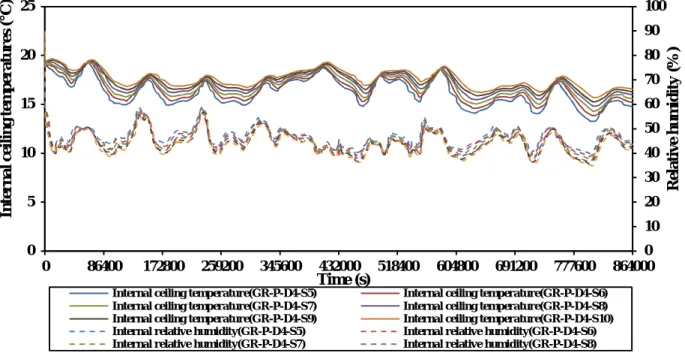
For the winter period, the humidity and temperature distribution in the GR-P-D4-S5 model with constant thickness of substrate (5cm) and different thicknesses of drainage layer is shown in Fig. 9. For the models with 4-, 5-, 6-, 7-, and 8-cm drainage layer, the internal relative humidity was in the range of 39.83-58.7%, 39.52-58.08%, 38.43-57.64%, 37.86-57.55%, and 37.12-56.55%, respectively. So, the difference between the maximum and minimum values of relative humidity decreased by increasing the thickness of drainage layer. In addition, the aforementioned internal relative humidity ranged from 37.12% to 58.7%, which was within the range of comfort relative humidity (30-70%) as determined by Gilmore (1972).
For the models with 4-, 5-, 6-, 7-, and 8-cm drainage layer, the range of internal ceiling temperature was 13.28-19.21 °C, 13.7-19.28 °C, 14.17-19.37 °C, 14.5-19.41 °C, and 14.8-19.49 °C, respectively. As per the results, increasing the thickness of drainage layer contributed to increasing the internal ceiling temperature and decreasing the fluctuation of temperature and subsequently improving the thermal resistance of system, owing to high diffusion properties and low bulk density of pozzolana as stated by Rincón et al. (2014) and Coma et al. (2016).
As shown in Fig. 9, the fluctuation of relative humidity and temperature for the model with 7-cm drainage layer of pozzolana (GR-P-D7-S5) was near to that for the model with 8-7-cm drainage layer of pozzolana (GR-P-D8-S5). So, the difference between the results of these two models was negligible. To apply lower load to the top of houses, researchers (Rincón et al. 2014; Sadeghian et al. 2020) have suggested to choose the roof with a lighter weight. Therefore, the system with 7-cm drainage layer of pozzolana (GR-P-D7-S5) can be considered as an optimum design of green roof to reduce the energy consumption of buildings in the construction sector, particularly during the winter period.
14
Fig. 9. The humidity and temperature distribution at the bottom of green roof with different thicknesses of drainage layer during the winter period.
4.2.2. Thickness of substrate (winter period)
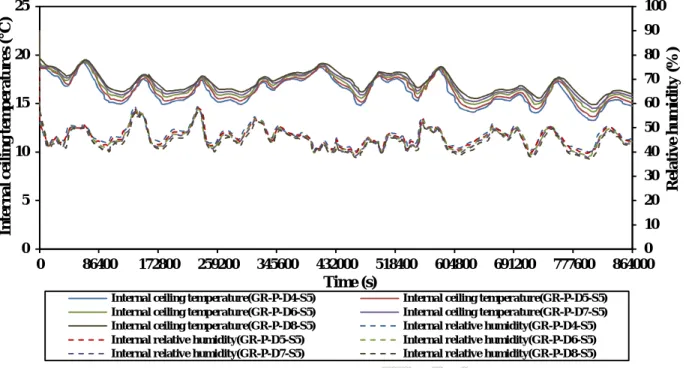
Fig. 10 shows the humidity and temperature distribution in the GR-P-D4-S5 model with constant thickness of drainage layer (4cm) and different thicknesses of substrate, particularly for the winter period. The range of relative humidity for the green roof with 5-, 6-, 7-, 8-, 9- and 10-cm substrate was 39.83-58.7%, 38.65-58.08%, 37.56-57.86%, 36.9-57.42%, 35.81-56.77%, and 35.15-55.89%, respectively, as shown in Fig. 10. The aforementioned internal relative humidity ranged from 37.56% to 58.7%, which was within the internal relative humidity range for comfort (30-70%).
According to Fig. 10, for the models with 5-, 6-, 7-, 8-, 9- and 10-cm substrate, the range of internal ceiling temperature was 13.28-19.21 °C, 13.84-19.29 °C, 14.33-19.22 °C, 14.84-19.43 °C, 15.3-19.52 °C, and 15.68-19.66 °C, respectively. The results showed that the difference between the maximum and minimum internal ceiling temperature decreased by increasing the thickness of substrate. This can be owing to high thermal mass generated by substrate at the top of drainage layer, similarly to what Lundholm et al. (2014) stated. However, there was no significant difference between the range of internal ceiling temperature for the green roof with 9-cm substrate and 10-9-cm substrate.
0 10 20 30 40 50 60 70 80 90 100 0 5 10 15 20 25 0 86400 172800 259200 345600 432000 518400 604800 691200 777600 864000
Internal ceiling temperature(GR-P-D4-S5) Internal ceiling temperature(GR-P-D5-S5) Internal ceiling temperature(GR-P-D6-S5) Internal ceiling temperature(GR-P-D7-S5) Internal ceiling temperature(GR-P-D8-S5) Internal relative humidity(GR-P-D4-S5) Internal relative humidity(GR-P-D5-S5) Internal relative humidity(GR-P-D6-S5) Internal relative humidity(GR-P-D7-S5) Internal relative humidity(GR-P-D8-S5)
R e lati v e h u m id ity (% ) Time (s) In te r n al c e il in g te m p e r atu r e s (° C )
15
The fluctuation of relative humidity and temperature for the model with 9-cm substrate (GR-P-D4-S9) was near to that for the model with 10-cm substrate (GR-P-D4-S10) as shown in Fig. 10. Therefore, the system with 9-cm substrate (GR-P-D4-S9) can be considered as an optimum design of green roof to reduce the energy demand of buildings for heating, particularly for the winter period.
Fig. 10. The humidity and temperature distribution at the bottom of green roof with different thicknesses of substrate during the winter period.
4.2.3. Thickness with constant ratio of substrate to drainage layer (winter and summer periods)
Figs. 11 and 12 show the humidity and temperature distribution at the bottom of green roof with constant thickness ratio of substrate to drainage layer corresponding to the winter and summer periods, respectively. During the winter period, for the systems namely GR-P-D4-S5, GR-P-D6-S8, and GR-P-D8-S10, the internal relative humidity was in the range of 39.83-58.7%, 35.81-56.33 %, and 34.06-54.37 %, respectively (Fig. 11). The corresponding ranges for the summer period were 44.96-74.6%, 44.88-70.49%, and 45.35-67.88%, respectively (Fig. 12). According to the results, the range of internal relative humidity of green roof models was within the range of comfort humidity (30-70%) either the models were for winter or summer period.
0 10 20 30 40 50 60 70 80 90 100 0 5 10 15 20 25 0 86400 172800 259200 345600 432000 518400 604800 691200 777600 864000
Internal ceiling temperature(GR-P-D4-S5) Internal ceiling temperature(GR-P-D4-S6) Internal ceiling temperature(GR-P-D4-S7) Internal ceiling temperature(GR-P-D4-S8) Internal ceiling temperature(GR-P-D4-S9) Internal ceiling temperature(GR-P-D4-S10) Internal relative humidity(GR-P-D4-S5) Internal relative humidity(GR-P-D4-S6) Internal relative humidity(GR-P-D4-S7) Internal relative humidity(GR-P-D4-S8)
Time (s) In te r n al c e il in g te m p e r atu r e s (° C ) R e lati v e h u m id ity (% )
16
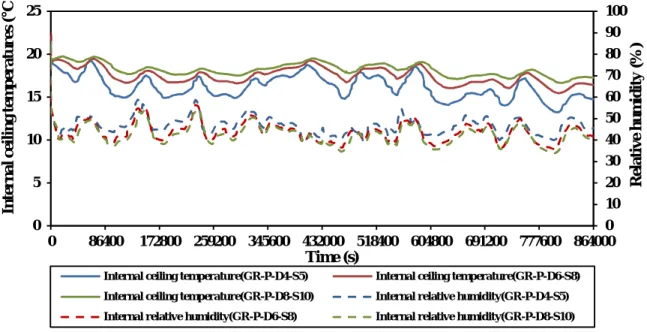
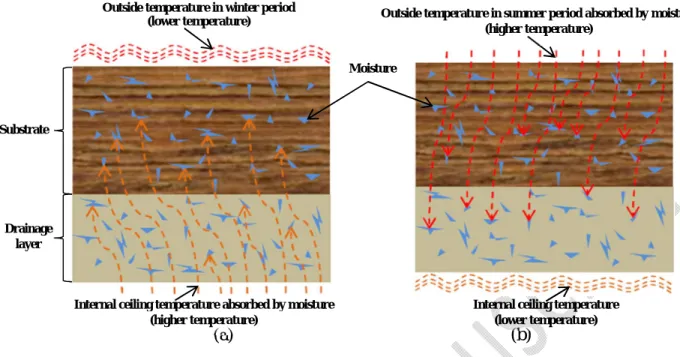
During the winter period, for the systems namely D4-S5, D6-S7.5, and GR-P-D8-S10, the range of internal ceiling temperature was 13.28-19.2 °C, 15.49-19.48 °C, and 16.68-19.74 °C, respectively (Fig. 11). The corresponding values for the summer period were obtained 21.12-26.86 °C, 21.76-26.06 °C, and 21.14-25.44 °C, respectively (Fig. 12). According to the results, it can be stated that increasing the thickness of substrate and drainage layers contributed to decreasing the fluctuation of internal ceiling temperature. Coma et al. (2016) proposed that the comfort temperature for the summer period was in the range of 23-26 °C. According to the ranges of internal ceiling temperature for the summer period (Fig. 12), there was no remarkable difference between the ranges of internal ceiling temperature of green roof models (Fig. 12) and that of comfort temperature for the summer period (23-26 °C). However, the internal ceiling temperature ranges of winter period (Fig. 11) were not within the range of comfort temperature (20-24 °C) assumed by Coma et al. (2016) for the cold period. So, the energy efficiency of buildings made with green roof during the summer period was found to be more than those during the winter period similar to what was stated by Dahanayake and Chow (2018). This can be due to the fact that the outside air temperature in the winter period was lower than the internal comfort temperature (22°C). This difference caused the moisture of substrate and drainage layers to absorb the internal ceiling temperature, leading to consuming higher energy, similar to what Coma et al. (2016) concluded (Fig. 13 (a)). However, the outside air temperature in the summer period was normally more than the internal comfort temperature (24°C). Therefore, the moisture of substrate and drainage layers absorbed the outside temperature to reach the stable temperature, leading to generating an thermal resistance layer in green roof system and keeping the internal ceiling temperature within the intended range as shown in Fig. 13 (b). That’s why the internal ceiling temperature ranges in the summer period (Fig. 12) were obtained within the comfort temperature (23-26 °C), while these ranges in the winter period (Fig. 11) were not within the comfort temperature (20-24 °C).
For the summer period, the results of green roof model with 8-cm substrate and 6-cm drainage layer of pozzolana (GR-P-D6-S8) were found to be the same as that with 10-cm substrate and 8-cm drainage layer of pozzolana (GR-P-D8-S10). Therefore, the 8-8-cm substrate and 6-8-cm drainage layer of pozzolana (GR-P-D6-S8) is introduced to be used in the building sector owing to its better thermal performance as well as its lower weight, which can be considered as an advantage from the structural point of view. However, for the winter period, the range of internal
17
ceiling temperature for the green roof model with 10-cm substrate and 8-cm drainage layer (16.68-19.74 °C) was the nearest range to the comfort temperature (20-24 °C) and therefore this model (GR-P-D8-S10) can be used to somewhat provide the comfort temperature for the inside of houses and buildings, particularly during the winter period.
Fig. 11. The humidity and temperature distribution at the bottom of green roof with constant thickness ratio of substrate to drainage layer during the winter period.
Fig. 12. The humidity and temperature distribution at the bottom of green roof with constant thickness ratio of substrate to drainage layer during the summer period.
0 10 20 30 40 50 60 70 80 90 100 0 5 10 15 20 25 0 86400 172800 259200 345600 432000 518400 604800 691200 777600 864000
Internal ceiling temperature(GR-P-D4-S5) Internal ceiling temperature(GR-P-D6-S8) Internal ceiling temperature(GR-P-D8-S10) Internal relative humidity(GR-P-D4-S5) Internal relative humidity(GR-P-D6-S8) Internal relative humidity(GR-P-D8-S10)
R e lati v e h u m id ity (% ) Time (s) In te r n al c e il in g te m p e r atu r e s (° C ) 0 10 20 30 40 50 60 70 80 20 22 24 26 28 30 32 34 36 0 86400 172800 259200 345600 432000 518400 Temperature_Analyt.(GR-P-D4-S5) Temperature_Analyt.(GR-P-D6-S8)
Temperature_Analyt.(GR-P-D8-S10) Relative humidity_Analyt.(GR-P-D4-S5) Relative humidity_Analyt.(GR-P-D6-S8) Relative humidity_Analyt.(GR-P-D8-S10)
R e lati v e h u m id ity (% ) Time (s) In te r n al c e il in g te m p e r atu r e s (° C )
18
(a) (b)
Fig. 13. Temperature transfer in green roof layers during winter period (a); and summer period (b).
4.3. Comparison of thermal performances under constant and variable inside temperatures
Navarro et al. (2012) measured the variable inside temperature (free floating temperature) for a 6-day period of summer in Lleida (Spain) as shown in Fig. 6. The green roof models were exposed to this variable inside temperature to assess the effect of free floating temperature on the thermal performance of substrate and drainage layers. The internal ceiling temperature fluctuation of models under variable inside temperature (GR-P-D4-S5-V) was compared to that under constant inside temperature (GR-P-D4-S5) as shown in Fig. 14. According to the results, the variable inside temperature increased the internal ceiling temperature fluctuation of green roof models. For instance, the maximum internal ceiling temperature of the green roof model with the pozzolana (29.45°C) was 25.3% more than its minimum internal ceiling temperature (23.5°C) under variable inside temperature. The corresponding difference for the same green roof model under constant inside temperature was obtained 13.9%. The contour plots of green roof models with pozzolana under variable inside temperature was compared to each other as seen in Fig. 15, when the maximum nodal temperature distribution was generated in 370000th s. According to the results, the green roof model was subjected to the constant inside temperature (Fig. 15(a)), the temperature at the top of the drainage layer (304.6 K) was 1.7% more than that
Outside temperature in winter period (lower temperature)
Moisture
Outside temperature in summer period absorbed by moisture (higher temperature)
Internal ceiling temperature absorbed by moisture (higher temperature)
Internal ceiling temperature (lower temperature) Substrate
Drainage layer
19
at the bottom of drainage layer (299.5 K). The corresponding difference for the green roof model under variable inside temperature (Fig. 15(b)) was 1.6%. It can be stated that the variation of temperature within the depth of the drainage layer under constant inside temperature was nearly the same as that under variable inside temperature. It can be due to more pores of pozzolana (Coma et al. 2016), leading to generating the air-voids in the drainage layer and improving its heat resistance against the variable inside temperature to prevent releasing the inside temperature into the outside of the building. Therefore, the drainage layer of pozzolana provided a suitable thermal resistance for the inside temperature of the houses; hence, the variable inside temperature couldn’t easily transfer to the outside of the building.
Fig. 14. Internal ceiling temperature in the green roofs exposed to constant and variable inside temperatures (°C). (a) 23 24 25 26 27 28 29 30 31 0 86400 172800 259200 345600 432000 518400 Analyt.(GR-P-D4-S5) Analyt.(GR-P-D4-S5-V) Time (s) In te r n al c e il in g te m p e r atu r e s (° C ) Substrate Pozzolana 320.2 K 304.6 K 299.5 K
20 (b)
Fig. 15. The highest thermal values in the green roofs under constant inside temperature (GR-P-D4-S5) (a); and under variable inside temperature (GR-P-D4-S5-V) (b); the unit in the legends
is K. 5. Conclusions
This work modeled and evaluated the humidity and temperature variations through the depth of the green roof systems with pozzolana as drainage layer subjected to constant and variable inside temperatures and exposed to the weather conditions of winter and summer. The main conclusions are:
The element sizes introduced to ABAQUS software and the fine gird chosen in WUFI software provided a suitable agreement between the internal ceiling temperature of green roof models and that of experimental specimens. Therefore, the modelling with WUFI and ABAQUS software realistically predicted the thermal performances observed on experimental cubicle specimens for the winter and summer periods. During the winter period, there was a decrease in temperature through the depth of the
green roof system, while the reverse occurred for the relative humidity. Furthermore, from the top to the bottom of green roof models, there was a decrease for the fluctuation of relative humidity and temperature.
For the winter period, the thermal resistance of green roof system increased either with increasing the thickness of drainage layer of pozzolana or substrate. In addition, the drainage layer of pozzolana with the thickness of 7 cm was recommended to be used for the green roof system, once the thickness of substrate was kept constant. Moreover, the substrate with the thickness of 9 cm was proposed to be used in the green roof system, once the thickness of drainage layer was kept constant.
There was a decrease in the fluctuation of internal ceiling temperature by simultaneously increasing the thickness of drainage layer and substrate. For the
Substrate Pozzolana
320.4 K 306 K 301.2 K
21
summer period, the green roof model with the 8-cm substrate and 6-cm drainage layer of pozzolana (GR-P-D6-S8) was adequate to provide the comfort temperature for the houses and buildings. For the winter period, it was required to use the green roof system with thicker layers including the 10-cm substrate and 8-cm drainage layer of pozzolana (GR-P-D8-S10) to achieve the nearest range of temperature to the comfort temperature of winter period. Therefore, the aforementioned green roof system (GR-P-D8-S10) can be practically employed as an optimum design of the green roof system either for the winter or for the summer period.
According to the results, the variable inside temperature increased the internal ceiling temperature fluctuation of green roof models. Under variable inside temperature, the maximum internal ceiling temperature of the green roof model with the pozzolana was 25.3% more than its minimum internal ceiling temperature (23.5°C). The corresponding difference for the same green roof model under constant inside temperature was 13.9%. Therefore, the internal ceiling temperature fluctuation of system under variable inside temperature was found to be higher than that under constant inside temperature.
The temperatures at the top of the drainage layers of pozzolana under variable inside temperature were found to be nearly the same as those under constant inside temperature, demonstrating high thermal resistance of pozzolana against the variable inside temperature.
Experimental approach has now to be developed in order to verify the accuracy of the model and its real sensitivity to physical characteristics of materials used for substrate and drainage layers. Other environmental conditions have also to be considered, specifically with more extreme lower temperatures.
Declaration of competing interest None.
Acknowledgement
This research was funded through the University of Liège (ULg) and ARC grant for Concerted Research Actions, financed by the French Community of Belgium, Wallonia-Brussels Federation (CityRoof project: Analogous green roofs for urban ecosystem services (2020-2023)).
22 References
Akbarzadeh Bengar, H., A.A., Shahmansouri, N., Akkas Zangebari Sabet, K., Kabirifar, W.Y.V., Tam. 2020. Impact of elevated temperatures on the structural performance of recycled rubber concrete: experimental and mathematical modeling. Construction and Building Materials 255: 119374.
Ascione, F., N., Bianco, F., de Rossi, G., Turni, G.P., Vanoli. 2013. Green roofs in European climates. Are effective solutions for the energy savings in air-conditioning. Applied Energy 104: 845–859.
AzariJafari, H., M., Shekarchi, J., Berenjian, B., Ahmad. 2015. Enhancing workability retention of concrete containing
natural zeolite by superplasticizers’ combination. Special Publication 302: 416–424.
Azizkhani, M., and J. Haberl. 2021. Assessment and discussion of the level of the application of passive/natural systems and daylighting systems by practitioners in the US. Science and Technology for the Built Environment 27 (2): 109– 128.
Bates, A.J., J.P. Sadler, R. Mackay. 2013. Vegetation development over four years on two green roofs in the UK. Urban
Forestry & Urban Greening 12: 98–108.
Bellazzi, A., B. Barozzi, M.C. Pollastro, and I. Meroni. 2020. Thermal resistance of growing media for green roofs: to what extent does the absence of specific reference values potentially affect the global thermal resistance of the green roof? An experimental example. Journal of Building Engineering 28: 101076.
Berardi, U., A. GhaffarianHoseini, and A. GhaffarianHoseini. 2014. State-of-the-art analysis of the environmental benefits of green roofs. Applied Energy 115: 411–428.
Berardi, U., P., La Rocheb, J.M., Almodovar. 2017. Water-to-air-heat exchanger and indirect evaporative cooling in buildings with green roofs. Energy and Buildings 151: 406–417.
Berndtsson, J.C., T. Emilsson, and L. Bengtsson. 2006. The influence of extensive vegetated roofs on runoff water quality.
Science of the Total Environment 355 (1-3): 48–63.
Cascone, S., F. Catania, A. Gagliano, and G. Sciuto. 2018. A comprehensive study on green roof performance for retrofitting existing buildings. Building and Environment 136: 227–239.
Castleton, H.F.,V., Stovin, S.B.M., Beck, J.B., Davison. 2010. Green roofs; building energy savings and the potential for retrofit. Energy and Buildings 42(10): 1582–1591.
Coma, J., G. Pérez, A. Castell, C. Solé, and L.F. Cabeza. 2014. Green roofs as passive system for energy savings in
buildings during the cooling period: use of rubber crumbs as drainage layer. Energy Efficiency 7(5): 841 – 849. Coma, J., G. Pérez, C. Solé, A. Castell, and L.F. Cabeza. 2016. Thermal assessment of extensive green roofs as passive
tool for energy savings in buildings. Renewable Energy 85(11): 1106–1115.
Courard, L., F. Michel, and P. Delhez. 2010. Use of concrete road recycled aggregates for roller compacted concrete.
Construction and Building Materials 24(3): 390–395.
Culligan, P.J. 2019. Green infrastructure and urban sustainability: A discussion of recent advances and future challenges based on multiyear observations in New York City. Science and Technology for the Built Environment 25(9): 1113– 1120.
Dahanayake, K.C., and C.L. Chow. 2019. Comparing reduction of building cooling load through green roofs and green walls by EnergyPlus simulations. Building Simulation 11: 421–434.
D’Orazio, M., C., Di Perna, E., Di. (2012). Giuseppe Green roof yearly performance: A case study in a highly insulated building under temperate climate. Energy and Buildings 55: 439–451.
Gilmore, C.P. 1972. More comfort for your heating dollar, Popular Science: 99.
Jahandari, S., M.M. Toufigh, J. Li, and M. Saberian. 2017. Laboratory study of the effect of degrees of saturation on lime concrete resistance due to the groundwater level increment. Geotechnical and Geological Engineering 36 (1): 413– 424.
Jim, C.Y. 2014. Air-conditioning energy consumption due to green roofs with different building thermal insulation.
Applied Energy 128: 49–59.
Kazemi, M., J. Li, S.L. Harehdasht, N. Yousefieh, S. Jahandari, and M. Saberian. 2020. Non-linear behaviour of concrete beams reinforced with GFRP and CFRP bars grouted in sleeves. Structures 23: 87–102.
Kazemi, M., M. Hajforoush, P. Khakpour Talebi, M. Daneshfar, A. Shokrgozar, S. Jahandari, M. Saberian, J. Li. 2020. In-situ strength estimation of polypropylene fibre reinforced recycled aggregate concrete using Schmidt rebound hammer
and point load test. Journal of Sustainable Cement-Based Materials 9(5): 289–306.
Kumar, R., and S.C. Kaushik. 2005. Performance evaluation of green roof and shading for thermal protection of buildings.
Building and Environment 40: 1505–1511.
La Roche, P., U., Berardi. 2014. Comfort and energy savings with active green roofs, Energy and Buildings 82: 492–504. Lazzarin, R.M., F., Castellotti, F., Busato. 2005. Experimental measurements and numerical modelling of a green roof.
Energy and Buildings 37(12): 1260–1267.
Lei, K.-T., J.-S. Tang, and P.-H. Chen. 2019. Numerical simulation and experiments with green roofs for increasing indoor thermal comfort. Journal of the Chinese Institute of Engineers 42(4): 346-356.
23
Lundholm, J.T., B.M. Weddle, and J.S. MacIvor. 2014. Snow depth and vegetation type affect green roof thermal performance in winter. Energy and Buildings 84: 299–307.
Madandoust, R., M., Kazemi, S., Yousefi Moghadam. 2017. Analytical study on tensile strength of concrete. Romanian
Journal of Materials 2(2): 204–209.
Mickovski, S.B., K., Buss, B.M., McKenzie, B., Sökmener. 2013. Laboratory study on the potential use of recycled inert construction waste material in the substrate mix for extensive green roofs. Ecological Engineering 61: 706–714. Mohammadi, M., M.A., Kafi, A., Kheyroddin, H.R. Ronagh. 2019. Experimental and numerical investigation of an
innovative buckling-restrained fuse under cyclic loading. Structures 22: 186–199.
Mukherjee, S., P. La Roche, K. Konis, J.H. Choi. 2013. Thermal performance of greenroofs: a parametric study through energy modeling in different climates. Passive Low Energy Architecture Conference (PLEA), Munich, Germany. Nardini, A., M., Andri, S., Crasso. 2012. Influence of substrate depth and vegetation type on temperature and water runoff
mitigation by extensive green roofs: shrubsversus herbaceous plants. Urban Ecosystem 15: 697–708.
Navarro, L., A.D. Garcia, C. Solé, A. Castell, and L.F. Cabeza. 2012. Thermal loads inside buildings with phase change materials: experimental results, Energy Procedia 20: 342–349.
Nematzadeh, M., A.A., Shahmansouri, M., Fakoor. 2020. Post-fire compressive strength of recycled PET aggregate concrete reinforced with steel fibers: Optimization and prediction via RSM and GEP. Construction and Building
Materials, 252: 119057.
Ngan, G. 2004. Green roof policies: Tools for encouraging sustainable design. Landscape Architecture Canada
Foundation 2–49.
Niachou, A., K. Papakonstantinou, M. Santamouris, A., Tsangrassoulis, G. Mihalakakou. 2001. Analysis of the green roof thermal properties and investigation of its energy performance. Energy and Buildings 33(7): 719–729.
Nore, K., A.Q. Nyrud, D. Kraniotis, K.R. Skulberg, F. Englund, and T. Aurlien. 2017. Moisture buffering, energy potential, and volatile organic compound emissions of wood exposed to indoor environments. Science and Technology
for the Built Environment 23 (3): 512–521.
Oberndorfer, E., J. Lundholm, B. Bass, R.R. Coffman, H. Doshi, N. Dunnett, S. Gaffin, M. Kohler, K.K.Y. Liu, and B. Rowe. 2007. Green roofs as urban ecosystems: ecological structures, functions, and services. BioScience 57 (10): 823-833.
Palla, A., I. Gnecco, and L.G. Lanza. 2009. Unsaturated 2D modelling of subsurface water flow in the coarse-grained porous matrix of a green roof, Journal of Hydrology 379(1-2): 193–204.
Parizotto, S., R. Lamberts. 2011. Investigation of green roof thermal performance in temperate climate: A case study of an experimental building in Florianópolis city, Southern Brazil. Energy and Buildings 43(7): 1712–1722.
Pérez, G., A. Vila, L. Rincón, C. Solé, and L.F. Cabeza. 2012. Use of rubber crumbs as drainage layer in green roofs as potential energy improvement material. Applied Energy 67: 347–354.
Pérez, G., J. Coma, C. Solé, A. Castell, and L.F. Cabeza. 2012. Green roofs as passive system for energy savings when using rubber crumbs as drainage layer. Energy Procedia 30: 452–460.
Qin, X., X., Wu, Y.M., Chiew, Y., Li. 2012. A green roof test bed for stormwater management and reduction of urban heat island effect in Singapore. British Journal of Environment & Climate Change 2(4): 410–420.
Rincón, L., J. Coma, G. Pérez, A. Castell, D. Boer, and L.F. Cabeza. 2014. Environmental performance of recycled rubber as drainage layer in extensive green roofs. A comparative life cycle assessment. Building and Environment 74: 22–30. Roque, E., P. Santos, and A.C. Pereira. 2019. Thermal and sound insulation of lightweight steel-framed façade walls.
Science and Technology for the Built Environment 25: 156–176.
Saadatian, O., K. Sopian, E. Salleh, C.H. Lim, S. Riffat, E. Saadatian, A. Toudeshki, and M.Y. Sulaiman. 2013. A review of energy aspects of green roofs. Renewable & Sustainable Energy Reviews 23: 155–168.
Saberian, M., J., Li, D., Cameron. 2019a. Effect of crushed glass on behavior of crushed recycled pavement materials together with crumb rubber for making a clean green base and subbase. Journal of Materials in Civil Engineering 31 (7), 04019108.
Sadeghian, F., A., Haddad, S., Jahandari, H., Rasekh, T., Ozbakkaloglu. 2020. Effects of electrokinetic phenomena on the load-bearing capacity of different steel and concrete piles: A small-scale experimental study Canadian Geotechnical
Journal 1-16.
Salo, J., P. Huttunen, J. Vinha, and T. Keskikuru. 2018. Numerical study of time-dependent hygrothermal conditions in depressurized crawl space. Building Simulation 11: 1067–1081.
Shahmansouri, A.A., H., Akbarzadeh Bengar, H., AzariJafari. 2021. Life cycle assessment of eco-friendly concrete
mixtures incorporating natural zeolite in sulfate-aggressive environment. Construction and Building Materials 268
(25): 1-14.
Simmons, M.T., B., Gardiner, S., Windhager, J., Tinsley. 2008. Green roofs are not created equal: the hydrologic and thermal performance of six different extensive green roofs and reflective and non-reflective roofs in a sub-tropical climate. Urban Ecosystems 11(4): 339–348.
Stovin, V., Poë, S. De-Ville, and C. Berretta. 2015. The influence of substrate and vegetation configuration on green roof hydrological performance. Ecological Engineering 85: 159–172.
24
Tabares-Velasco, P.C., M. Zhao, N. Peterson, J. Srebric, and R. Berghage. 2012. Validation of predictive heat and mass transfer green roof model with extensive green roof field data. Ecological Engineering 47: 165–173.
Tam, V.W.Y., J., Wang, K.N., Le. 2016. Thermal insulation and cost effectiveness of green-roof systems: An empirical study in Hong Kong. Building and Environment 110: 46–54.
Ting, M.-H. 2011. Numerical simulation of the general insulation material in the application of increasing indoor thermal comfort. [Master Thesis, Department of Civil Engineering, National Taiwan University]. (In Chinese).
Tommasi, P., L. Verrucci, and T. Rotonda. 2015. Mechanical properties of a weak pyroclastic rock and their relationship with microstructure. Canadian Geotechnical Journal 52(2): 211–223.
Uhl, M., and L. Schiedt. 2008. Green roof storm water retention –monitoring results. In: 11th International Conference on
Urban Drainage, Edinburgh, Scotland, UK, 31/ 8-5/9.
Vijayaraghavan, K.U., U.M. Joshi, and R. Balasubramanian. 2012. A field study to evaluate runoff quality from green roofs. Water Research 46: 1337–1345.
Vila, A., G., Pérez, C., Solé, A.I., Fernández, L.F., Cabeza. 2012. Use of rubber crumbs as drainage layer in experimental green roofs. Building and Environment 48: 101–106.
Yousefi Moghadam, S., R., Madandoust, M.M. Ranjbar, M., Kazemi. 2017. Analytical study on the behavior of corrosion-damaged reinforced concrete beams strengthen with FRP. Romanian Journal of Materials 47(4): 514–521.
Wanielista, M., M. Kelly, and M. Hardin. 2008. A comparative analysis of green roof designs including depth of media, drainage layer materials, and pollution control media; Florida Department of Environmental Protection: Tallahassee, FL, USA.
Wong, N.H., D.K.W., Cheong, H., Yan, J., Soh, C.L., Ong, A. Sia. 2003. The effects of rooftop garden on energy consumption of a commercial building in Singapore. Energy and Buildings 35: 353–364.
![[PDF] Architecture J2EE support de cours complet de A a Z | Cours j2ee](data:image/gif;base64,R0lGODlhAQABAIAAAP///wAAACH5BAEAAAAALAAAAAABAAEAAAICRAEAOw==)