www.elsevier.com/locate/pocean
Short-term variations of the partial pressure of CO
2in
surface waters of the Galician upwelling system
Alberto V. Borges
*, Michel Frankignoulle
Universite´ de Lie`ge, Me´canique des Fluides Ge´ophysiques, Unite´ d’Oce´anographie Chimique, Institut de Physique B5, B4000 Sart Tilman, Belgium
Abstract
The partial pressure of CO2(pCO2) and dissolved oxygen saturation level (%O2) were monitored continuously during
a cruise in August 1998, which sampled surface waters off the Galician coast. Data are presented from two Lagrangian experiments carried out in an upwelling on the continental shelf and in the core of an offshore filament. The data show that daily variations in surface pCO2 and oxygen (%O2) were controlled by the diurnal cycle of primary
production/respiration, temperature variations and air–sea exchange. Data obtained during various shelf and cross-filament transects are also discussed and give an insight into the processes controlling large-scale variations of pCO2
and %O2in the Galician upwelling system. These data suggest that upwelling filaments are an important feature of
the inorganic carbon cycle of upwelling systems. However more field data in the various eastern boundary current systems worldwide are needed.2001 Elsevier Science Ltd. All rights reserved.
Contents
1. Introduction . . . 284
2. Material and methods . . . 285
3. Results and discussion . . . 286
3.1. Experimental setting . . . 286
3.2. Cross-shelf transect . . . 287
3.3. First Lagrangian experiment in an upwelling over the continental shelf . . . 288
3.4. Second Lagrangian experiment in a upwelling filament . . . 291
3.4.1. Simulated evolution of pCO2and O2 . . . 291
3.4.2. Coupling of the evolution of pCO2and biological activity . . . 292
3.5. Cross-filament transects . . . 296
3.6. Air–sea exchange of CO2 . . . 297
* Corresponding author. Fax:+32-4-366-23-55.
E-mail address: alberto.borges@ulg.ac.be (A.V. Borges).
0079-6611/01/$ - see front matter2001 Elsevier Science Ltd. All rights reserved. PII: S 0 0 7 9 - 6 6 1 1 ( 0 1 ) 0 0 0 7 1 - 4
4. Conclusions . . . 299 Acknowledgements . . . 299 References . . . 300
1. Introduction
Since Walsh, Rowe, Iverson and McRoy (1981) suggested that continental shelves and slopes could be significant sinks for atmospheric CO2, several research programmes have been devoted to the study of
cross-shelf exchange processes. These include, SEEP I and SEEP II in the Mid Atlantic Bight (Walsh, Biscay, & Csanady, 1988; Biscaye, Flagg, & Falkowski, 1994), ECOMARGE in the Gulf of Lions (Monaco, Biscaye, Soyer, Pocklington, & Heussner, 1990), KEEP in the East China Sea (Wong, Chao, Li, & Shiah, 2000), ECOFER and OMEX I in the Bay of Biscay (Monaco, Biscaye, & Laborde, 1999; Wollast & Chou, 2001). Wollast (1998) summarised the sediment trap results from some of these experiments and concluded that the export of sinking organic matter from the shelf to deep waters of the slope accounts for ⱕ 10% of the primary production over the shelf break. Moreover, the preservation of organic matter in the slope sediments accounts for ⬍1% of the shelf break primary production. Thus, the continental slopes studied so far have not proved to be major carbon depocenters, although the transfer of organic matter into the deep waters of the continental slope can be considered as a sink of CO2 over a time scale of苲1000 years,
i.e. the required time for the ventilation of the deep ocean (Wollast, 1993). Although marginal continental
shelves are net exporters of organic carbon (see e.g. Gattuso, Frankignoulle, & Wollast, 1998), their role in the dissolved inorganic carbon cycle (in particular with respect to air–sea exchange of CO2) is uncertain
because it depends on the integration of a number of processes: (a) Production, degradation and export of organic carbon, (b) Production, dissolution and export of carbonates,
(c) Inputs of dissolved inorganic carbon by complex vertical mixing processes at the shelf edge, and (d) Seawater temperature variations and water mass mixing.
An alternative to indirect budgeting calculations is the estimation of air–sea fluxes from direct measure-ments of the gradient of CO2 across the air–sea interface, since these integrate all the relevant physical
and biogeochemical processes. This approach has been applied in the East China Sea (Tsunogai, Watan-abe, & Sato, 1999; Wang, Chen, Hong, & Chung, 2000) and the Bay of Biscay (Frankignoulle & Borges, 2001). In both these regions, the net annual integrated air–sea fluxes ranged from⫺3 to ⫺8 mmol m⫺2.d⫺1, thus confirming that marginal continental shelves at mid-latitudes are significant sinks of atmospheric CO2.
However, estimation of large-scale spatial distribution of dissolved inorganic carbon in coastal seas is still needed before the air–sea flux of CO2can be integrated at a global scale. The proximal continental shelves
that are directly influenced by terrestrial inputs are known to be net heterotrophic systems (Smith & Mack-enzie, 1987; Smith & Hollibaugh, 1993; Gattuso et al., 1998) and are significant sources of atmospheric CO2based on direct measurements of the gradient of CO2across the air–sea interface (Kempe, 1982; Cai &
Wang, 1998; Frankignoulle et al., 1998; Borges & Frankignoulle, 1999).
Investigation of the major processes that control spatio–temporal patterns of surface water pCO2 is an
important first step to develop models that can accurately describe dissolved inorganic carbon dynamics in these complex systems. Studies of short-term (daily to weekly) variations can give very useful infor-mation on physical and biological forcing of dissolved inorganic carbon dynamics as has been seen in
open ocean systems by Oudot and Andrie´ (1989); Chipman, Marra and Takahashi (1993); Robertson, Watson, Langdon, Ling and Wood (1993); Goyet and Peltzer (1997) and Bates, Takahashi, Chipman and Knap (1998). In coastal areas, dissolved inorganic carbon data from fixed stations have been successfully correlated to biological processes in areas of relatively low physical forcing, such as seagrass beds and coral reefs (Frankignoulle & Bouquegneau, 1990; Frankignoulle et al., 1996). However, in dynamic coastal areas, dissolved inorganic carbon data sets from fixed stations are difficult to interpret because of the influence of the various physical forcing processes (tidal or residual advection of different water masses, water mass mixing, etc.) on dissolved inorganic carbon dynamics are just as important as biological forcing and acts at the same time (Friederich, Brewer, Herlien, & Chavez, 1995; DeGrandpre, Hammar, Wallace, & Wirick, 1997; Bakker, de Baar, & de Wilde, 1996; DeGrandpre, Hammar, & Wirick, 1998; Borges & Frankignoulle, 1999). Lagrangian drift experiments permit focussing on biological forcing and minimise the influence of the physical forcing on dissolved inorganic carbon dynamics. Lagrangian studies of dis-solved inorganic carbon have only been reported in open ocean systems: the northern North Atlantic (Robertson & Watson, 1993; Robertson et al., 1993) and the eastern Tropical Atlantic (Oudot & Andrie´, 1989).
Coastal upwelling areas may be sites of intense transfer of organic carbon across the shelf edge. Indeed, these regions support a disproportionate fraction (11% of 7.2 GtC.year⫺1) of new primary production in the global ocean in relation to their relative surface area (⬍1% of 360.106 km2, Alongi, 1997). Also, in
some areas such as the Galician coast, during upwelling events there is inhibition of the slope current, which restrains shelf/shelf break/open ocean exchanges (e.g. Huthnance, 1995; Pingree, Sinha, & Griffiths, 1999). Finally, in coastal upwelling regions such as the Galician coast, filaments of upwelled water are frequently observed advecting surface water, together with its enhanced content of organic carbon (both as dissolved and suspended particulate organic carbon), offshore from the continental shelf into the adjacent oceanic waters (A´ lvarez-Salgado et al., 2001 and references therein).
However, air–sea exchanges of CO2in coastal upwelling systems are particularly complex because they
are the result of processes that have antagonistic effects on the surface pCO2 values. Upwelling brings to
the surface of the continental shelf deep water, which is over-saturated in CO2. Conversely, the high rates
of primary production fuelled by higher nutrient concentrations in the upwelled water lowers pCO2(Watson,
1995). In addition, the warming of upwelled water increases pCO2 values by modifying the chemical
equilibria of the inorganic carbon system. The complexity of these interactions may contribute to the large range of values of surface water pCO2that have been reported in some coastal upwelling areas (Simpson &
Zirino, 1980; Simpson, 1984; Copin-Monte´gut & Raimbault, 1994; Copin-Monte´gut & Avril, 1995; Ko¨rtz-inger, Duinker, & Mintrop, 1997; Boehme, Sabine, & Reimers, 1998; Goyet et al., 1998; Lefe`vre, Moore, Aiken, Watson, & Cooper, 1998; Rutllant, Fuenzalida, Torres, & Figueroa, 1998; Bakker, de Baar, & de Jong, 1999; Pe´rez, Rı´os, & Ro´son, 1999; Torres, Turner, Silva, & Rutllant, 1999; Van Green et al., 2000). For instance, Simpson and Zirino (1980) report pCO2values ranging from 140 to 980µatm in the Peruvian
upwelling area.
In this study, we report on the dissolved inorganic carbon data collected during two Lagrangian experi-ments and various cross-shelf and cross-filament transects, carried out at the Galician margin as a contri-bution to the understanding of air–sea exchange of CO2dynamics in the framework of the OMEX II (Ocean
Margin EXchange) project.
2. Material and methods
Data presented in this paper were obtained in August 1998, on board the RRS Charles Darwin (cruise CD114, 29 July–24 August). Underway parameters (pCO2, dissolved oxygen, salinity, water temperature
(pump inlet at a depth of 2.5 m). A non-dispersive infrared gas analyser (Li-cor, LI-6262) was used to measure pCO2 in wet air equilibrated with seawater. The Li-cor was calibrated daily using two gas
standards of 0µatm (nitrogen, Air Liquide Belgium) and 360.5µatm (National Oceanic and Atmospheric Administration). The equilibrator consisted of a Plexiglas cylinder (height: 80cm, diameter: 10cm) filled with glass spheres (marbles) to increase the exchange surface area. Seawater ran (3 l.min⫺1) from the top to the bottom of the equilibrator and air was pumped upwards (3 l.min⫺1). The temperature at the outlet of the equilibrator was monitored using a platinum resistance thermometer (Metrohm). The pCO2values
were corrected for the temperature difference between in situ seawater and water in the equilibrator, using the algorithm proposed by Copin-Monte´gut (1988). The offset in temperature varied between 0.1° and 0.5°C. More details on equilibration technique and quality control can be found in Frankignoulle, Borges and Biondo (2001). A second Li-corwas used to measure atmospheric pCO2 sampled at the bow of the
ship at a height of approximately 10m above the sea surface. Underway dissolved oxygen was measured using a galvanic electrode (Kent) calibrated every 12 hours from discrete samples that were measured by the Winkler method using a potentiometric end-point determination. The concentration of O2 at
satu-ration was calculated using the algorithm proposed by Benson and Krause (1984). Two parameters that involve the observed concentration of dissolved O2 (O2 obs) and the concentration of O2 at saturation (O2 sat) were computed: O2 saturation level (%O2) =O2obs/O2sat*100 and Apparent Oxygen Utilisation (AOU) =O2sat⫺ O2obs(inµmol.kg⫺1). Salinity and in situ temperature were measured using a Falmouth Scientific
Instruments thermosalinograph. Underway fluorescence was measured with a Wet Star (WS35-246) fluorometer.
Vertical profile data were obtained from samples collected by a 24 bottle rosette coupled to a SeaBird CTD. Total Alkalinity (TAlk) was determined using the classical Gran electro-titration method, on 100ml unfiltered samples. Total Alkalinity calculation was made with corrections for fluoride and sulphate accord-ing to Hansson and Jagner (1973). The reproducibility of TAlk measurements performed on board was 2µeq.kg⫺1(standard deviation from the difference of a set of 30 duplicate measurements during the cruise). Dissolved inorganic carbon (DIC) was computed from the measurements of underway pCO2 and TAlk
with the dissociation constants of carbonic acid from Roy et al. (1993), the borate molality obtained from the Culkin (1965) ratio to salinity and the dissociation constant of boric acid from Dickson (1990).
3. Results and discussion
3.1. Experimental setting
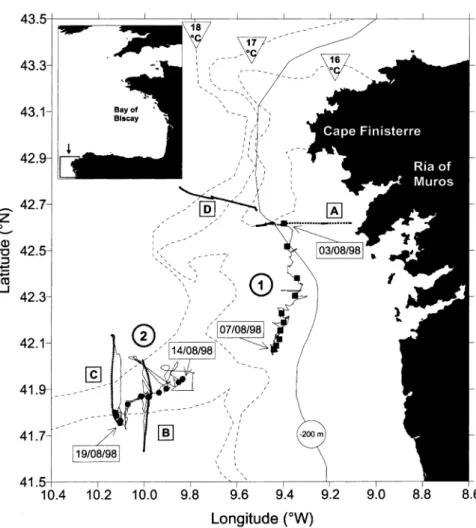
Fig. 1 shows the position of CTD stations and ship track during the two Lagrangian experiments carried out off the Galician coast in August 1998. A drifting buoy for in situ primary production incubations was used as a water mass marker. During the second Lagrangian experiment the behaviour of this drifting buoy was compared with mixed layer Argos drifters drogued at 15m depth. This showed that the drifting buoy from PML was an efficient water mass marker (Joint et al., 2001a; Barton, Inall, Sherwin, & Torres, 2001). The first Lagrangian experiment started over the continental shelf on 3 August (42.62°N, 9.40°W) and the drifter moved southwards until 7 August (42.07°N, 9.44°W) when the experiment ended. The second Lag-rangian experiment started in the core of a recently developed upwelling filament (i.e. offshore extension of upwelled water) on 14 August (41.95°N, 9.83°W) and the drifter moved south-westwards until 18 August (41.80°N, 10.13°W) and then slowly turned inshore and crossed the southern boundary of the upwelling filament. The experiment ended on 19 August (41.76°N, 10.10°W). Details on the hydrodynamics during the two Lagrangian experiments and SST satellite images that describe the development and behaviour of the upwelling filament can be found respectively in Barton et al. (2001) and Smyth, Miller, Groom and Lavender (2001).
Fig. 1. Study site and position of sampling stations of the two Lagrangian experiments (3 August 1998, 0330 UT – 7 August 1998, 1310 UT and 14 August 1998, 0240 UT – 19 August 1998, 0415 UT). The solid line indicates the ship track. The dashed lines correspond approximately to 16, 17 and 18°C isotherms extracted from SST satellite image of 18 August courtesy of NERC-PML Remote Sensing Group in Plymouth. The dotted lines indicate four transects (A: 2 August; B: 15–16 August; C: 18–19 August; D: 19 August) shown in Fig. 2 and Fig. 7.
3.2. Cross-shelf transect
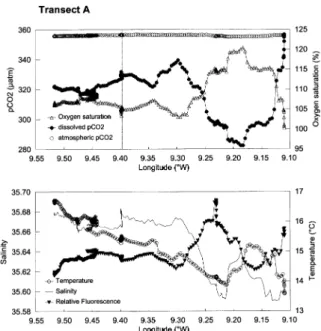
Fig. 2 shows the distribution of underway parameters along a cross-shelf transect carried out on 2 August 1998 along parallel 42.61°N (see Fig. 1, line A). Close to the coast (9.1°W), the distribution of temperature shows that pCO2 and dissolved oxygen concentration (O2) were at saturation as a result of the upwelling.
From the coast to 9.3°W, significant CO2 undersaturation was observed, probably as a result of biological
activity since it was accompanied by an increase in the %O2. Further confirmation comes from in situ
fluorescence, which is an indicator of chlorophyll concentration. Unfortunately, signal drift of the fluoro-meter and the low frequency of chlorophyll sampling did not allow accurate calibration of the fluorofluoro-meter. However, as shown in Fig. 2, fluorescence is a useful parameter in the interpretation of pCO2distribution,
so the raw data are shown here, and in other figures, as relative fluorescence (no units). From 9.3°W to 9.6°W (shelf break), the pCO2 was below the atmospheric value and relatively stable. The variations in
Fig. 2. Distribution of underway parameters (seawater pCO2(µatm), atmospheric pCO2(µatm), dissolved oxygen saturation level (%), temperature (°C), salinity and relative fluorescence (no units)) along a cross-shelf transect, along parallel 42.61°N, carried out on 2 August. The dotted line indicates the position of deployment of the drifter for the first Lagrangian experiment in the upwelling. The position of transect A is shown in Fig. 1.
was being influenced by outflows from the Rı´a of Muros. Indeed, the outwelling from the Rı´as (i.e. outflow onto the shelf of water that has upwelled within the Rı´as and then has been mixed to a small extent with fresh water) has been described as an important influence in the chemistry and biology of the inner shelf of the Galician coast (e.g. A´ lvarez-Salgado, Doval, & Pe´rez, 1999, and references therein). In Fig. 2, the vertical dotted line indicates the deployment site of the drifter at the start of the first Lagrangian experiment.
3.3. First Lagrangian experiment in an upwelling over the continental shelf
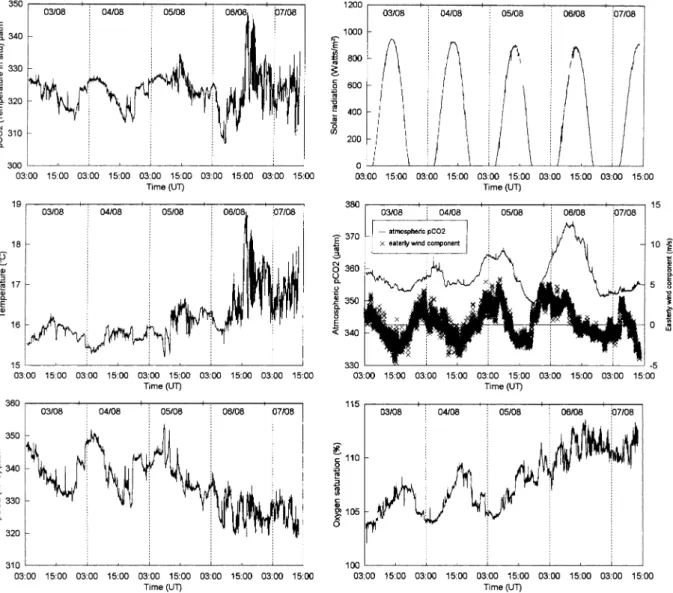
Fig. 3 shows the evolution of underway parameters during the first Lagrangian experiment (see Fig. 1, line 1). The evolution of pCO2 during the last two days shows high frequency variations that followed
temperature changes. These variations result from the effect of temperature on equilibrium constants of dissolved inorganic carbon and, in particular, on the solubility coefficient of CO2 (an increase in pCO2 of
苲4% for every°C increase in temperature). The high frequency temperature variations (up to 1.3°C in one minute) resulted from either vertical or horizontal gradients. During the last two days of the experiment, the wind speed decreased. As a result intense stratification developed in the upper layer, which contrasted with the vertical structure during the first two days, when temperature had been homogeneous throughout the mixed layer. The temperature gradient between 苲1m and 10m depth was 0°C for the first CTD cast and 1.5°C for last CTD cast of the experiment (see also Fig. 7 of Joint et al., 2001a). The high frequency of the temperature and pCO2 variations can be explained by the seawater supply inlet (at 2.5m depth)
oscillating through a vertical gradient. During the first two days of the experiment, seawater temperature evolved in a periodic way that followed the signal of solar radiation and was a result of the daily cycle of heat exchange. In the open ocean, this phenomenon is the primary source of daily scale variations in pCO2, through the effect of temperature on the CO2 solubility coefficient; examples include Goyet and
Fig. 3. Evolution of underway parameters (seawater pCO2(µatm) at in situ temperature, temperature (°C), seawater pCO2normalised to 17°C (µatm), dissolved oxygen saturation level (%), solar radiation (watts m⫺2), atmospheric pCO
2(µatm), easterly wind speed component (m.s⫺1)) during the first Lagrangian experiment (3 August, 0330 UT – 7 August, 1310 UT).
these effects of temperature, so that we could focus on the potential biological factors affecting pCO2, we
have computed pCO2 values at an average temperature of 17°C. This approach has been widely used in
the interpretation of pCO2data at daily scale (e.g. Oudot & Andrie´, 1989; Robertson et al., 1993; Yamashita,
Fujiwara, Liu, & Ohtaki, 1993). The variation of pCO2 (17°C) was smoother than the variation of pCO2
at in situ temperature and throughout the experiment there was a general trend for pCO2to decrease. This
decrease of pCO2 (17°C) was correlated with an increase in the %O2, suggesting a relationship with the
net ecosystem production within the mixed layer. It is also apparent that both pCO2 (17°C) and %O2
showed a diel periodicity for the first two days and tended to stabilise during the last two days. The periodicity of the signal of pCO2 (17°C) and %O2 could be attributed to the daily cycle of
dusk. There was a time lag between the daily maximum of solar radiation and the daily maximum of %O2;
this could be attributed to net autotrophy lasting until dusk whereas community respiration dominated the signal at night. The absence of a periodical signal in pCO2(17°C) and %O2 variations during the last two
days of the experiment may have had two causes. Firstly, the decline in the nutrient concentrations in the upper water column and the shift of the maximum phytoplanktonic biomass from the surface to 30m (Joint et al., 2001a; Joint, Rees, & Woodward, 2001b). Secondly, as the upper water column became intensely stratified, the daily oscillation between net community primary production and respiration could still occurred but at the maximum of phytoplanktonic biomass, where it would not have affected pCO2and O2
values in the upper water column.
On the basis of daily variations of pCO2during a Lagrangian experiment in the northern North Atlantic
Ocean, Chipman et al. (1993) computed primary production rates that were consistent with14C
incorpor-ation estimates. The requirement for such computincorpor-ations is that the mixed layer is relatively well defined and that it remains relatively constant throughout the experiment (see also Robertson et al., 1993). During the first Lagrangian experiment off the Galician coast, the mixed layer was only clearly defined during the first two days, although it shifted from about 20m to 45m in 24h. During the last three days of the experi-ment, the mixed layer was very shallow (⬍10m) as a result of intense surface stratification (see Fig. 7 of Joint et al., 2001a). Under such conditions, it is difficult to compare in a meaningful way, the temporal evolution of dissolved inorganic carbon with estimates of biological activity. However, such a comparison was possible for the second Lagrangian experiment.
Significant variations in atmospheric pCO2 were observed (349–375 µatm) that closely followed the
wind direction, showing that different air masses (offshore and continental origin) were sampled during the experiment. Higher atmospheric pCO2values were associated with winds with a strong easterly
compo-nent (i.e. blowing from the conticompo-nent) and lower values to winds with a strong westerly compocompo-nent. Various authors have shown that air masses with a continental origin consistently have a CO2content that is higher
by 苲30µatm, than that of offshore air masses (Friederich et al., 1995; Bakker et al., 1996; Ko¨rtzinger et al., 1996). These variations in atmospheric pCO2 are larger than those reported between air masses from
open oceanic regions (⬍10µatm, Oudot & Andrie´, 1989; Bates et al., 1998).
What was the effect of air–sea exchange on the observed pCO2and O2 variations? The CO2air–sea flux
(F) can be computed from the air–sea gradient (⌬pCO2) and the gas exchange coefficient (K) using the
equation F = α.K.⌬pCO2, where α is the solubility coefficient of CO2. The value of the gas exchange
coefficient is a function of various processes, such as wind speed, turbulence at the interface, air bubbles, surface films, etc. However, wind speed is recognised as the main forcing factor on the K value and several algorithms to derive K from wind speed have been proposed. In our calculations, we have applied the two most commonly used algorithms proposed by Liss and Merlivat (1986) and by Wanninkhof (1992). Air– sea flux of CO2 directly affects DIC, and to compute this effect on pCO2 we have used the homogeneous
buffer factor β, defined by (⌬pCO2/pCO2)*(DIC/⌬DIC), that relates a variation of DIC to a variation of
pCO2and vice versa. The value ofβis a function of the inorganic carbon species, which induce the DIC
change and is about 10 for dissolved CO2 (air–sea exchange).
We computed by iteration (1 minute time-step) for a range of wind speeds, the variation over one day of pCO2 in the mixed layer caused by air–sea exchange. We used the following initial conditions: mixed
layer 22m deep, salinity =35.7, temperature =15.5°C, dissolved pCO2 =326 µatm, atmospheric pCO2 =358µatm, β =10, DIC=2056µmol.kg⫺1 (calculated from a measured TAlk of 2342 µeq.kg⫺1). We esti-mated using the Liss and Merlivat (1986) gas exchange coefficient, that there were increases in pCO2 of
0.1, 0.3 and 0.7µatm per day for wind speeds of 5, 10 and 15m.s⫺1 respectively. Using the Wanninkhof (1992) gas exchange coefficient, the estimated increases in pCO2 were 0.1, 0.5 and 1.2µatm per day for
wind speeds of 5, 10 and 15 m.s⫺1 respectively. As expected, the effect on air–sea exchange is relatively small compared to the observed variations (苲30µatm). O2 air–sea flux was also calculated with the gas
extreme observed values: 252.6 and 263.8µmol.kg⫺1(respectively 103.5 and 112.3% of saturation at 15.5° and 17.7°C). Considering a mixed layer 22m deep and an initial O2concentration of 252.6µmol.kg⫺1, we
compute a decrease of 0.4, 1.4 and 2.7µmol.kg⫺1(0.2, 0.6 and 1.1% of saturation) per day, for wind speeds of 5, 10 and 15 m s⫺1respectively. For an initial O2concentration of 263.8µmol.kg⫺1, the decrease of O2
concentration is 1.3, 5.1 and 9.5 µmol.kg⫺1 (0.6, 2.2 and 4.1% of saturation) per day for wind speeds of 5, 10 and 15 m.s⫺1. The decrease of %O2related to air-sea exchange during the first Lagrangian experiment
is estimated to be 苲1% of saturation per day since the highest wind speeds (5–15m.s⫺1) coincided with the lower gradients of O2, whereas the lower wind speeds (苲5 m.s⫺1) coincided with the higher gradients
of O2. These variations are relatively important compared to the observed variation of %O2 (苲8%) but do
not change our interpretation of the data, since the observed signal integrates both air–sea exchange and biological activity.
3.4. Second Lagrangian experiment in a upwelling filament
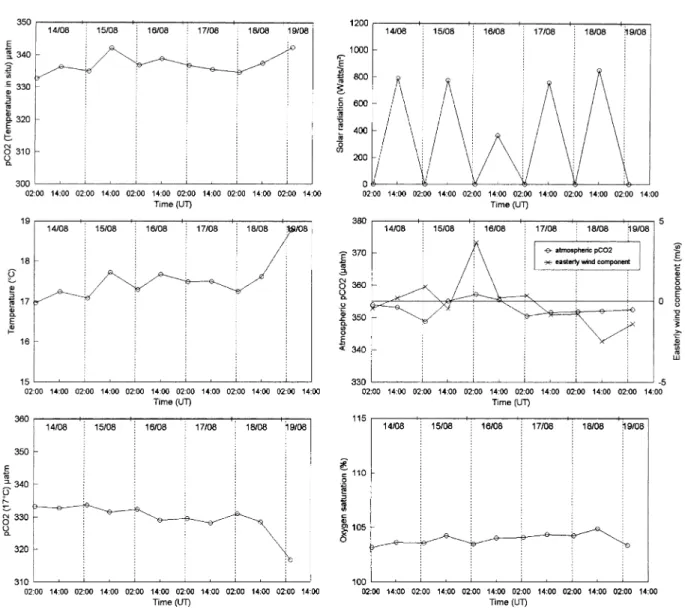
Fig. 4 shows the evolution of underway parameters during the second Lagrangian experiment in an offshore filament (Fig. 1, line 2). The stability of pCO2(17°C) and %O2values throughout this experiment
suggested biological activity was low in the surface layer. The surface layer was depleted in nutrients and phytoplanktonic biomass was about 4 times lower and primary production was 3 times lower than observed during the first Lagrangian experiment (Joint et al., 2001a,b). The phytoplankton biomass was throughout concentrated at the nutricline, which coincided with the thermocline (A´ lvarez-Salgado et al., 2001; Joint et al., 2001a,b). Heterotrophic activity was also lower during the second Lagrangian experiment; Barbosa et al. (2001) found bacterial production and growth rates were lower, although the bacterial biomass was similar. In addition, Fileman and Burkill (2001) found that both the biomass and the herbivory of hetero-trophic microzooplankton were lower in the filament than during the upwelling experiment.
During the second Lagrangian experiment, the variations in atmospheric pCO2were much smaller (349–
357µatm) than in the first experiment, and the relationship with wind direction was not so clear; i.e. the effect of the continental air mass was smaller. This is to be expected since the second experiment was carried out further offshore.
3.4.1. Simulated evolution of pCO2 and O2
To confirm that the evolution of pCO2 and %O2 in surface waters was largely unrelated to biological
activity, we computed by iteration (1 minute time step) the evolution of surface %O2 and pCO2, taking
into account only air–sea exchange and the evolution of temperature and mixed layer depth. The calculation was made from the start of the experiment until the evening station on 16 August (Julian day 231.6). The last station was excluded from the analysis because it exhibited characteristics of offshore water (warm, O2 and pCO2 closer to saturation) after the drifter had crossed the southern boundary of the upwelling
filament. Initial values were 244.7µmol.kg⫺1for O2, 333µatm for pCO2, at 16.96°C and a salinity of 35.73.
Figure 5 shows the interpolated evolution of the mixed layer depth, wind speed and temperature. Computed O2, %O2 and pCO2 values show excellent agreement with the first 6 observed values (from Julian day
227.1 to 229.6). This suggests that, for this time span, the effect of biological activity on pCO2 and %O2
was insignificant. The variation of %O2 depended on temperature change and air–sea exchange. That the
variation of pCO2 was mainly controlled by temperature is shown by the small difference between the
calculated evolution of pCO2, taking into account air–sea exchange, and the calculated evolution based
only on temperature change. The last four observations deviate from the calculated values and the trend suggests the influence of primary production (increase of %O2 and decrease of pCO2).
However, we must determine if the increase of primary production was real or whether it resulted from a poor tracking of the water mass, for example if the drifter had progressively moved into another, more productive, water mass. As mentioned above, the drifter crossed the filament boundary and the steady
Fig. 4. Evolution of underway parameters — seawater pCO2(µatm) at in situ temperature, temperature (°C), seawater pCO2 normal-ised to 17°C (µatm), dissolved oxygen saturation level (%), solar radiation (watts.m⫺2), atmospheric pCO
2 (µatm), easterly wind speed component (m.s⫺1) — during the second Lagrangian experiment which took place in the offshore filament (14 August, 0240 UT – 19 August, 0415 UT).
decrease of the mixed layer depth from Julian day 230.1 shows that the drifter had moved into the boundary of the filament. Indeed, Barton et al. (2001) show the deepening of the isotherms at the filament boundaries. The cross-filament transects discussed in Section 3.5 also show lower pCO2values and higher %O2values
at the filament boundaries. We can assume that the deviation of calculated pCO2 and %O2from observed
values in the last two days of the second Lagrangian experiment were related to the progressive drift into a different water mass rather than a change of primary production rate within the water mass.
3.4.2. Coupling of the evolution of pCO2 and biological activity
For the CTD stations where primary production and heterotrophic respiration were measured, the daily variation of pCO2from each biological process has been computed. Table 1 shows the rates obtained within
Fig. 5. Calculated seawater pCO2(µatm), dissolved oxygen concentration (µmol.kg⫺1) and dissolved oxygen saturation (%) incorpor-ating air–sea exchange, the evolution of the mixed layer depth (m) and temperature (°C) in the second Lagrangian experiment. Solid lines correspond to interpolated data in the case of mixed layer depth, temperature and wind speed (m.s⫺1) and to calculated values
in the case of seawater pCO2, dissolved oxygen concentration and dissolved oxygen saturation level. Open and filled circles correspond to observations. CO2air–sea fluxes were calculated according Liss and Merlivat (1986), (labelled L&M) and Wanninkhof (1992), (labelled W). Evolution of seawater pCO2calculated from temperature alone is noted ‘temp’. Oxygen air–sea fluxes were calculated according to Liss and Merlivat (1986).
the mixed layer (for details refer to Barbosa et al., 2001; Fileman & Burkill, 2001; Halvorsen, Hirst, Batten, Tande, & Lampitt, 2001; Joint et al., 2001b). The effect on daily variations of pCO2 resulting from air–
sea exchange was also computed, as in Section 3.3, using the Wanninkhof (1992) exchange coefficient. The input of DIC across the thermocline was computed using the vertical eddy diffusivity of 0.01cm2.s⫺1 reported for the core of the upwelling filament by Barton et al. (2001), the thickness the thermocline defined between 15°and 17°C (Barton et al., 2001), and a DIC value at 15°C of 2085µmol.kg⫺1(based on vertical profile data, not shown).
Table 1 shows that, during the first three days of the second Lagrangian experiment, primary production induced, daily variations of pCO2 in the mixed layer ranging between⫺1.4 and ⫺0.8µatm.d⫺1. If the data
pro-Table 1 Biological rates (mmolC.m ⫺ 2.d ⫺ 1) determined on water samples taken within the mixed layer at dawn in the offshore fi lament and daily variation o f pCO 2 ( µ atm.d ⫺ 1) in the m ixed layer resulting from biological and p hysical processes (see text for details of computations) Daily biological rates (mmolC.m ⫺ 2.d ⫺ 1) D aily change of surface water pCO 2 ( µ atm.d ⫺ 1) Julian day Primary Bacterial Micro-M acro-Primary Bacterial Micro- Macro-Air-sea Vertical N et production a respiration b zooplankton zooplankton production respiration zooplankton zooplankton exchange eddy respiration c respiration d respiration respiration diffusion 227.1 2 6.2 6.2 8.1 0.6 ⫺ 1.40 + 0.33 + 0.43 + 0.03 + 0.16 + 0.01 ⴚ 0.43 228.1 1 1.7 3.9 7.8 0.1 ⫺ 0.96 + 0.32 + 0.64 + 0.01 + 0.09 + 0.01 + 0.11 229.1 1 7.9 7.1 9.2 0.5 ⫺ 0.83 + 0.33 + 0.42 + 0.02 + 0.06 + 0.01 + 0.01 230.1 2 1.8 6.2 1 3.2 0.3 ⫺ 1.14 + 0.33 + 0.69 + 0.02 + 0.28 + 0.01 + 0.18 a Joint et al. (2001b). b Barbosa et al. (2001). c Fileman & Burkill (2001). d Halvorsen et al. (2001).
duction minus autotrophic respiration), then to obtain the net biological effect on the daily variation of pCO2, we must account for total heterotrophic respiration. The largest contribution of heterotrophic
respir-ation to the daily varirespir-ation of pCO2 within the mixed layer was from micro-zooplankton (range +0.6 to +0.4µatm.d⫺1), followed by bacteria (+0.3µatm.d⫺1), while the contribution from macro-zooplankton was one order of magnitude lower. Among the physical processes, only the input from air–sea exchange is significant in comparison with heterotrophic respiration. The net effect of both biological and physical processes on the daily variation of pCO2within the mixed layer varied from+0.1 to⫺0.4µatm.d⫺1. These
variations are one to two orders of magnitude lower than those from the effect of temperature on pCO2
(10µatm), that we computed in Section 3.4.1 (see Fig. 5), confirming our first interpretation that biological processes were not significantly affecting daily variations of pCO2 during the second Lagrangian
experi-ment.
We also computed the increase of primary production rate that would be needed to account for the difference of 3.4µatm between simulated and observed pCO2values on Julian day 230.1 (see Fig. 5). This
corresponds to a difference in DIC of 22µmol.kg⫺1 that can theoretically be accounted for by an increase of net primary production of about 72mmolC.m⫺2.d⫺1in a mixed layer of 32m, assuming that total hetero-trophic respiration remains constant. Table 1 shows that the observed increase of daily net primary pro-duction between Julian days 229.1 and 230.1 was one order of magnitude lower (about 4mmolC.m⫺2.d⫺1), and that total heterotrophic respiration remained relatively constant. This confirms our first interpretation in Section 3.4.1 that the shift between observed and computed pCO2 values was not related to major
changes in biological activity but the result of the buoy’s drift into a water mass with a different pCO2
signature (i.e. through the filament boundary).
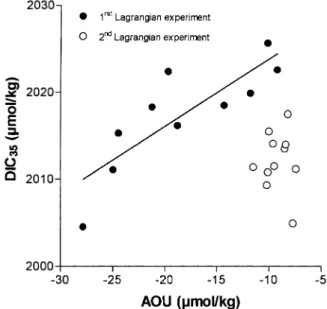
Fig. 6 shows the plot of DIC normalised to a salinity of 35 (DIC35) versus the Apparent Oxygen
Utilis-ation (AOU) for the two Lagrangian experiments. Data from the first Lagrangian experiment are relatively well correlated considering the small range of variation; the slope of the regression line (0.78±0.18 SE), is in good agreement with the Redfield ratio of 0.77 (i.e. 138O2:106CO2). However, considering the extent
Fig. 6. Plot of Dissolved Inorganic Carbon normalised to salinity 35 (DIC35– µmol.kg⫺1) versus Apparent Oxygen Utilisation (AOU –µmol.kg⫺1) for data obtained during the two Lagrangian experiments at the CTD stations where Total Alkalinity was sampled in subsurface water (⫺5 to ⫺10 m depth). The straight line corresponds to the regression line of DIC35versus AOU for the first Lagrangian experiment: DIC35=2031 (±4SE)+0.78 (±0.18SE)*AOU (r2=0.695, n=10).
to which surface O2 values were affected by air sea exchange we will not discuss the significance of this
ratio. For the second Lagrangian experiment, data are not well correlated and the AOU values were closer to saturation for the lower range of DIC35than for the first experiment. This suggests that during the history
of the water mass, air–sea exchange increased AOU values but had less influence on DIC35. Also, the
relatively low pCO2 and DIC35values observed during the second Lagrangian experiment were a
conse-quence of the history of the water mass and not of the relatively low primary production within the filament at the time of sampling.
This apparent paradox of low primary production associated with relatively important under-saturation of CO2 is because air–sea exchange is a slow process compared to biological activity. Indeed, using the
initial conditions of the second Lagrangian experiment, it would take about 26 and 41 months for mixed layer to come to atmospheric equilibrium using, respectively, the Wanninkhof (1992) and the Liss and Merlivat (1986) exchange coefficients. Biological activity can generate pCO2 gradients on much shorter
time scales.
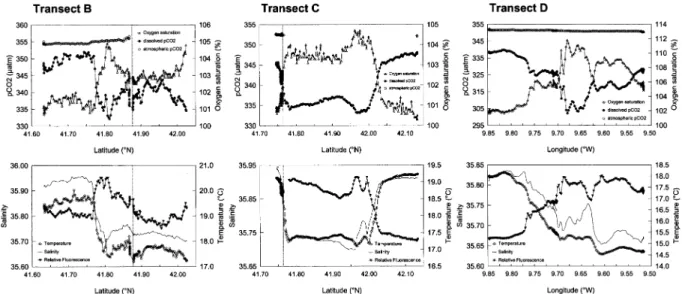
3.5. Cross-filament transects
Fig. 7 shows the distribution of underway parameters along two sections across the upwelling filament (lines B and C in Fig. 1) and one section across another upwelling filament that developed further north at the end of the cruise (line D in Fig. 1). Salinity and temperature data show that transect B crossed the southern boundary of the filament. The saltier and warmer offshore water had pCO2 and O2 values closer
to saturation than the cooler and less salty water of the filament. Close to the southern boundary (苲41.80°N), pCO2values decreased, probably as a result of biological activity, as shown by the increase of %O2, this
is confirmed by the changes in relative fluorescence. Transect C crossed both the southern and northern boundaries of the filament, and increases of %O2and fluorescence and a decrease of pCO2, were observed
close to the northern boundary of the filament (41.95° to 42.00°N). In the second upwelling filament
Fig. 7. Distribution of underway parameters (seawater pCO2 (µatm), atmospheric CO2(µatm), dissolved oxygen saturation level (%), temperature (°C), salinity, relative fluorescence (no units)) along two sections across the upwelling filament studied during the second Lagrangian experiment; transects B and C (shown in Fig. 1) sampled on 15–16 and 18–19 August 1998. Transect D (shown in Fig. 1) is a cross-filament transect from the shelf edge through the core of recently formed upwelling filament, carried out on 19 August 1998. The vertical dotted line indicates the position of the drifter during transects B and C. On transects B and C, the atmospheric pCO2signal was strongly contaminated by exhaust fumes from the ship so only a fraction of the data is shown.
sampled along transect D, the patterns in pCO2 and %O2distribution are similar to the filament described
above. The offshore warmer and saltier waters showed pCO2and O2 values closer to saturation, and there
was a contrast in pCO2 and %O2 distributions between the filament’s boundary and its core.
Barton et al. (2001) show intensification of the flow at the filament boundaries (10 to 30cm.s⫺1) as opposed to the weak flow (⬍5cm.s⫺1) observed at the core of the filament. This suggests that the differences in pCO2 and %O2 distributions between the filament core and boundary were related to the age of the
water mass. The boundary flow was bringing water that had been upwelled more recently and was thus biologically more active than the older water in the slow moving filament core. Barton et al. (2001) also show there was an increase in the turbulence and a deepening of the isotherms at the filament boundaries. This was probably advecting nutrients to the filament boundary which was stimulating primary production and contributing to the lowering of pCO2 values.
3.6. Air–sea exchange of CO2
Fig. 8 shows computed air–sea fluxes of CO2for the two Lagrangian experiments and the four transects.
The magnitude of the air–sea fluxes are quite different depending on the gas exchange coefficient used, and the differences increased with wind speed. For instance, for transect B, sampled at a time of low wind speed, the largest difference between the flux calculated according to Liss and Merlivat (1986) and Wannin-khof (1992) is 苲0.1mmol.m⫺2.d⫺1; for transect D (high wind speeds), the difference is 苲10mmol.m⫺2.d⫺1 — an increase of苲100%. The sign of air–sea flux is imposed by the air–sea gradient of pCO2, but the amplitude largely depends on wind speed. This is clear if we compare transects B and
C that show air–sea gradients of pCO2of the same other of magnitude; however, for transect C the computed
flux is 760% higher because wind speeds were 苲5 times higher. When the air–sea gradient of pCO2 is
relatively stable and wind speed highly variable, the variations in fluxes mainly follow the wind speed variations as in the case of these two Lagrangian experiments. Only when almost constant wind speeds are observed, for instance during transects A, C and D, does the flux follow the air–sea gradient of pCO2.
For the first Lagrangian experiment, we recomputed the air–sea flux with an average atmospheric pCO2
(358 µatm) and leaving all other parameters unchanged, and then compared it with data computed with the observed variation in atmospheric pCO2. The largest difference between the two computations is 苲1
mmol m⫺1day⫺1using the Liss and Merlivat (1986) algorithm and苲2 mmol m⫺1day⫺1using the Wannink-hof (1992) algorithm. These differences are relatively important compared to the range of variation of the computed flux and emphasise the need to measure both seawater and atmospheric pCO2 in coastal areas.
From the above considerations, it is clear that the air–sea fluxes computed from immediate wind speed measurements are not representative of net CO2 air–sea exchange within upwelling filaments during the
upwelling season. Indeed, the wind speed field is highly variable on the time scale of a week while the pCO2field can remain fairly stable. This is illustrated by the second Lagrangian experiment, when relatively
small variations of pCO2 were related to the presence of different water masses rather than to variations
of biological activity. We have also computed air–sea fluxes of CO2 for the entire inorganic carbon data
set obtained in the area over a 3 year period during OMEX II. The full results will be published later. But to summarise briefly, air–sea fluxes were calculated from 3 hourly wind speed averages observed during the duration of each cruise (苲10 days). This integrative approach depends on a series of assumptions, but most probably gives more representative CO2air–sea exchange values than those computed from immediate
wind speed measurements. Upwelling filaments were also sampled during two other cruises in June/July 1998 and September 1999. The integrated pCO2 air–sea gradient within the various observed upwelling
filaments varied between⫺15 and ⫺28µatm. The integrated CO2air–sea fluxes within upwelling filaments
for each of the three cruises were always negative ranging between ⫺0.4 and ⫺4.5mmol.m⫺2.d⫺1 using the Liss and Merlivat (1986) exchange coefficient, and between⫺0.8 and ⫺9.0 mmol.m⫺2.d⫺1 using the Wanninkhof (1992) exchange coefficient. The CO2air–sea fluxes within the filaments in comparison with
Fig. 8. Calculated CO2air–sea fluxes (mmol.m⫺2.d⫺1) according to Liss and Merlivat (1986) and Wanninkhof (1992), labelled L& M and W, wind speed (m.s⫺1) and air–sea gradient of pCO2(µatm) for the two Lagrangian experiments and the four cross-shelf and cross-filament transects.
offshore waters were systematically stronger, between 38 and 66% depending on the cruise and for both exchange coefficients. For the data obtained over the continental shelf at the end of the August 1998 cruise (data not shown), we computed the region was acting as a net sink for atmospheric CO2 (⫺1.8 and
⫺3.2mmol.m⫺2.d⫺1respectively for the Liss and Merlivat (1986) and the Wanninkhof (1992) formulations of the CO2exchange coefficient). This was also the case during the other OMEX II cruises carried out in
the area (July 1997, July 1998 and September 1999—Borges and Frankignoulle, 2001) and thus contradicts the belief that all coastal upwelling areas act as sources of atmospheric CO2 by analogy to equatorial
upwelling areas.
4. Conclusions
For the period and area sampled, daily variations of surface pCO2 and %O2in these Lagrangian
experi-ments, were smaller than the larger scale variations in the cross-shelf and cross-filament transects. The large-scale variations were related to differences in water masses (offshore/coastal), physical processes (upwelling and outwelling from the Rı´as) and net primary production. The daily variations of surface pCO2
and %O2 depended on the daily cycle of primary production and respiration in recently upwelled water
where the maximum of phytoplankton biomass was located in the upper water layer. During periods of intense stratification, the pCO2signal was strongly modulated by temperature variations; it was not possible
to relate pCO2 and %O2 variations to primary production because the upper surface waters were isolated
by stratification from the maximum of phytoplankton biomass. In aged water masses (i.e. a nutrient depleted mixed layer), the relatively small daily variations of surface %O2 were exclusively related to temperature
variations and air–sea exchange, while surface pCO2was mainly controlled by temperature alone. Our data
also suggest that the observed CO2 undersaturation in the core of the upwelling filament was a historical
water mass signal and was not related to the contemporary net primary production in the filament itself. The water at the filament boundaries, however, seemed to be more biologically active than the water in the filament core. Undersaturation of CO2, associated with large CO2 invasion, was observed in both the
filaments sampled. Integrated air–sea CO2 fluxes in upwelling filaments off the Galician coast based on
the present cruise and other two cruises, ranged between⫺0.4 and ⫺9.0mmol.m⫺2.d⫺1 depending on the cruise and the exchange coefficient used in the computations. Thus, in spite of the fact that upwelling filaments off the Galician coast seem to be oligotrophic and relatively unproductive systems, they act as a net sink for atmospheric CO2that is stronger than in the surrounding offshore waters. We feel that these
data cannot be extrapolated to filaments worldwide because of the high variability of pCO2values reported
in the literature for various upwelling systems. However, in all eastern boundary current regions worldwide, filaments persist for long periods and extend over very large areas (several hundreds of kilometres by tens of kilometres wide). More dissolved inorganic carbon field data are needed to estimate the potential impor-tance of these structures in the carbon cycle of upwelling systems.
Acknowledgements
We would like to thank R.V.S. (U.K.), for providing thermosalinograph, fluorometer and meteorological data, the officers and crew of RSS Charles Darwin for helpful collaboration, Renzo Biondo and Emile Libert (ULg, Belgium) for technical assistance, Jake Loncar and Alison Fairclough (BODC, U.K.) for data
management, colleagues involved in Work Package I of OMEX II for fruitful discussions and sharing data and two anonymous referees for pertinent comments that improved the quality of a previous version of the manuscript. This work was funded by the European Commission (OMEX II project, MAST programme, contract MAS3-CT97-0076). Alberto Vieira Borges is a PhD student with a grant from the Fonds pour la Formation a` la Recherche dans l’Industrie et l’Agriculture (Belgium) and Michel Frankignoulle is a research associate at the Fonds National de la Recherche Scientifique (Belgium).
References
Alongi, D. M. (1997). Coastal ecosystem processes. CRC Press.
A´ lvarez-Salgado, X. A., Doval, M. D., & Pe´rez, F. F. (1999). Dissolved organic matter in shelf waters off the Rı´a de Vigo (NW Iberian upwelling system). Journal of Marine Systems, 18, 383–394.
A´ lvarez-Salgado, X. A., Doval, M.D., Borges, A. V., Joint, I., Frankignoulle, M., Woodward, E. M. S., & Figueiras, F. G. (2001). Off-shelf fluxes of labile materials by an upwelling filament in the NW Iberian upwelling system. Progress in Oceanography, 51 (2-4), 321–337.
Bakker, D. C. E., de Baar, H. J. W., & de Wilde, H. P. J. (1996). Dissolved carbon dioxide in Dutch coastal waters. Marine Chemistry,
55, 247–263.
Bakker, D. C. E., de Baar, H. J. W., & de Jong, E. (1999). The dependence on temperature and salinity of dissolved inorganic carbon in the East Atlantic surface waters. Marine Chemistry, 65, 263–280.
Barbosa, A. B., Galva˜o, H. M., Mendes, P. A., A´ lvarez-Salgado, X. A, Figueiras, F. G., & Joint, I. (2001). Short term variability of heterotrophic bacterioplankton during upwelling off the NW Iberian margin. Progress in Oceanography, 51 (2-4), 339–359. Barton, E. D., Inall, M., Sherwin, T. J., & Torres, R. (2001). Vertical structure, turbulent mixing and fluxes during Lagrangian
observations of an upwelling filament system off Northwest Iberia. Progress in Oceanography, 51 (2-4), 249–267.
Bates, N. R., Takahashi, T., Chipman, D. W., & Knap, A. H. (1998). Variability of pCO2 on diel to seasonal timescales in the Sargasso Sea near Bermuda. Journal of Geophysical Research, 103(C8), 15567–15585.
Benson, B. B., & Krause, D. (1984). The concentration and isotopic fractionation of oxygen dissolved in freshwater and seawater in equilibrium with the atmosphere. Limnology and Oceanography, 29, 620–632.
Biscaye, P. E., Flagg, C. N., & Falkowski, P. G. (1994). The Shelf Edge Exchange Processes experiment, SEEP-II: an introduction to hypotheses, results and conclusions. Deep-Sea Research II, 41, 231–252.
Boehme, S. E., Sabine, C. L., & Reimers, C. E. (1998). CO2fluxes from a coastal transect: a time series approach. Marine Chemistry, 63, 49–67.
Borges, A. V., & Frankignoulle, M. (1999). Daily and seasonal variations of the partial pressure of CO2in surface seawater along the Belgian and southern Dutch coastal areas. Journal of Marine Systems, 19, 251–266.
Borges, A. V., & Frankignoulle, M. (2001). Distribution of surface carbon dioxide and air-sea exchange in the upwelling system off the Galician coast. Global Biogeochemical Cycles, submitted.
Cai, W.-J., & Wang, Y. (1998). The chemistry, fluxes, and source of carbon dioxide in the estuarine waters of the Satilla and Altamaha Rivers, Georgia. Limnology and Oceanography, 43, 647–668.
Chipman, D. W., Marra, J., & Takahashi, T. (1993). Primary production at 47°N and 20°W in the North Atlantic Ocean: a comparison between the14C incubation and the mixed layer carbon budget. Deep-Sea Research II, 40, 151–169.
Copin-Monte´gut, C. (1988). A new formula for the effect of temperature on the partial pressure of carbon dioxide in seawater. Marine
Chemistry, 25, 29–37.
Copin-Monte´gut, C., & Raimbault, P. (1994). The Peruvian upwelling near 15°S in August 1986. Results of continuous measurements of physical and chemical properties between 0 and 200m depth. Deep-Sea Research I, 41, 439–467.
Copin-Monte´gut, C., & Avril, B. (1995). Continuous measurements in surface water of the Northeastern tropical Atlantic. Tellus,
47B, 86–92.
Culkin, F. (1965). The major constituents of seawater. In J. P. Riley, & G. Skirrow, Chemical oceanography (Vol. 2) (pp. 121–161). London: Academic Press.
DeGrandpre, M. D., Hammar, T. R., Wallace, D. W. R., & Wirick, C. D. (1997). Simultaneous mooring-based measurements of seawater CO2and O2off Cape Hatteras, North Carolina. Limnology and Oceanography, 42, 21–28.
DeGrandpre, M. D., Hammar, D. W. R., & Wirick, C. D. (1998). Short-term pCO2and O2dynamics in California coastal waters. Deep-Sea Research II, 45, 1557–1575.
Dickson, A. G. (1990). Thermodynamics of the dissociation of boric acid in synthetic sea water from 273.15 to 298.15 K. Deep-Sea
Research, 37, 755–766.
Fileman, E., & Burkill, P. (2001). The herbivorous impact of microzooplankton during two short-term Lagrangian experiments off the NW coast of Galicia in summer 1998. Progress in Oceanography, 51 (2-4), 361–383.
Frankignoulle, M., & Bouquegneau, J. M. (1990). Daily and yearly variations of total inorganic carbon in a productive coastal area.
Estuarine, Coastal and Shelf Science, 30, 79–89.
Frankignoulle, M., Gattuso, J. P., Biondo, R., Bourge, I., Copin-Monte´gut, G., & Pichon, M. (1996). Carbon fluxes in coral reefs II. Eulerian study of inorganic carbon dynamics and measurements of air-sea exchanges. Marine Ecology Progress Series, 143, 123–132.
Frankignoulle, M., Abril, G., Borges, A., Bourge, I., Canon, C., Delille, B., Libert, E., & The´ate, J.-M. (1998). Carbon dioxide emission from European estuaries. Science, 282, 434–436.
Frankignoulle, M., & Borges, A. V. (2001). The European continental shelf as a significant sink for atmospheric carbon dioxide.
Global Biogeochemical Cycles, in press.
Frankignoulle, M., Borges, A., & Biondo, R. (2001). A new design of equilibrator to monitor carbon dioxide in highly dynamic and turbid environments. Water Research, 35, 1344–1347.
Friederich, G. E., Brewer, P. G., Herlien, R., & Chavez, F. P. (1995). Measurement of CO2from a moored buoy. Deep-Sea Research I, 42, 1775–1786.
Gattuso, J.-P., Frankignoulle, M., & Wollast, R. (1998). Carbon and carbonate metabolism in coastal aquatic ecosystems. Annual
Reviews Ecology and Systematics, 29, 405–433.
Goyet, C., Millero, F. J., O’Sullivan, D. W., Eischeid, G., McCue, S. J., & Bellerby, R. G. J. (1998). Temporal variations of pCO2 in surface seawater of the Arabian Sea in 1995. Deep-Sea Research I, 45, 609–623.
Goyet, C., & Peltzer, E. T. (1997). Variation of CO2partial pressure in surface seawater in the equatorial Pacific Ocean. Deep-Sea Research I, 44, 1611–1625.
Halvorsen, E., Hirst, A. G., Batten, S. D., Tande, K. S., & Lampitt, R. S. (2001). Diet and community grazing by copepods in an upwelled filament off the NW coast of Spain. Progress in Oceanography, 51 (2-4), 399–421.
Hansson, I., & Jagner, D. (1973). Evaluation of the accuracy of Gran plots by means of computer calculations. Analytica Chimica
Acta, 65, 363–373.
Huthnance, J. M. (1995). Circulation, exchange and water masses at the ocean margin: the role of physical processes at the shelf edge. Progress in Oceanography, 35, 353–431.
Joint, I., Inall, M., Torres, R., Figueiras, F. G., A´ lvarez-Salgado, X. A., Rees, A. P., & Woodward, M. (2001a). Two Lagrangian experiments in the Iberian upwelling system: tracking an upwelling event and an off-shore filament. Progress in Oceanography,
51 (2-4), 221–248.
Joint, I., Rees, A., & Woodward, M. (2001b). Primary production and nutrient assimilation in the Iberian upwelling in August 1998.
Progress in Oceanography, 51 (2-4), 303–320.
Kempe, S. (1982). Valdivia cruise, October 1981: carbonate equilibria in the estuaries of Elbe, Weser, Ems and in the Southern German Bight. Mitteilerngen des Geologisch Palaeontoligische Instituts der Universitat Hamburg, SCOPE/UNEP Sonderband,
52, 719–742.
Ko¨rtzinger, A., Thomas, H., Schneider, B., Gronau, N., Mintrop, L., & Duinker, J. C. (1996). At-Sea intercomparison of two newly designed pCO2systems — encouraging results. Marine Chemistry, 52, 133–145.
Ko¨rtzinger, A., Duinker, J. C., & Mintrop, L. (1997). Strong CO2 emissions from the Arabian Sea during South-West Monsoon. Geophysical Research Letters, 24, 1763–1766.
Lefe`vre, N., Moore, G., Aiken, J., Watson, A., Cooper, D., & Ling, R. (1998). Variability of pCO2in the tropical Atlantic in 1995. Journal of Geophysical Research, 103 (C3), 5623–5634.
Liss, P. S., & Merlivat, L. (1986). Air–sea exchange rates: introduction and synthesis. In P. Buat-Me´nard (Ed.), The role of air–sea
exchange in geochemical cycling (pp. 113–127). Utrecht: Reidel.
Monaco, A., Biscaye, P., Soyer, J., Pocklington, R., & Heussner, S. (1990). Particle fluxes and ecosystem response on a continental margin the 1985-1988 Mediterranean ECOMARGE experiment. Continental Shelf Research, 10, 809–839.
Monaco, A., Biscaye, P. E., & Laborde, P. (1999). The ECOFER (ECOsyste`me du canyon du cap-FERret) experiment in the Bay of Biscay: introduction, objectives and major results. Deep-Sea Research II, 46, 1967–1978.
Oudot, C., & Andrie´, C. (1989). Short-term changes in the partial pressure of CO2in eastern tropical Atlantic surface seawater and in atmospheric CO2mole fraction. Tellus, 41B, 537–553.
Pe´rez, F. F., Rı´os, A. F., & Ro´son, G. (1999). Sea surface carbon dioxide off the Iberian Peninsula (North eastern Atlantic Ocean).
Journal of Marine Systems, 19, 27–46.
Pingree, R. D., Sinha, B., & Griffiths, C. R. (1999). Seasonality of the European slope current (Goban Spur) and ocean margin exchange. Continental Shelf Research, 19, 929–975.
Robertson, J. E., Watson, A. J., Langdon, C., Ling, R. D., & Wood, J. W. (1993). Diurnal variation in surface pCO2and O2at 60°N, 20°W in the North Atlantic. Deep-Sea Research II, 40, 409–422.
Robertson, J. E., & Watson, A. J. (1993). Estimation of primary production by observation of changes in the mesoscale carbon dioxide filed. ICES marine Science Symposia, 197, 207–214.
Determi-nation of the ionization constants of carbonic acid in seawater in salinities 5 to 45 and temperatures 0 to 45°C. Marine Chemistry,
44, 249–267.
Rutllant, J., Fuenzalida, H., Torres, R., & Figueroa, D. (1998). Interaccio´n oce´ano-atmo´sfera-tierra en la regio´n de Antofagasta (Chile, 23°S): experimento DICLIMA. Revista Chilena de Historia Natural, 71, 405–427.
Simpson, J. J. (1984). On the exchange of oxygen and carbon dioxide between ocean and atmosphere in an eastern boundary current. In W. Brutsaert, & G. H. Jirka (Eds.), Gas transfer at water surfaces (pp. 505–514). Dordrecht: Reidel.
Simpson, J. J., & Zirino, A. (1980). Biological control of pH in the Peruvian coastal upwelling area. Deep-Sea Research I, 27, 733–744. Smith, S. V., & Mackenzie, F. T. (1987). The ocean as a net heterotrophic system: implications from the carbon biogeochemical
cycle. Global Biogeochemical Cycles, 1, 187–198.
Smith, S. V., & Hollibaugh, J. T. (1993). Coastal metabolism and the oceanic organic carbon balance. Reviews of Geophysics, 31, 75–89.
Smyth, T. J., Miller, P. I., Groom, S. B., & Lavender, S. J. (2001). Remote sensing of sea surface temperature and chlorophyll during Lagrangian experiments at the Iberian margin. Progress in Oceanography, 51 (2-4), 269–281.
Torres, R., Turner, D. R., Silva, N., & Rutllant, J. (1999). High short-term variability of CO2fluxes during an upwelling event off the Chilean coast at 30°S. Deep-Sea Research I, 46, 1161–1179.
Tsunogai, S., Watanabe, S., & Sato, T. (1999). Is there a “continental shelf pump” for the absorption of atmospheric CO2? Tellus, 51B, 701–712.
Van Green, A., Takesue, R. K., Goddard, J., Takahashi, T., Barth, J. A., & Smith, R. L. (2000). Carbon and nutrient dynamics during coastal upwelling off Cape Blanco, Oregon. Deep-Sea Research II, 47, 975–1002.
Walsh, J. J., Rowe, G. T., Iverson, R. L., & McRoy, C. P. (1981). Biological export of shelf carbon is a neglected sink of the global CO2cycle. Nature, London, 291, 196–201.
Walsh, J. J., Biscaye, P. E., & Csanady, G. T. (1988). The 1983-1984 Shelf Edge Exchange Processes (SEEP)-I experiment: hypotheses and highlights. Continental Shelf Research, 8, 435–456.
Wang, S.-L., Chen, C.-T. A., Hong, G.-H., & Chung, C.-S. (2000). Carbon dioxide and related parameters in the East China Sea.
Continental Shelf Research, 20, 525–544.
Wanninkhof, R. H. (1992). Relationship Between wind speed and gas exchange over the ocean. Journal of Geophysical Research,
97 (C5), 7373–7382.
Watson, A. J. (1995). Are upwelling zones sources or sinks of CO2? In C. P. Summerhayes, K.-C. Emeis, M. V. Angel, R. L. Smith, & B (Eds.). Zeitzschel, Upwelling in the oceans: Modern processes and ancient records (pp. 321–336). John Wiley and Sons.
Wong, G. T. F., Chao, S.-Y., Li, Y.-H., & Shiah, F.-K. (2000). The Kuroshio edge exchange processes (KEEP) study — and introduction to hypotheses and highlights. Continental Shelf Research, 20, 335–347.
Wollast, R. (1993). Interactions of carbon and nitrogen cycles in the coastal zone. In R. Wollast, F. T. Mackenzie, & L. Chou (Eds.),
Interactions of C, N, P and S biogeochemical cycles and global change (pp. 195–210). Utrecht: Reidel.
Wollast, R. (1998). Evaluation and comparison of the global carbon cycle in the coastal zone and in the open ocean. In K. H. Brink, & A. R. Robinson, The sea (Eds.), (Vol. 10) (pp. 213–252). Wiley and Sons.
Wollast, R., & Chou, L. (2001). The carbon cycle at the ocean margin in the northern Gulf of Biscay. Deep-Sea Research II, 48,
14–15.
Yamashita, E., Fujiwara, F., Liu, X., & Ohtaki, E. (1993). Measurements of carbon dioxide in the Seto Inland Sea of Japan. Journal