Published in: Journal of molecular structure (1996), vol. 383, iss. 1-3, pp. 63-68 Status: Postprint (Author’s version)
SAXS analysis of the morphology of biocompatible and biodegradable
poly(ε-caprolactone-b-glycolide) copolymers
R. Sobry(1), G. Van den Bossche(1), F. Fontaine(1),I. Barakat(2), Ph. Dubois(2), R. Jérôme(2)
(1)
Experimental Physics, University of Liège, Sart-Tilman (B5), 4000-Liège, Belgium
(2)
CERM, University of Liège, Sart-Tilman (B6), 4000-Liège, Belgium
Abstract
Poly(ε-caprolacrone-b-glycolide) diblock copolyesters have been synthesized by the sequential polymerization of ε-caprolactone and glycolide as initiated by aluminium alkoxides. Copolymerization is typically "living" and yields copolyesters of perfectly controlled molecular weight and composition. Diblock molecular weight (MnPGA+MnPCL) ranges from 5700 to 42 000 and the ρ = MnPCL/MnPGA ratio varies from 1.5 to 13.1. Due to the
inherent insolubility of the polyglycolide (PGA) segment in common organic solvent, the diblock copolyesters form stable non-aqueous colloidal dispersions e.g. in toluene, the stability of which results from the soluble poly(ε-caprolactone) (PCL) block.
Combining all the experimental observations (PCS, TEM, WAXS, SAXS, AFM), a micelle model has been proposed which consists of a polyglycolide core surrounded with a corona of polycaprolactone (PCL). Both constituents are semi crystalline. From SAXS observations, the PGA core is better described by two concentric spheres. The internal sphere of a 5-6.7 nm diameter would essentially contain crystalline PGA. The diameter of the external sphere, DPGA, is in the range from 6.2 to 9.6 nm, at least for the investigated diblock copolymers. As
a rule, this diameter increases as ρ decreases at constant molecular weight and as the diblock molecular weight increases at constant ρ. A scattering peak (weak) is observed in the range from 10.8 to 15.5 nm and the Bragg distance is close ΜDPGA>where µ is equal to (l+3ρ/2)1/3. From steric considerations, µ is the ratio between the
diameter of the micelle and the diameter of the PGA core, so that this peak has been assigned to the characteristic intermicellar distance. At very small angles, several additional peaks are the signature of a hyperstructure which is possibly lamellar.
Keywords: Small angle X-ray scattering; Diblock copolymer; Morphology
1. Introduction
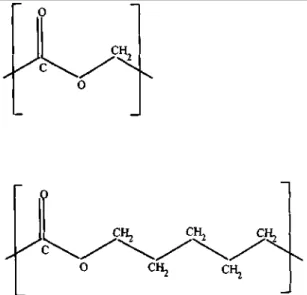
Interest in polyglycolide (PGA, Fig. 1(a)) and copolymers of glycolide (GA) has to be found in their usefulness in medicine, particularly as surgical sutures, and in sustained drug delivery. In addition to good mechanical properties, these copolymers have a low immunogeneity and an extremely low toxicity.
ε-Caprolactone (ε-CL)(Fig. 1(b)) is another building block of a relatively low toxicity and relatively fast biodegradability [1]. In view of tailoring biodegradable polymers of low toxicity, it deserves interest to explore the phase morphology of copolymers of ε-CL and GA of a well defined molecular structure.
Diblock copolyesters have been synthesized by the sequential polymerization of ε-caprolactone and glycolide, respectively, initiated by Al alkoxides [2]. Indeed, the living poly-ε-caprolactone has proved to be an effective macroinitiator for the polymerization of glycolide in THF at 40°C. Copolymerization is typically living and yields copolyesters of perfectly controlled molecular weight and composition. Diblock copolyesters have been characterized by size exclusion chromatography of the poly ε-CL block and NMR analysis of the final
copolymers. Thermal analysis has also been carried out. The insolubility of the polyglycolide block in toluene is responsible for the formation of stable non-aqueous colloidal dispersions in this solvent. This effect is as
pronounced as the GA/ε-CL molar ratio is high. Actually, the insoluble PGA core is stabilized by a solvated PCL shell. These colloids made up of two biocompatible polyesters of drastically different physical properties (melting temperature and biodegradability) have potential for biomedical applications. This paper is concerned with the SAXS characterization of the phase morphology of bulk diblock copolymers. Photon correlation spectroscopy (PCS), transmission electron microscopy (TEM) and WAXS have also been used as investigation techniques.
Fig. 1. Schematic representation of (a) PGA and (b) PCL chains.
2. Experimental
The SAXS intensity was registered with two equipments, i.e. a Kratky compact camera at the Laboratory of Experimental Physics of the University of Liège (Belgium) and the D22 and D24 beam lines of the L.U.R.E-D.C.I. Synchrotron Radiation Source at Orsay (France). The sample-detector distance d, wavelength λ and scattering vector, s = 2 sin θ/λ, ranges were as follows:
Kratky camera: d = 200 mm, λ = 1.5418 Å and 0.005 nm-1< s < 1 nm-1 D22 line: d = 942 mm, λ = 1.3774 Å and 0.015 nm-1 < s < 0.35 nm-1 D24 line: d = 1975 mm, λ = 1.488 Å and 0.005 nm-1 < s < 0.25 nm-1 Table 1
Molecular characteristics of the diblock copolymers (MnPCL, MnPGA,ρ and µ. Sizes (nm) of particles and
aggregates observed with PCS and TEM after solvent evaporation. For the PCS results, the wt.% of each type of diffusing species is indicated in parentheses. For the 28 500-13 600 sample, PCS analysis has been performed with a 0.5 wt.% solution in toluene compared to 0.1% for the other samples
Sample PCS TEM
MnPCL MnPGA ρ µ Particles Aggregates Particles Aggregates
4500 2250 2.0 1.6 21 (86) 493 (14) 16.6 250 28 500 13600 2.1 1.6 69 (85) 455 (15) 18.0 540 16500 2900 5.7 2.1 12 (100) 15.0 300 6000 900 6.7 2.2 24 (100) 12.5 200 32000 3900 8.2 2.4 21 (85) 204 (15) 12.5 550 9000 800 11.3 2.6
3. Results and discussion
For the P(ε-CL-b-GA) dispersions in toluene, PCS shows a bimodal distribution after a half hour ultrasonic irradiation (Table 1) [2]. The smallest particles usually dominate the size distribution curve. Their average size is in the range of ca. 10-25 nm when the diblocks are dispersed in toluene at concentration of 0.1 wt.%. The mean dimension of the large particles, which appear to be aggregates, is of the order of a few hundreds nm. Under the same conditions, TEM observation of samples recovered after the slow solvent evaporation shows large
aggregates, the size of which is in the range of 200-500 nm. At a larger dilution (0.05 wt.%) smaller particles are observed, the diameter of which is of the order of 10-20 nm. These particles are thought to be primary particles
Published in: Journal of molecular structure (1996), vol. 383, iss. 1-3, pp. 63-68 Status: Postprint (Author’s version)
consisting of a highly crystalline and insoluble PGA core surrounded by a PCL shell. Table 1 compares the sizes as measured by PCS and TEM for copolymers of various PGA and PCL molecular weight (MPGA and MPCL)and
composition (ρ = MPCL/MPGA).
The crystalline structure of PGA (Fig. 1(a), MGA = 58) and ε-PCL (Fig. 1(b), MCL = 114) consists of 4 structural
units per orthorhombic unit cell [3,4]. The steric hinderance of one structural unit is approximately given by the fourth of the unit cell volume i.e. VGA = 55 Å3 and VCL= 160 Å
3
. WAXS pattern of poly (ε-CL-b-GA) shows the characteristic diffraction peaks of crystalline PGA and ε-PCL and the systematic extinctions of the
corresponding space groups (Pcmn for PGA and P212121 for ε-PCL,respectively). Therefore, PGA core and PCL
shell are, at least partially, crystalline. The volume of one macromolecule is V1 = (MPGAVGA/MGA+MPCLVCL/MCL)
with VCL ≈ 3VGA and MCL ≈ 2MGA. Assuming that a spherical particle of diameter, Dtot, results from the
aggregation of N macromolecules, it may be written that NV1 = π(Dtot)3/6 or:
Dtot ≈ [(6 / π)VGAN(MPGA / MGA)(l + 3ρ / 2)]1/3
The diameter, DPGA, of the assumed spherical PGA core, corresponds to the first term of the sum and it results
that Dtot /DPGA ≈ µ where µ = (l + 3ρ/2)1/3. DPGA and Dtot are proportional to (NVGA)1/3 so that if the density of the
polymers are only 50% of the density of the crystalline structural units, the calculated diameters have to be multiplied by 21/3 ≈ 1.26 and the aforesaid approximation is useful.
SAXS features can be observed when the electronic contrast between the phases is high enough. For the diblock copolymers under consideration, the difference in the electronic density is not very large: 0.6 e/Ǻ3 for PGA and 0.4e/Ǻ3 for PCL although large enough to extract the main structural characteristics of the two-phase system. The volume fractions, φPGA ≈ µ
-3
and φPCL= 1-φPGA.directly depends on DPGA and Dtot. The electronic contrast is
as large as φPGA is high.
The background scattering which is proportional to s2 and results from inhomogeneities within the phases has been subtracted according to a previously reported method [5]. An increase in φPGA results in an improved phase
homogeneity. Desmearing of the Kratky camera scattering has been performed by the Vonk method [6] and an original method by Sobry et al. [7]. As expected, the pinhole intensity, I, does not show characteristic features and all the scattering curves are very similar.
Small differences can however be observed on a log-log plot of I vs. s (Fig. 2). All these curves show a remarkable change of slope at ca. 0.10 nm-1 followed by a region where the intensity apparently decreases as s -4 according to the Porod law [8]. Scattering curves measured with the synchrotron radiation (D22 station) confirms this observation. This region becomes larger as µ and the chain lengths are increased. A possible explanation would be that the scattering by the PGA cores mainly appears beyond the Porod region, whereas the organization of the PGA spheres within the PCL matrix would account for the scattering intensity at s values smaller than the Porod region.
In order to confirm this hypothesis, PCL blocks have been end-capped with a bromine anion [2], so that the electronic contrast between PGA and (ω-bromo)PCL blocks is significantly increased. The origin of the Porod region is now observed as a bump, noted M in Fig. 2, which clearly changes the s -4 slope. A careful analysis of the SAXS curves for the non-brominated samples actually reveals a faint maximum at the same position. At smaller angles than M, some oscillations are superimposed to the fast intensity decrease as observed with both the Kratky camera and the synchrotron radiation (D24 line, Fig. 3).
Positions of these oscillations have been indexed as M1,..., M4. At angles larger than the Porod region, the
scattering curve recorded by the Kratky camera also shows several oscillations (Fig. 4), the maxima of which have been noted m1,..., m12. Finally, when s > 0.35 nm-1 , Is2 is almost constant or it slightly decreases as s
increases. This Is2 constancy is more clearly observed for high µ values and long chains. This observation is a possible indication of a lamellar structure forced by the PCL blocks.
The M peak characterizes the core-core distance while the mi peaks are associated to the shape and size of the
PGA cores. In the hypothesis of spherical PGA cores, the first observed m1 peak must be assigned to the first
scattering peak of a sphere. This occurs at s = 0.92/R where R is the sphere radius. The successive peaks characteristic of a sphere are expected at α/R with α = 1.45, 1.96, 2.47, 2.97, 3.48, 3.98 etc... When the small mi
peaks are concerned, the three, four or five first theoretical peaks are actually observed on the pinhole curve. The m2 peak is never among them.
Fig. 2. Log-log intensity plots (Kratky camera) for six investigated diblock copolymers and for a brominated one. The M peak position and the s -4 straight line are also shown.
Fig. 3. Is vs. s plot (synchrotron radiation, D24 station) and the Mi peaks observed at very small angles.
However, repeating the same procedure with the m2 peak, a second sphere of a radius R' < R can be considered
and two or three supplementary mi, peaks can be assigned. It is quite remarkable that all the expected peaks
characteristic of the spheres (R or R') are observed on the SAXS curve. The R sphere must be related to the PGA core and the R' sphere to a highly crystalline inner part of the PGA core. Both diameters DPGA = 2R and Dcrys =
Published in: Journal of molecular structure (1996), vol. 383, iss. 1-3, pp. 63-68 Status: Postprint (Author’s version)
volume fraction, φcrys, of PGA core varies from 0.34 to 0.75.
In the core-shell model, the distance between two near-neighbour cores may be approximated to Dtot. Then, the
M peak position, sM. provides a direct determination for Dtot from the Dtot = 1/sMrelationship (Tables 2 and 3).
Values of Dtot and DTEMare in good agreement, Dtot being however slightly smaller than DTEM.It must be noted
that the ratio Dtot/DPGAis very close to µ so that the aforementioned relationship is confirmed by the experimental
values extracted from the assignment and position of the M and mi peaks. In other words, φPGA is close to µ-3 so
that the space filling with stacked spheres results in [Dtot/DPGA]
3
= 1/φPGA= µ3.
The M1-M4 peaks have been observed with both the Kratky camera and the synchrotron radiation (D24 line) on a
large number of samples. Three peaks (M1, M2 and M4) are systematically observed with synchrotron radiation at
s positions of 0.018, 0.027 and 0.044 nm-1 which correspond to the position ratios of 1,1.5 and 2.44 with respect to M1. These data agree with the Kratky camera results, although the peaks are less apparent. The M3 peak,
which is not always observed, corresponds to a position ratio of 2.0 compared to M1. Between M4 and M
positions, some additional very weak peaks (M5,..., M8) can also be detected on the upturn of the SAXS curve.
They are undoubtedly the signature of a superorganization of the spheres. The spheres organization according to a cubic or a hexagonal close packed lattice cannot be identified on the SAXS curves since the peaks should be observed on the Porod region or among the mi peaks. The "unit cells" combine themselves into larger aggregates.
The aforementioned position ratios are not characteristic of a typical structure. However, two brominated samples have shown a peak M0 at very small angles of ca. 0.008 nm
-1
. Including this M0 peak into the M1,..., M4
series, the peak positions are slightly shifted (6-8%) towards smaller angles for the brominated samples. A 8% correction for the M0 position leads to position ratios of 2, 3, 4 and 5, respectively, for the M0,..., M4 series. The
M5,..., M8 positions also agree with this sequence and provides position ratios close to 6, 7, 8 and 9, with respect
to M0. Such a sequence can be assigned to a lamellar structure.
Preliminary AFM experiments have confirmed the spherical shape of the particles, the sizes of which range from 5-10 nm in a good agreement with the DPGA estimations (TEM and SAXS). AFM also supports a lamellar
structure.
Table 2
Structural characteristics of the diblock copolymers with a Kratky camera. All the distances are in nm. Symbols are defined in the text. The three samples with an asterisk are brominated
MnPGA µ φPGA DPGA Dcrys Dcrys/DPGA φcrys M M/µDPGA
2250 1.6 0.250 7.16 5.23 0.73 0.39 10.81 0.94 13 600 1.6 0.241 9.63 6.72 0.70 0.34 2900 2.1 0.105 6.55 5.66 0.86 0.65 12.70 0.92 900 2.2 0.091 6.43 5.84 0.91 0.75 12.72 0.90 3900 2.4 0.075 6.64 5.49 0.83 0.57 15.45 0.97 800 2.6 0.056 6.17 5.43 0.88 0.68 15.50 0.97 7900* 1.6 0.231 6.59 5.77 0.88 0.67 11.63 1.10 2800* 2.2 0.092 7.13 6.07 0.85 0.62 12.67 0.81 1500* 2.7 0.051 7.39 6.28 0.85 0.61 15.12 0.76
Fig. 5. Schematic representation of the micellar organization. 4. Conclusion
From all the experimental results, a general model can be proposed as schematized in Fig. 5. The PGA core consists of two concentric spheres; the first one is made of highly crystalline PGA whereas the external spherical shell would be much more amorphous PGA. The sphere diameters are of the order 5-6.5 nm for the highly crystalline PGA and 6-9.6 nm for the PGA shell respectively. A semi-crystalline PCL corona surrounds the PGA core. The distance between two near-neighbour PGA cores is in the range of 10-15 nm. Aggregation of the PGA cores within the PCL matrix, according to a cubic or hexagonal compact stacking, gives rise to a lamellar structure.
Table 3
M peak Bragg distance (nm) for the investigated diblock copolymers (synchrotron radiation, D24 line). Some samples have been analyzed with a Kratky camera (Table 2) and the synchrotron radiation.
µ MnPGA M 1.5 2700 10.0 1.6 2250 9.61 1.6 13600 13.2 2.15 1750 13.25 2.2 2800 13.14 2.2 900 12.83 2.7 1500 13.66 2.75 420 13.02
Published in: Journal of molecular structure (1996), vol. 383, iss. 1-3, pp. 63-68 Status: Postprint (Author’s version)
Acknowledgements
The authors are grateful to the "Services Fédéraux des Affaires Scientifiques Techniques et Culturelles" for financial support in the frame of the "Pôles d'Attraction Interuniversitaires: Polymères" and to 3M and the F.N.R.S. (Fonds National de la Recherche Scientifique) for financial support.
References
[1] D.J. Lyman and S.M. Rowland, Biomaterials, Encyclopedia Polymer Science and Engineering, 2nd edn., 1985, Chap. 2, p. 267.
[2] I. Barakat, P. Dubois, R. Jérôme, P. Teyssié and M. Mazurek, Macromol. Symp., 88 (1994) 227-244. [3] Y. Chatani, K.Suehiro, Y. Okita, H. Tadokoro and K. Chujo, Die Makromoleculare Chemie, 113 (1968) 215-229.
[4] Y. Chatani, Y. Okita, H. Tadokoro and Y. Yamashita, Polymer J., 1 (1970) 555-562. [5] C.G. Vonk, J. Appl. Cryst., 4 (1971) 340-342.
[6] R. Sobry, Y. Rassel, F. Fontaine, J. Ledent and J.M. Liégeois, J. Appl. Cryst., 24 (1991) 692-701. [7] R. Sobry, J. Ledent and F. Fontaine, J. Appl. Cryst., 24 (1991) 516-525.