The Air Quality in African Rural Environments. Preliminary
Implications for Health: The Case of Respiratory Disease
in the Northern Benin
Florence De Longueville&Yvon Hountondji& Pierre Ozer&Sabine Henry
Received: 20 June 2014 / Accepted: 2 October 2014 # Springer International Publishing Switzerland 2014
Abstract Recently, the World Health Organization’s International Association for Research on Cancer clas-sified outdoor air pollution as carcinogenic to humans and puts air pollution in the same category as tobacco smoke, UV radiation, and plutonium. The ambient air is polluted by emissions from motor vehicles, industrial processes, power generation, household combustion of solid fuel, and other sources. Dust storms lead to partic-ulate levels that exceed internationally recommended levels, especially near the Sahara. However, this source of air pollution appears to be under-studied, particularly in the literature devoted to human health impacts in West Africa. More than 50 % of the total dust emitted into the atmosphere comes from the Sahara. These aerosols contribute to increase the concentrations of particles smaller than 10μm (PM10), which are
breath-able particles. This study is the first designed to assess
the real impact of Saharan dust on air quality and respi-ratory health of children in a region of West Africa. Dust events having affected the Northern Benin during the dry seasons between 2003 and 2007 were determined. The analyzed health data are the monthly rates of acute lower respiratory infections (ALRI). Over the entire study period, 61 days of dust events were observed in the region. They recorded on average a daily PM10
concentration of 1017 μg m−3, more than 18 times higher than that calculated on all days without dust events. The study also highlighted a mean increase of 12.5 % of ALRI rates during the months recording dust events. The use of daily health data should help to refine these initial results in the future.
Keywords Acute lower respiratory infections . Dust . Benin . Children . Sahara
1 Introduction
It is now acknowledged that the disease burden due to air pollution is substantial. Recently, the World Health Organization’s International Association for Research on Cancer (IARC) classified outdoor air pollution as carcinogenic to humans and now puts air pollution in the same category as tobacco smoke, UV radiation, and plutonium. Approximately 223,000 lung cancer deaths in 2010 were attributable to ambient fine particles, more than half in China and other East Asian countries. Yet, exposure to ambient fine particles was recently estimat-ed to have contributestimat-ed 3.2 million premature deaths DOI 10.1007/s11270-014-2186-4
F. De Longueville (*)
:
S. HenryDepartment of Geography, University of Namur, 61 Rue de Bruxelles, 5000 Namur, Belgium
e-mail: [email protected] F. De Longueville
:
P. OzerDepartment of Environmental Sciences and Management, University of Liege, 185 Avenue de Longwy, 6700 Arlon, Belgium
Y. Hountondji
Department of Natural Resources Management, Faculty of Agronomy, University of Parakou, BP123 Parakou, Benin F. De Longueville
CEDEM, University of Liege, 7 Boulevard du Rectorat, 4000 Liege, Belgium
worldwide in 2010, due largely to cardiovascular dis-ease (Straif et al.2013). Emissions from motor vehicles, industrial processes, power generation, household com-bustion of solid fuel, and other sources pollute the ambient air across the globe (Straif et al. 2013). Dust storms lead to particulate levels (PM10 concentrations) that exceed internationally recommended levels espe-cially near the Sahara (de Longueville et al.2013a) but this source of air pollution appears to be under-studied, particularly in the literature devoted to human health impacts in West Africa (de Longueville et al.2013b).
The Sahara and its surroundings, by producing about half of the global yearly mineral dust, is the main source of atmospheric mineral dust of the world. About 12 % of the Saharan dust moves northwards to the Mediterranean and Europe; 28 % westwards crossing the Atlantic Ocean to the USA, the Caribbean, and South America; and 60 % southwards to the Gulf of Guinea (Engelstaedter et al.
2006). Paradoxically, the scarcity of information about air quality relating to the African continent is a reality illus-trated by the recent map of exposure to PM10in urban
areas worldwide (WHO 2012). Of 1100 urban areas listed, only ten (less than 1 %) are located within the African continent (54 countries, >30,000,000 km2), six times less than the station data available in France. Moreover, none of the air quality data from these ten African cities are complete. Only a few unspecified months are used to give an‘annual PM10concentrations’
global picture. Despite these large uncertainties, annual PM10 concentrations exceed 50μg m−3in all African
cities represented but the situation seems even more critical in the eastern Mediterranean Region (Iran, Pakistan, United Arab Emirates, and Saudi Arabia) and in Southeast Asia (India) (WHO2012). However, the use of alternative data sources allows us to draw far more alarming facts than those reflected in this WHO map.
Based on the AMMA1 database, Banizoumbou (South Niger) had recorded a high annual PM10
concen-tration of 149μg m−3in 2006 and 225μg m−3in 2007 (Marticorena et al.2010). This shows an important inter-annual variability not reflected in the published map. With the level of PM10concentration recorded in 2007,
Banizoumbou would be ranked 1094th of 1100 if it had integrated the classification of cities on the maps. The town counted fewer than 1500 inhabitants in 2000, but its position relative to the Sahara and the mainstreams is
close to the situation of Niamey (more than 1,300,000 inhabitants in 2011), without the presence of anthropo-genic pollutants. The analysis of intra-annual variability of PM10 concentrations also provides essential
ele-ments: maximal and minimal monthly PM10
concentra-tions were recorded in February (406μg m−3) and in September (23.8 μg m−3) for 2006 and in January (561μg m−3) and August (14.8μg m−3) for 2007. As expected, the highest PM10 concentrations are noted
during the dry season in which the majority of the dust events occur (Goudie and Middleton2006). This under-lines that the annual PM10concentrations can be
strong-ly biased in the case of missing monthstrong-ly values in the calculation of the annual average.
In Niger and Mauritania, estimations of PM10
concen-trations from horizontal visibility reductions showed that mineral dust accounts for 106 and 137 annual daily exceedances of the 50μg m−3PM10 limit value (Ozer
2005; Ozer et al.2007), indicating a strong likelihood of health impacts. The map depicting the global estimates of ambient fine particulate matter concentrations from satellite-based aerosol optical depth confirms that the whole north half of the African continent is home to the highest PM2.5concentrations of the world (van Donkelaar
et al.2010). Knowing that PM2.5mainly emanate from
urban areas and that desert dust also consist of a large part of PM10, the results would be even more worrying in case
of global estimation of PM10concentrations.
In spite of the disproportionate levels reached in West Africa, existing studies seem to put aside (i) Africa, (ii) desert dust as a major source of pollution in the air breathed, and finally, (iii) the impacts of the desert dust’s pollution of the air on the health of African populations. As well as other sources of air pollution, special atten-tion should be paid to dust storms since such mineral particulate matter air pollution may be a serious health threat because it may promote respiratory infection, cardiovascular disease, and other ailment. According to Sandstrom and Forsberg (2008), coarse particles are more likely to be deposited in the bronchial passages and thereby affect respiratory conditions. In contrast, fine particles seem more likely to reach the alveoli and lead to cardiovascular events. Saharan dust also carries large amounts of pollens and microorganisms such as bacteria and fungi, as well as related protein and lipid components (Griffin 2007; Garrison et al. 2014). Moreover, particulate matter may contain endotoxins, which are the components of the bacterial wall and could cause respiratory and systemic inflammatory 1
African Monsoon Multidisciplinary Analysis (Redelsperger et al.
responses and can exacerbate lung disease (Sandstrom and Forsberg2008). A number of adverse health effects have been associated with desert dust in the literature including respiratory diseases (among others asthma and pneumonia), cardiovascular diseases (ischemic heart ease and cerebrovascular disease), cardiopulmonary dis-eases (chronic obstructive pulmonary disease), and more rarely, allergic rhinitis. Coccidioidomycosis, meningococ-cal meningitis, conjunctivitis, dermatologimeningococ-cal disorders, algal blooms and red tides, deaths, and injuries resulting from transport accidents have also been associated with desert dust events (Goudie2014). Quantitative studies on health impacts of desert dust generally focus on Asia (de Longueville et al.2013b). In recent years, many authors have identified significant health impacts of Saharan dust events in Southern Europe (Mallone et al.2011; Nastos et al.2011; Perez et al.2012) although PM10
concentra-tions were well below those recorded in West Africa. The physicochemical composition of Saharan dust is different from industrial dust, vehicle pol-lutants, smoke from wildfires, household combus-tions of solid fuel, and other pollutants (Wagner et al. 2012); so the health impacts may be differ-ent. Based on a single study, desert dust events seem to produce fewer biological impacts than anthropogenic sources (Val et al. 2013) but it is not sufficient. Indeed, in the light of the levels of PM10 concentration recorded near the Sahara and
the significant health impacts demonstrated in oth-er parts of the world, new research is urgently needed to estimate the contribution of this source of pollution to mortality and morbidity in West African populations.
Based on the combination of multiple sources of data in the presence of desert dust and an original health database, the objective of this re-search is to verify the existence of impacts of Saharan dust on air quality and respiratory health in West Africa. It is also trying to quantify the possible links between the presence of desert dust in the air breathed by people and the occurrences of acute lower respiratory infections (ALRI) affect-ing children under 5 years old in the northern rural Benin. In this sense, the present study comple-ments previous studies on air quality in Africa that consider the impact of carbonaceous aerosols on respiratory diseases in the African cities (e.g., Liousse and Galy-Lacaux 2010) on the one hand, and the studies on dust and its impact on huge
outbreaks (like meningitis but not respiratory dis-eases) in rural environment (e.g., Martiny and Chiapello 2013) on the other hand.
2 Study Area and Period
There are several sources of aerosols within the Sahara (d’Almeida 1986; Prospero et al. 2002) and different trajectories on the African continent (Middleton and Goudie 2001). We focus on dust from the Bodélé de-pression of Lake Chad that is transported during the dry season at low altitudes by the Harmattan, to the South of Niger, and Nigeria before reaching the Gulf of Guinea (Ozer et al.2005).
The study area is one of the 34 health zones of Benin (Fig.1), and the study period includes four dry seasons between 2003 and 2007. The chosen health area (region of Kandi) is located in the north of the country, away from densely populated areas and large urban centers from which emanate various anthropogenic pollutants (Lindén et al. 2012). The choice of the area and the study period was restricted by limited availability of both desert dust data and ALRI in young populations (children under 5 years old). Restrict the study of dry seasons is relevant because mineral dust essentially flow close to the surface in the first trimester of the year as it has been shown in the previous studies based on satellite and/or aerosol in situ measurements in Senegal (Léon et al. 2009) and in Niger and Mali (Martiny and Chiapello2013). A fairly efficient health data system exists in Benin where it was also possible to collect data of horizontal visibility for the months of dry season (November to March) between February 2003 and December 2007 from the meteorological station of Kandi (2.94° E, 11.13° N).
3 Data and Method
Saharan dust events affecting the study area during four dry seasons (2003–2004, 2004–2005, 2005–2006, and 2006–2007) have been determined on the basis of the combination of two data sources. On the one hand, the literature “in the broad sense”, i.e., scientific articles, grey literature available online, and websites of satellite data, was explored through a combination of systematic keywords queries made in English and French. After verification, only the episodes that were likely to affect
the quality of the air in Benin were listed with regard to the origin of dust (Sahara and more particularly the Bodélé depression), the dust trajectories (west and southwest), and/or the affected areas (regions of West Africa) (Table 1). On the other hand, hourly data of horizontal visibility observed at the meteorological sta-tion of Kandi have been acquired from the Nasta-tional Meteorology Centre of Benin for the same period. The horizontal visibility is a substitution variable of the air quality, defined by the World Meteorological Organization (WMO) as ‘the maximum distance at which an observer can see and identify an object located near the horizontal plane where it is itself’ (WMO
1992). Various weather conditions can explain signifi-cant visibility reductions. During the dry season, the visibility can be reduced by the presence of desert dust (Nouaceur 2004; Ozer 2005). To identify potential Saharan dust events affecting the study area, we ob-served changes in daily minimum hourly visibility dur-ing the study period. The criterion defined for classify-ing an episode as potentially beclassify-ing a dust event was the registration of daily minimum hourly visibility less than
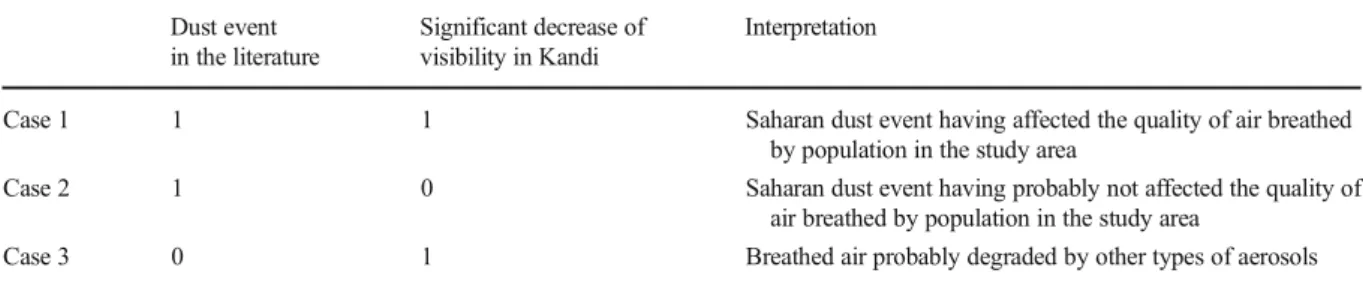
2 km for at least two consecutive days. Finally, the confrontation of the resulting dust events of two data sources gave rise to three cases based on the concor-dance or discorconcor-dance between dust episodes relayed in literature and the observation of decreases in visibility to Kandi (Table2).
To quantify the impacts of the Saharan dust events on the quality of air breathed in the study area (case 1 in Table2), hourly data of horizontal visibility (V in dam) have been converted into concentrations of particles smaller than 10μm (PM10) (C inμg.m−3) thanks to an
established relationship by d’Almeida (1986): C¼ 914:06 V−0:73þ 19:03
This equation has been implemented from 200 ob-servations of horizontal visibility ranging from 200 m to 40 km collected in 1981 and 1982 in 11 synoptic sta-tions located at south of the Sahara. The coefficient of determination (R2) between the horizontal visibility and the PM10concentration is 0.95 (D’Almeida1986). In
this study, only hourly visibility within 5 km values was
Health zone of interest Health zones Densely populated area
Table 1 Dust events listed in the literature observed between November 2003 and March 2007 in West Africa and likely to have affected the air quality in the region of Kandi
ID Date of dust event Sources
1 End of December 2003 http://www.llansadwrn-wx.info/watch/dustdec03.html
2 3 February 2004 http://earthobservatory.nasa.gov/NaturalHazards/view.php?id=12662
3 17 February 2004 http://earthobservatory.nasa.gov/NaturalHazards/view.php?id=12712
4 2–6 March 2004 Ozer2006
Nouaceur2008
Li et al.2007
Knippertz and Fink2006
http://loatec.univ-lille1.fr/terreetciel/animations.php?lang=fr http://oiswww.eumetsat.org/WEBOPS/meteocal/latest/www/resource/asmet5/www/french/asmet5/ duststorms/intro/interest.htm http://oiswww.eumetsat.org/WEBOPS/iotm/iotm/20040303_dust/20040303_dust.html 5 2–11 January 2005 http://loatec.univ-lille1.fr/terreetciel/animations.php?lang=fr http://www.goodplanet.info/Contenu/Points-de-vues/Systemes-naturels-sous-contrainte http://earthobservatory.nasa.gov/NaturalHazards/event.php?id=14436
6 12–16 February 2005 Hao and Qu2007
7 25 February 2005 http://earthobservatory.nasa.gov/NaturalHazards/view.php?id=14668
8 23 March 2005 http://earthobservatory.nasa.gov/NaturalHazards/view.php?id=14810
9 7–13 March 2006 Slingo et al.2006
Tulet et al.2008
Marticorena et al.2010
PM10database from AMMA project (station of Banizoumbou, Niger)
10 10 November 2006 http://earthobservatory.nasa.gov/NaturalHazards/category.php?cat_id=7&m=11&y=2006
11 11 December 2006 http://earthobservatory.nasa.gov/NaturalHazards/view.php?id=17773
PM10database from AMMA project (station of Banizoumbou, Niger)
12 1 January 2007 Deroubaix et al.2013
13 13 January 2007 PM10database from AMMA project (station of Banizoumbou, Niger)
http://earthobservatory.nasa.gov/NaturalHazards/view.php?id=17883
14 21 February 2007 http://archive.org/details/sahara_tmo_2007052
http://earthobservatory.nasa.gov/NaturalHazards/view.php?id=18034
15 28 February 2007 http://ozoneaq.gsfc.nasa.gov/qa/report/OMI_QA_Natural_Events.htm#Dust_Smoke http://earthobservatory.nasa.gov/NaturalHazards/view.php?id=18059
16 10 March 2007 PM10database from AMMA project (station of Banizoumbou, Niger)
http://ozoneaq.gsfc.nasa.gov/qa/report/OMI_QA_Natural_Events.htm#Dust_Smoke http://earthobservatory.nasa.gov/NaturalHazards/category.php?cat_id=7&m=3&y=2007
Table 2 Combination of the two data sources for the detection of dust events Dust event
in the literature
Significant decrease of visibility in Kandi
Interpretation
Case 1 1 1 Saharan dust event having affected the quality of air breathed by population in the study area
Case 2 1 0 Saharan dust event having probably not affected the quality of air breathed by population in the study area
converted to PM10concentrations. For higher
visibili-ties, we assigned a PM10 concentration equal to
0μg m−3, where there were no dust events. From hourly data of visibility, values of average daily concentrations were calculated. A comparison was then made between the average of the concentrations throughout the day with a dust event and the daily concentrations averaged over the entire day without a dust event.
Health data come from the Système National d’Information et de Gestion Sanitaire (SNIGS) established in Benin in 1995. They are based on the monthly statistics of consultations of children under 5 years old for ALRI recorded in public health centers. Data for the months of the dry season between January 1998 and December 2008 (i.e., ten full dry seasons in all) and aggregated across municipalities have been acquired from the Ministry of Public Health of Benin. They focus on the three municipalities located in the health zone of Kandi and have been converted into monthly consultation rates for ALRI thanks to the num-ber of population by age and present health area in the directories of health statistics published annually. After calculations, the ALRI rates are reported to 10,000 children under 5 years old. However, these rates should be multiplied by 3.33 to approach reality as the rate of attendance at public health centers is estimated at 30 % (Godonou, personal communication in 2008) because of the existence of alternatives (self-medication, traditional medicine, and private health centers).
To check the impacts of desert dust on the health of young children, we focus attention on the variability of the monthly ALRI rates during the dry season. The months and the years when people were most affected were determined. The results were then juxtaposed with the dust events having degraded the air quality in the study area. Finally, we attempted to quantify the im-pacts, mainly by comparing the average recorded during the months with and without dust events and by calcu-lating the inter-seasonal variations (throughout the sea-son on the whole and month by month) and intra-seasonal variations.
4 Results
4.1 Determination of Dust Events
A review of the literature exposed 16 dust events in dry seasons between November 1, 2003 and March 31,
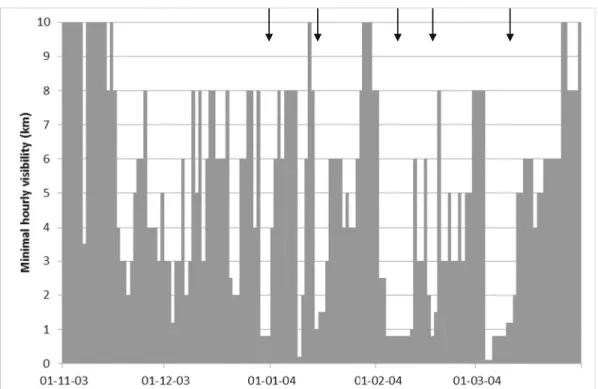
2007 (Table 1) that are likely to have affected the air quality in the region of Kandi, on the basis of the source (Sahara and more particularly the Bodélé depression), the dust path (west and southwest), and/or the affected areas (regions of West Africa). Although the list in Table1is not exhaustive, it certainly includes the most significant dust events in the studied path and gives an idea of the frequency and the monthly breakdown of dust events during the dry seasons in the region of interest. Figure2shows how the minimum hourly vis-ibility during the 2003–2004 dry season has fluctuated. The arrows highlight potential dust events which affect-ed the region of Kandi on the basis of the criteria definaffect-ed in the methodology (at least two consecutive days ex-perienced a minimum hourly visibility below 2 km). Similarly, the analysis of these data series on the whole of the period detected 17 dust events (Table 3). The 2005–2006 dry season recorded relatively high visibility compared to the other three seasons’ visibility levels, with the exception of the period from 8 to 14 March 2006. Finally, the 2006–2007 dry season recorded de-creases in visibility over the entire period, with the strongest events observed in the middle of the dry sea-son rather than at the end of the dry seasea-son.
Throughout the study period, the juxtaposition of information from the two sources used to detect dust events showed ten Saharan dust events affecting the quality of the air breathed in the study area (case 1 in Table2); they are shaded in Table3. These ten events include 61 days in total. In addition, the literature re-vealed six Saharan dust events that likely did not impact the air quality in the study area (case 2 in Table2). This could be explained by an event misidentified in term(s) of source or trajectory in the literature that would actu-ally leave Kandi outside the areas affected by desert aerosols. Dust would be transported somewhere else. There exists a high variability of the dust transport at the surface and over long distances (Klose et al. 2010). Another explanation would be the passage of dust over the area of Kandi at high altitude. Indeed, when the inter-tropical front is moving from the south northward, dust clouds coming from the north are sent in upper layers of the atmosphere (Middleton and Goudie2001). The analysis of the visibility highlighted seven addition-al events during which breathed air quaddition-ality seems to have also been highly degraded in the study area (case 3 in Table 2). These events are probably due to the presence of carbonaceous aerosols and terrigenous aero-sols from other sources near the soil surface.
Carbonaceous aerosols mostly found in December, January, and February are due to the burnbeating widely used in the Sudanian zone (Rajot et al. 2012). Terrigenous aerosols from other sources are mainly from fields with crops and set in motion locally by wind. In the north of Benin, wind erosion, although more limited and less alarming than in the Sahel, is found in the plains around Kandi and Banikoara and locally in the savannas and fallows mainly open where there are surface crusts (de Haan1997).
4.2 Impacts on the Quality of Air Breathed by Population
During the 61 days of dust events that have affected the air quality in the study area, Kandi has recorded a daily average PM10 concentration of 1017 μg m−3 against
55 μg m−3 during the other days, a value 18.5 times higher during dust events. The dust event from 25 to 27 February 2005 recorded the highest average concentra-tion throughout the study period (1782μg m−3). The highest daily average concentrations during the study period were, meanwhile, 3127 and 2635 μg m−3and were recorded February 25, 2005 and on March 4, 2004, respectively. The exceptional scale and the regional Fig. 2 Detection of the potential dust events (arrows) in the daily visibility data in Kandi during the dry season 2003–2004
Table 3 Dust events identified on the basis of the analysis of minimum hourly visibility data in the station of Kandi during the dry seasons from 2003 to 2007
ID Onset of the event
Offset of the event
Mean daily PM10concentrations
over the event (μg m−3)
1 20/12/2003 22/12/2003 346 2 29/12/2003 31/12/2003 766 3 14/01/2004 16/01/2004 513 4 2/02/2004 10/02/2004 868 5 16/02/2004 18/02/2004 611 6 4/03/2004 12/03/2004 1197 7 06/01/2005 14/01/2005 1387 8 1/02/2005 4/02/2005 484 9 12/02/2005 15/02/2005 434 10 25/02/2005 27/02/2005 1783 11 4/03/2005 6/03/2005 625 12 17/02/2006 19/02/2006 746 13 8/03/2006 12/03/2006 1066 14 12/12/2006 14/12/2006 941 15 29/12/2006 9/01/2007 1101 16 18/01/2007 20/01/2007 667 17 2/03/2007 4/03/2007 574
Italics show the connections with the events identified in the literature
nature of this last event have also been explored else-where (Ozer2006; Nouaceur2008).
It seems that the effects of desert dust on air quality are more substantial than the effects caused by other types of aerosols. This occurs over the study period in terms of the magnitude of the impacts of the dust events on the daily PM10 concentration (an average of
1017μg m−3on a total of 61 days of dust events against an average of 508μg m−3on 22 days where concentra-tions have likely increased due to the presence of other types of aerosols). The duration of events, evaluated in terms of the number of days where aerosols visibly degrade the air quality, is also more important for desert dust events than for episodes related to other types of aerosols (6.1 successive days on average over ten Saharan dust events, with a maximum of 12 days against an average of 3.1 successive days on seven ‘other’ events with a maximum of 4 days).
4.3 Impacts of Desert Dust on ALRI in Children Under 5 Years Old
The health zone of Kandi that records an annual peak of ALRI rates in March (Fig.3) shows a situation close to what the authors described in Mali with an initial in-crease in the number of ALRI cases during the hot and
dry season and a second during the rainy season (Findley et al.2005; Medina et al.2007). A longitudinal study in a village in Burkina Faso showed that 44 % of fell ill during the 6 months of rainy season and 48 % during the 6 months of dry season. Acute respiratory infections (ARI) accounted for 59 and 73 % of illnesses during the rainy season and the dry season, respectively (Lang et al.1986). Throughout the consultations, 45 % took place for ARI and 24 % specifically for ALRI. From these data, it was possible to calculate that ap-proximately 28 children out of 151 (18.5%) were affect-ed by an ALRI during the dry season in the studiaffect-ed village. Desert dust events are not discussed in this study. For the health zone of Kandi, via a calcula-tion based on the sum of the monthly average of the 5-month dry season and taking into account the rate of visits to health centers, it is estimated that 13.2 % of children are affected by ALRI during the dry season. Differences in the propor-tion of children affected by the ALRI in the vil-lage of Burkina Faso and in the Kandi area can be explained by the length of the dry season, certain-ly, but other factors can come into play such as the fact that the study of Lang and his colleagues took place during the great drought (Lang et al.
1986).
Figure4shows the variability of the monthly rate of consultations for ALRI in children under 5 years old during the 5-month dry season between November 1998 and March 2008 in the health zone of Kandi. Rates significantly decreased almost systematically from November to December and to a lesser extent from December to January, except during the dry seasons 2000–2001 and 2001–2002 where there is a slight in-crease in rates between December and January. Conversely, from January to February rates grow, this is also the case from February to March. In general, many dust events are concentrated in the end of the dry season (Koren et al.2006). It is also in this period, at the end of the dry season, that young children are more likely weakened by prolonged exposure to dust (Derbyshire 2007). The dry season 2000–2001 is one
that stands out the most with particularly high rates, especially at the end of the dry season. The monthly average rate during this season was 132 with values close to 180 in February and March. In a study on the follow-up to the Saharan dust storms between January and May 2001, the author noted four strong events be-tween late January and late March that year (OberleN/A). Maximum PM10 concentrations up to 10,240 μg m−3
were recorded at the center of the dust storm. The
average ALRI rates of dry seasons 2001–2002, 2003– 2004, and 2005–2006, respectively, worth 78, 80, and 79 are slightly above the average (74). Conversely, the dry season 2002–2003 recorded the lowest monthly average ALRI rate (51). It seems it had been relatively spared in terms of dust events.
From a quantitative point of view, it is difficult to calculate precisely, on the basis of available data, the progression of ALRI rates attributable solely to the Saharan dust as this could be done in other contexts, often on a smaller population, a very short period of time, and/or a less extensive area (Meng and Lu2007; Middleton et al. 2008; Monteil 2008; Samoli et al.
2011). So, throughout the dry months of the 2003–
2007 period, we were able to estimate that monthly ALRI rates increased on average 12.5 % during the months affected by the ten dust events in comparison with the months of dry season that experienced no dust events. This increase is above 18 % if we exclude the months of November where a single dust event has been registered and where high rates are probably explained by other processes (change of season). Because dust events last an average of 6 days, the use of health data in a shorter time step (decadal or daily) might lead to more accurate results. The month of March 2004
Fig. 4 ALRI rates in children under 5 years old over the dry seasons (5 months) between November 1998 and March 2008 in the health zone of Kandi
recorded an ALRI rate among the highest (141, an increase of 163 % between January and March) while three major dust events were recorded during the period of February–March 2004, with significant impacts on visibility and PM10 concentrations. Throughout the
10 years of health data, monthly ALRI rates vary by as much as 100 % within a dry season. When analyzing the inter-annual variations for each month of the dry season, it can be seen that ALRI rates vary by a factor of 2 in December (38 in December 1998, 80 in December 200) to a factor of 4 in February (45 in February 2007, 183 in February 2000).
5 Discussion
Recently, in a paper about the climate as a risk factor for health in West Africa published in the framework of the AMMA project (African Monsoon Multidisciplinary Analyses), the authors evoke the cases of malaria, chol-era, and meningitis based on several references of stud-ies but respiratory infections are not mentioned (Martiny et al.2012). To fill this gap, we used an original database on ALRI consultations of children under 5 years old over several years in a health zone of Northern Benin. The combination of the two sources of data to detect the presence of desert dust in the lower layers of the atmo-sphere is a highlight of this study since it allows us to target and validate the intrusions of desert dust in the air breathed by the population. From this point of view, it differs from the studies that use remote sensing to iden-tify dust storms, without really making sure that it is the lower layers of the atmosphere which are concerned (Middleton et al.2008). However, in some cases, like the study of the relation between desert dust and men-ingitis epidemics in the Sahel, the use of aerosol index based on remote sensing data seems efficient (Deroubaix et al.2013).
The results of this study are still preliminary because analysis opportunities have been limited for several reasons. First, the reliability of treated health data is reduced. Indeed, alongside missing data and encoding-related errors, there are errors due to incorrect diagnoses. Seeing that non-clinical diagnostics are made in the rural health centers and the ALRI often occur in association with other infections (diarrhea) or unsanitary living conditions (malnutrition), the risk of having data sub-ject to errors is high. Moreover, some additional un-quantifiable biases also exist (attendance, traditional
medicine, distance, variation of financial resources in the year…). Then, the time step of health data is not optimal. Intense dust storms are usually short-lived, even though they may cover several consecutive days, and according to published studies, the clinical time between exposure and the onset of the disease would also be short (Meng and Lu 2007; Cheng et al.2008; Monteil2008).
The acquisition of data to a finer time step appears essential to improving analysis and refining the results. Finally, we must bear in mind that significant increases in ALRI rates during the dry season are not attributable only to the presence of desert dust in the air inhaled even if they seem to have a direct impact in most cases. As mentioned previously, carbonaceous aerosol and other terrigenous dust related to the activities of culture soils are also present in the air, at the height of human activities, during this time of the year (de Haan1997; Rajot et al. 2012). Their inclusion should allow for a better identification of the exact role of desert dust in the degradation of the air quality and determine more pre-cisely the impacts on the respiratory health of children. Moreover, a study on the potential role of other meteo-rological factors had also highlighted a resurgence of ALRI cases during the dry seasons with temperatures and the lowest minimum relative humidities (de Longueville et al.2013c).
The first results should encourage the improvement of the health data acquisition system and further re-search on the subject. It would be also relevant to reproduce this kind of study in a Sahelian zone but the data access is more problematic.
6 Conclusions
During the dry seasons of the period 2003–2007, ten dust events found in the literature had significant im-pacts on the quality of the air in the health zone of Kandi. Significant decreases in visibility on some con-secutive days and an average multiplication by 18.5 of the daily PM10 concentrations were recorded at the
meteorological station of Kandi during these events. Through access to thus far unexploited health data and despite the time step at which they are available, some interesting elements emerged from this study. In the study area, direct confrontation between the dust events data and health data showed good consistency both at the level of the whole seasons and the level of the most
affected months by dust events. Monthly ALRI rates vary on average from simple to double during the dry season. The increase in the consultations for ALRI is progressive and generally peaks at the end of the dry season. The months experiencing dust events have an average increase of 12.5 % of their ALRI rates com-pared to the other months. However, the combination of the relatively short duration of dust events, the monthly time step of health data, and the role played by other factors not studied here makes the precise quantification of dust impacts difficult in comparison with other re-gions of the world. Daily data of medical consultations should allow for more specific statistical methods, a refinement of the results and a more accurate evaluation of the effects of a particular dust event on the respiratory health of the young people of this area. Taking account of other sources of air pollution should also be consid-ered to improve overall understanding of the phenome-non and the specific role played by desert dust in the increase of ALRI cases in children under 5 years old during the dry season within this Western African region.
Acknowledgments The authors gratefully acknowledge the Ministry of Public Health of Benin for providing health data and Bernadette Chatenet (technical aspects), Jean-Louis Rajot and Béatrice Marticorena (data collection) for allowing us to use PM10 data from Banizoumbou (Niger), recorded in the scope of the international African Monsoon Multidisciplinary Analysis (AMMA) program at three stations comprising the so-called ‘Sa-helian Dust Transect’. We thank Caroline Zickgraf for English proofreading and the reviewer for insightful readings and con-structive suggestions.
References
Cheng, M. F., Ho, S. C., Chiu, H. F., Wu, H. F., Chen, P. S., & Yang, C. Y. (2008). Consequences of exposure to Asian dust storm events on daily pneumonia hospital admissions in Taipei, Taiwan. Journal of Toxicology and Environmental Health Part A, 71, 1295–1299.
D’Almeida, G. A. (1986). A model for Saharan dust transport. Journal of Applied Meteorology and Climatology, 25, 903– 916.
de Haan, L. (1997). Agriculteurs et éleveurs au Nord-Bénin: Ecologie et genres de vie. Paris: Karthala Editions. de Longueville, F., Ozer, P., Doumbia, S., & Henry, S. (2013a).
Desert dust impacts on human health: an alarming worldwide reality and a need for studies in West Africa. International Journal of Biometeorology, 57(1), 1–19.
de Longueville, F., Hountondji, Y. C., Ozer, P., Marticorena, B., Chatenet, B., & Henry, S. (2013b). Saharan dust impacts on
air quality: what are the potential health risks in West Africa? Human and Ecological Risk Assessment, 19(6), 1595–1617. de Longueville, F., Hountondji, Y. C., Djivo, P., & Henry, S. (2013c). Relations potentielles entre infections respiratoires aiguës basses et conditions météorologiques au Bénin. Environnement Risque et Santé, 12, 139–150.
Derbyshire, E. (2007). Natural minerogenic dust and human health. AMBIO: A Journal of the Human Environment, 36(1), 73–77.
Deroubaix, A., Martiny, N., Chiapello, I., & Marticoréna, B. (2013). Suitability of OMI aerosol index to reflect mineral dust surface conditions: Preliminary application for studying the link with meningitis epidemics in the Sahel. Remote Sensing of Environment, 133, 116–127.
Engelstaedter, S., Tegen, I., & Washington, R. (2006). North African dust emissions and transport. Earth Sciences Research, 79, 73–100.
Findley, S.E., Doumbia, S., Medina, D.C., Guindo, B., Toure, M.B., Sogoba, N., et al. (2005). Season-smart: how knowl-edge of disease seasonnality and climate variability can re-duce childhood illness in Mali. IUSSP XXV International Population Conference (session 905: Climate, Population, and Health), Tours, France, 18-23 July 2005.
Garrison, V. H., Majewski, M. S., Foreman, W. T., Genualdi, S. A., Mohammed, A., & Massey Simonich, S. L. (2014). Persistent organic contaminants in Saharan dust air masses in West Africa, Cape Verde and the eastern Caribbean. Science of the Total Environment, 468, 530–543.
Goudie, A. S. (2014). Desert dust and human health disorders. Environment International, 63, 101–113.
Goudie, A. S., & Middleton, N. J. (2006). Desert dust in the global system. Berlin: Springer
Griffin, D. W. (2007). Atmospheric movement of microorganisms in clouds of desert dust and implications for human health. Clinical Microbiology Reviews, 20, 459–477.
Hao, X., Qu, J.J. (2007). Saharan dust storm detection using moderate resolution imaging spectroradiometer thermal in-frared bands. Journal of Applied Remote Sensing, 1, DOI: 10.1117/1.2740039.
Klose, M., Shao, Y., Karremann, M.K., Fink, A. H. (2010). Sahel dust zone and synoptic background. Geophysical Research Letters, 37(9).
Knippertz, P., & Fink, A. H. (2006). Synoptic and dynamic aspects of an extreme springtime Saharan dust outbreak. Quarterly Journal of the Royal Meteorological Society, 132(617), 1153–1177.
Koren, I., Kaufman, Y. J., Washington, R., Todd, M. C., Rudich, Y., Vanderlai Martins, J., et al. (2006). The Bodélé depression: a single spot in the Sahara that pro-vides most of the mineral dust to the Amazon forest. Environmental Research Letters, 1, 1–5. doi:10.1088/ 1748-9326/1/1/014005.
Lang, T., Lafaix, C., Fassin, D., Arnaut, I., Salmon, B., Baudon, D., & Ezekiel, J. (1986). Acute respiratory infections: a longitudinal study of 151 children in Burkina Faso. International Journal of Epidemiology, 15, 553–556. Léon, J. F., Derimian, Y., Chiapello, I., Tanré, D., Podvin, T.,
Chatenet, B., et al. (2009). Aerosol vertical distribution and optical properties over M'Bour (16.96° W; 14.39° N), Senegal from 2006 to 2008. Atmospheric Chemistry and Physics, 9(23), 9249–9261.
Li, J., Zhang, P., Schmit, T. J., Schmetz, J., & Menzel, W. P. (2007). Technical note: Quantitative monitoring of a Saharan dust event with SEVIRI on Meteosat-8. International Journal of Remote Sensing, 28, 2181–2186. Lindén, J., Boman, J., Holmer, B., Thorsson, S., & Eliasson, I.
(2012). Intra-urban air pollution in a rapidly growing Sahelian city. Environment International, 40, 51–62. Liousse, C., Galy-Lacaux, C. (2010). Urban pollution in West
Africa. Meteorologie. 8 e serie, 8(71), 45-49.
Mallone, S., Stafoggia, M., Faustini, A., Gobbi, G. P., Marconi, A., & Forastiere, F. (2011). Saharan dust and associations between particulate matter and daily mortal-ity in Rome, Italy. Environmental Health Perspectives, 119(10), 1409.
Marticorena, B., Chatenet, B., Rajot, J.-L., Traoré, S., Coulibaly, M., Diallo, A., et al. (2010). Temporal variability of mineral dust concentrations over West Africa: Analyses of a pluriannual monitoring from the AMMA Sahelian dust tran-sect. Atmospheric Chemistry and Physics, 10, 8899–8915. doi:10.5194/acp-10-8899-2010.
Martiny, N., & Chiapello, I. (2013). Assessments for the impact of mineral dust on the meningitis incidence in West Africa. Atmospheric Environment, 70, 245–253.
Martiny, N., Dessay, N., Yaka, P., Toure, O., Sultan, B., Rebaudet, S., et al. (2012). Le climat, un facteur de risque pour la santé en Afrique de l’Ouest. La Météorologie, N° Spécial Amma, 73-79.
Medina, D. C., Findley, S. E., Guindo, B., & Doumbia, S. (2007). Forecasting non-stationary diarrhea, acute respi-ratory infection, and malaria time-series in Niono, Mali. PLoS ONE, 2(11), e1181. doi:10.1371/journal.pone. 0001181.
Meng, Z. Q., & Lu, B. (2007). Dust events as a risk factor for daily hospitalization for respiratory and cardiovascular diseases in Minqin, China. Atmospheric Environment, 4133, 7048– 7058.
Middleton, N. J., & Goudie, A. S. (2001). Saharan dust: Sources and trajectories. Transactions of the Institute of British Geographers, 26, 165–181.
Middleton, N. J., Yiallouros, P., Kleanhous, S., Kolokotroni, O., Schwartz, J., Dockery, D. W., et al. (2008). A 10-year time-series analysis of respiratory and cardiovascular morbidity in Nicosia, Cyprus: the effects of short-term changes in air pollution and dust storms. Environmental Health, 7, 39. doi:10.1186/1476-069X-7-39.
Monteil, M. A. (2008). Saharan dust clouds and human health in the English-speaking Caribbean: what we know and don’t know. Environmental Geochemistry and Health, 30, 339– 343.
Nastos, P. T., Kampanis, N. A., Giaouzaki, K. N., & Matzarakis, A. (2011). Environmental impacts on human health during a Saharan dust episode at Crete Island, Greece. Meteorologische Zeitschrift, 20(5), 517–529.
Nouaceur, Z. (2004). Brume sèche, brume de poussière, chasse-sable et tempête de chasse-sable. Norois, 191, 121–128.
Nouaceur, Z. (2008). Apport des images-satellite dans le suivi des nuages de poussières en zones saharienne et sub-saharienne. Revue Télédétection, 8(1), 5–15.
Oberle, F. (N/A). Monitoring of easterly Saharan dust storm.http:// www.higp.hawaii.edu/spacegrant/reports/10_SP01-FA01/ Oberle.pdf. Accessed 15 March 2014.
Ozer, P. (2005). Estimation de la pollution particulaire naturelle de l’air en 2003 à Niamey Niger à partir de données de visibilité horizontale. Environnement Risques et Santé, 4, 43–49. Ozer, P. (2006). Dust in the wind and public health: Example from
Mauritania. International conference: desertification, health, remediation and local governance (pp. 55–74). Brussels: Royal Academy for Overseas Sciences United Nations. 22 September 2006.
Ozer, P., Bodart, C., & Tychon, B. (2005). Analyse climatique de la région de Gouré, Niger oriental: récentes modifications et impacts environnementaux. CyberGeo: European Journal of Geography, 308, 1–24.
Ozer, P., Ould Mohamed Laghdaf, M. B., Ould Mohamed Lemine, S., & Gassani, J. (2007). Estimation of air quality degradation due to Saharan dust at Nouakchott, Mauritania, from hori-zontal visibility. Water, Air, & Soil Pollution, 178, 79–87. Perez, L., Tobías, A., Querol, X., Pey, J., Alastuey, A., Díaz, J., &
Sunyer, J. (2012). Saharan dust, particulate matter and cause-specific mortality: a case–crossover study in Barcelona (Spain). Environment International, 48, 150–155.
Prospero, J. M., Ginoux, P., Torres, O., Nicholson, S. E., & Gill, T. E. (2002). Environmental characterization of global sources of atmospheric soil dust identified with the nimbus 7 total ozone mapping spectrometer (TOMS) absorbing aerosol product. Review of Geophysics, 40, 2-1–2-31. doi:10.1029/ 2000RG000095.
Rajot, J.-L., Touré, A.A., Desboeufs, K., Formenti, P., Marticorena, B., Sow, M. (2012). Le cycle des aérosols terrigènes au Sahel: ce qu’AMMA nous a appris. La Météorologie, N° Spécial Amma, 33-40.
Redelsperger, J.-L., Diedhiou, A., Flamant, C., Janicot, S., Lafore, J.-P., Lebel, T., et al. (2006). AMMA, une étude multidisciplinaire de la mousson ouest-africaine. La Météorologie, 22-32.
Samoli, E., Nastos, P. T., Paliatsos, A. G., Katsouyanni, K., & Priftis, K. N. (2011). Acute effects of air pollution on pediat-ric asthma exacerbation: Evidence of association and effect modification. Environmental Research, 111, 418–424. Sandstrom, T., & Forsberg, B. (2008). Desert dust. an
unrecog-nized source of dangerous air pollution? Epidemiology, 19, 808–809.
Slingo, A., Ackerman, T. P., Allan, R. P., Kassianov, E. I., McFarlane, S. A., Robinson, G. J., et al. (2006). Observations of the impact of a major Saharan dust storm on the atmospheric radiation balance. Geophysical Research Letters, 33(24).
Straif, K., Cohen, A., Samet, J. (eds) (2013). Air pollution and Cancer. IARC Scientific Publication N°161.
Tulet, P., Mallet, M., Pont, V., Pelon, J., & Boone, A. (2008). The 7-13 March 2006 dust storm over West Africa: Generation, transport and vertical stratification. Journal of Geophysical Research, 113, D00C08. doi:10.1029/2008JD009871. Val, S., Liousse, C., El Hadji Thierno Doumbia, C. G., Lacaux, H.
C., Marchand, N., Badel, A., et al. (2013). Physico-chemical characterization of African urban aerosols (Bamako in Mali and Dakar in Senegal) and their toxic effects in human bronchial epithelial cells: description of a worrying situation. Particule and Fibre Toxicology, 10(1), 10. doi: 10.1186/1743-8977-10-10.
van Donkelaar, A., Martin, R. V., Brauer, M., Kahn, R., Levy, R., Verduzco, C., & Villeneuve, P. J. (2010). Global estimates of
ambient fine particulate matter concentrations from satellite-based aerosol optical depth: Development and application. Environmental Health Perspectives, 118(6), 847.
Wagner, R., Ajtai, T., Kandler, K., Lieke, K., Linke, C., Müller, T., et al. (2012). Complex refractive indices of Saharan dust samples at visible and near UV wavelengths: a laboratory
study. Atmospheric Chemistry and Physics, 12(5), 2491– 2512.
WHO. (2012). http://gamapserver.who.int/mapLibrary/Files/ Maps/Global_pm10_cities_2003_2010.png. Accessed 25 November 2013.
WMO. (1992). International meteorological vocabulary. Geneva: World Meteorological Organization.