HAL Id: hal-00845944
https://hal.archives-ouvertes.fr/hal-00845944
Submitted on 18 Jul 2013HAL is a multi-disciplinary open access archive for the deposit and dissemination of sci-entific research documents, whether they are pub-lished or not. The documents may come from teaching and research institutions in France or abroad, or from public or private research centers.
L’archive ouverte pluridisciplinaire HAL, est destinée au dépôt et à la diffusion de documents scientifiques de niveau recherche, publiés ou non, émanant des établissements d’enseignement et de recherche français ou étrangers, des laboratoires publics ou privés.
Sâannibè Ciryle Some, Vincent Gaudefroy, Didier Delaunay
To cite this version:
Sâannibè Ciryle Some, Vincent Gaudefroy, Didier Delaunay. Warm mix asphalt: mechanical perfor-mance assessment and coating quality evaluation. 2nd International Symposium on Asphalt Pavement and Environment, Oct 2012, France. 12p, ill., bibliogr. �hal-00845944�
Warm mix asphalt: mechanical performance assessment
and coating quality evaluation
Saannibe Ciryle SOME, LUNAM Université IFSTTAR, France Vincent GAUDEFROY, LUNAM Université IFSTTAR, France
Didier DELAUNAY, Laboratoire de Thermocinétique de l’École Polytechnique de l’Université de Nantes, UMR CNRS 6607,France
ABSTRACT: Asphalt mix manufacturing requires heating and the drying of aggregates. The induced energy cost has opened the way to develop alternatives processes with low energy/ carbon materials such as Warm Mix (WMA). Their manufacturing requires specifics techniques to achieve similar performances to those of Hot Mix (HMA). However, the manufacturing temperature reduction can locally lead to imperfect bonding between bitumen and aggregates, although bonding quality measurement remains a challenge.
This paper deals with mechanical performance of some mixes manufactured according to WMA processes in comparison to HMA. In addition, bitumen was extracted from the mixes and its rheological properties were studied. In a second step, the bonding quality was assessed by studying the heat fluxes exchanged between hot bitumen and warm aggregate in asphalt mix manufacturing conditions. This approach is based on the Thermal Contact Resistance (TCR) assessment at the binder / aggregate interface. The TCR reflects the contact imperfection at the microscopic scale when two materials are put into contact. This TCR was proposed as bonding quality indicator. Our studies showed that bonding quality depends on bitumen and aggregate temperatures during the contact. The higher the component’s temperatures, the lower the TCR values and better the bonding quality.
1. Introduction
Hot mix manufacturing requires the heating and the drying of the coarse aggregates. This operation induces high energy consumption. In the last decade, road companies have developed new processes based on energy consumption reduction. In these processes, the coarse aggregates temperature could be reduced significantly. In addition specific additives were generally used to ensure mechanical performances equivalent to those of HMA. The bituminous mixes mechanical performance depend on many parameters such as mixing temperature, mix air voids, the nature of components and bonding quality between binder and aggregates.
During the heating and the mixing operations, hot bitumen has low viscosity (about 0.2 Pa.s) which allows it to wet aggregate surface and to penetrate into the aggregate roughness. As a result when the mixture temperature decreases down to room temperature, mineral aggregates are bonded. Nowadays, there is no test to assess the bonding quality between aggregates and bitumen during the asphalt mixture manufacturing. Some tests such as pull-off tests are often conducted at room temperature to assess bonding between bitumen and aggregate [1]. To study the bonding from this test requires that the failure appears only at the interface between bitumen and aggregate. The main problem of this test is the fact that the failure is generally adhesive and cohesive. This does not facilitate the study of defects related to bonding.
This paper is divided into two parts:
Firstly, this paper deals with complex modulus, fatigue resistance and stripping testing of some bituminous mixes manufactured at warm temperatures according to WMA processes described in reference [2] compared with HMA. In addition, bitumen was extracted from mixtures and characterized by complex modulus testing.
The second must aims to assess the bonding quality between aggregates and bitumen during the manufacturing condition. A device has been developed to heat bitumen and
aggregate at different temperatures and to put them into contact. From the heat flux exchanged between the bitumen and the substrate, it is possible to say if the contact is perfect or not. The thermal contact resistance (TCR) which depends on the heat flux and the temperatures was interpreted as a bonding quality indicator. A similar method was previously used by Le Goff et al [3] to study thermoplastic material properties during their solidification on a metallic substrate at room temperature.
Our studies have shown that bonding quality depends on bitumen and aggregate temperatures during contact. The higher the component’s temperature, the lower the TCR values and better is the bonding quality. Moreover, we found that TCR value decreased when bitumen was doped.
2. Materials
The bitumen used for this study has the following characteristics: 35 dmm pen grade, softening point of 53.5 °C, with a viscosity of 0.2 Pa.s at the mixing temperature, ie. 160°C. The aggregates were dioritic and came from the “La Noubleau” quarry (France). Five fractions were used: sand 0/2 mm and stones 2/4 mm, 4/6 mm, 6/10 mm and 10/14 mm. These materials were of very good quality (Los Angeles Abrasion from 9 to 13). The filler was limestone type and came from Méac (France).
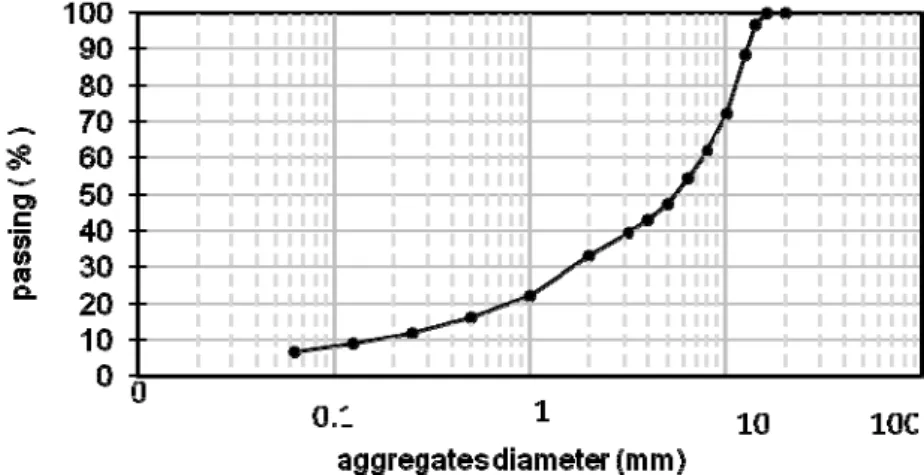
The control asphalt mixture was a GB which is a French dense asphalt mixture for base courses. The bitumen content was 4.78 pha (per hundred aggregate, by mass). Figure 1 presents the grading curves and Table 1 gives information about additive contents, mix air voids contents and aggregate temperatures. In this study, several aggregate’s temperatures and additive contents have been used.
Figure 1: Grading curve of aggregates
The notations HM and WM referred to Hot Mix and Warm Mix respectively while the subscript
ref referred to reference. Then, HM_ref is the reference hot mix asphalt in which the entire
granular fraction was heated to 160°C and WM_ref, the reference warm mix manufactured without additive. For the other warm mixes, we adopted the following notation: WM_Ai_X%. Where Ai is the name of the additive used (i=1,2) and X%, the additive content referred to by mass of bitumen. Two additives named A1 and A2 were used in the warm mixes processes. In mixes WM_A1_5%, WM_A1_0.5%, WM_A2_5%, WM_A2_0.5% and WMA_ref, 25% of the sand (max diameter of 2mm) are moist and not heated. The added water constitutes 1.5% of the mixture mass. For HM_ref mixing time is two minutes and four minutes for the other WMA (two minutes for aggregates coating and two minutes after the wet sands incorporation).
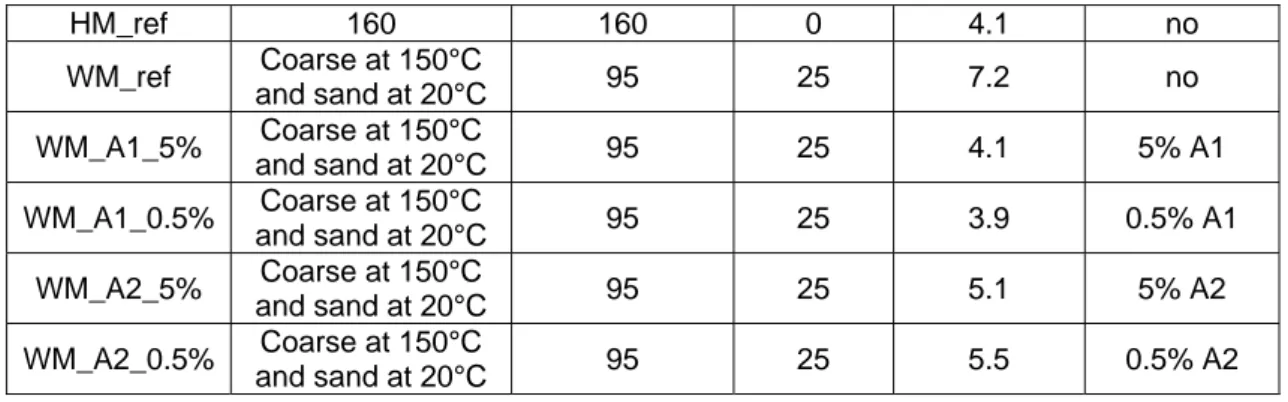
Table 1: Binder content, air voids content, aggregate’s temperatures and additives used for mixes Mixes Aggregate’s temperatures (°C) Manufacturing temperature (°C) Wet sand addition (%) Mixes air voids content (%) Additives
HM_ref 160 160 0 4.1 no WM_ref Coarse at 150°C and sand at 20°C 95 25 7.2 no WM_A1_5% Coarse at 150°C and sand at 20°C 95 25 4.1 5% A1 WM_A1_0.5% Coarse at 150°C and sand at 20°C 95 25 3.9 0.5% A1 WM_A2_5% Coarse at 150°C and sand at 20°C 95 25 5.1 5% A2 WM_A2_0.5% Coarse at 150°C and sand at 20°C 95 25 5.5 0.5% A2
3. Complex modulus of mixes
The complex modulus was carried out according to the two-point bending method with trapezoidal specimens (standard EN 12697-26). Samples were cut from large asphalt mix slab (L=600, W=400 and H=150 mm). The asphalt mixtures manufactured were matured for a 3-week period minimum. Specimen beams were obtained by cuting the slab one week after the slab production and were left for 15 days at room temperature.
The measurement system is composed on a thermo-regulated chamber for specimen temperature control. The sample load system is coupled to a control system run by a computer. The principle consists of applying a low strain (50x10-6) to avoid fatigue cracking to a trapezoidal specimen. Four trapezoidal beams were tested for a given asphalt mixture, at various temperatures (-10, 0, 10, 15, 20, 30 and 40°C) and for each temperature at various loading frequencies (1, 3, 10, 25, 30 and 40 Hz). The complex modulus results were used to generate master curves at a reference temperature of 15°C using a shifting procedure. The mix master curves are represented on Figure 2 at a reference temperature Ts.
Figure 2: Master curves at Ts=15°C for mixes in complex modulus two points bending test From Figure 2, we found significant stiffness reduction for mix WM_A1_5% and WM_A2_5%. The stiffness reduction of these mixes is due to the additive effects that reduce significantly the doped bitumen stiffness as we will see in section 4. Although these additives improve the workability and the adhesion between the bitumen and the aggregates their dosage must be controlled for adequate mechanical performances.
Table 2: Values of parameters corresponding to complex modulus test
Mixes |E*| MPa
15°C and 10Hz Specification (EN-1297-26) HM_ref 14522 10000 WM_ref 14933 10000 WM_A1_5% 5623 10000 WM_A1_0.5% 13198 10000 WM_A2_5% 8896 10000 WM_A2_0.5% 13567 10000
Table 2 shows that the complex modulus of mixes WM_A1_5% and WM_A2_5% with 5% additives are below the specification while mixes WM_A1_0.5% and WM_A2_0.5% containing 0.5% additives have their complex modulus higher than the specification value. From Figure 2 and Table 2, WMA with 0.5% additives have similar stiffness properties to the reference WM_ref and higher than the specification value. No significant difference was also noted between WM_ref, HM_ref, WM_A1_0.5% and WM_A2_0.5% over 0.01Hz. This can be explained by the bitumen ageing in these two processes. In HMA the coating was made at 160°C whereas in WMA process the coating was made at à 150°C before the wet sand addition. The mixing temperature is lower in WMA case, but the mixing time is twice as long. Figure 2 and Table 2 show that additive effects are predominant in mixes WM_A1_5% and WM_A2_5% in comparison with WM_A1_0.5% and WM_A2_0.5%. These results show that a high increase of additives content can be prejudicial to the mix stiffness.
4. Study of fatigue properties
The fatigue tests were carried out with a two-point bending machine according to standard EN-12697-24. Twelve trapezoidal specimens were subjected to three displacement levels (3x4 specimens). The system applies a sinusoidal load at the trapezoidal specimen top until its breaks. By the means of a displacement control application at fixed temperature and frequency (10°C and 25 Hz), it is possible to predict fatigue life of asphalt pavement by assessing its crack initiation resistance. The fatigue or Wölher curves are determined by statistical analysis of the pairs of results (strain amplitude and lifetime in number of cycles). From this analysis, the characteristics of the fatigue curve (y-intercept, a) are determined, particularly the slope of the fatigue curve 1/b (b is approximately -0.2 for bituminous materials), the value of the relative strain ε6 for a lifetime of 106
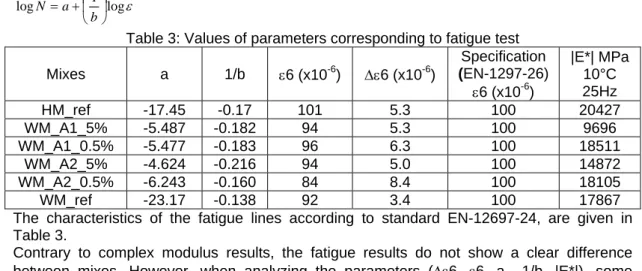
cycles and two criteria measuring the test scatter. Δε6 measured test quality. The fatigue curve is given by the following equation: ε log 1 log ⎟ ⎠ ⎞ ⎜ ⎝ ⎛ + = b a N
Table 3: Values of parameters corresponding to fatigue test Mixes a 1/b ε6 (x10-6) Δε6 (x10-6) Specification (EN-1297-26) ε6 (x10-6 ) |E*| MPa 10°C 25Hz HM_ref -17.45 -0.17 101 5.3 100 20427 WM_A1_5% -5.487 -0.182 94 5.3 100 9696 WM_A1_0.5% -5.477 -0.183 96 6.3 100 18511 WM_A2_5% -4.624 -0.216 94 5.0 100 14872 WM_A2_0.5% -6.243 -0.160 84 8.4 100 18105 WM_ref -23.17 -0.138 92 3.4 100 17867 The characteristics of the fatigue lines according to standard EN-12697-24, are given in Table 3.
Contrary to complex modulus results, the fatigue results do not show a clear difference between mixes. However, when analyzing the parameters (Δε6, ε6, a, -1/b, |E*|), some differences are observed. Regarding the Δε6, all WMA admissible strains at one million
cycles are close to the specification value (100 µstrain) except WM_A2_0.5%. Table 3 results show homogeneous scattering of Δε6 and ε6 results, excepted WM_A2_0.5% in which ε6 value is low (84x10-6) and the Δε6 reaches the value of 8.4. This result seems a bit inconsistent, will be check up in future experiments. Table 3 show that the slopes (-1/b) of fatigue lines are similar except WM_ref due probably to the high air void content in the specimens of this mix. The fatigue life of stiffer mix with high air void contents can be reduced significantly because local defects propagate faster in the sample. This increases the degradation rate which increases the value of the slope of the fatigue curve. In this study it is the slopes of the fatigue curves that are affected compared to the ε6 values.
5. Water sensitivity
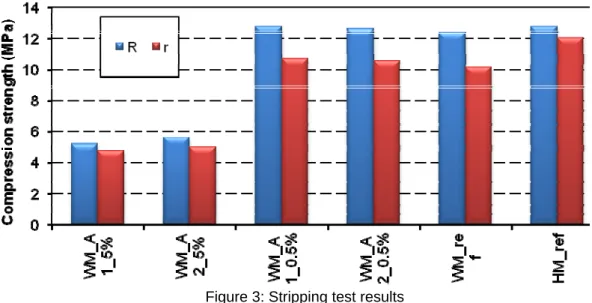
The stripping tests were carried out with a simple compression machine. The cylindrical specimens used for determining water sensitivity (according to EN 12697-12) were compacted in cylindrical molds with 120 mm diameter. Ten cylindrical specimens were manufactured. Half of them were stored in a thermoregulated chamber for 18°C during a week and the other half one were subjected to 18°C water immersion for a week. Compression testing was conducted on each specimen. The compression strength results are shown in Figure 3 and Table 4 gives specimen air voids contents and the ratio of the water sensitivity (r/R). Where r is the compression strength of immersed samples and R the compression strength of the non immersed one. From Figure 3, it is clear that mixes WM_A1_5% and WM_A2_5% manufactured with 5% additive have a compression strength two times lower than the mixes manufactured with 0.5% additive. These results are consistent with those of the mixes complex moduli found in section 3. Increasing the additive content leads decreasing to mix performance. However, Table 4 shows that mix WM_A1_5% and WM_A2_5% have low air void content (7% to 7.3%) and high r/R value (0.92 and 0.9) compared to mix WM_A1_0.5% and WM_A2_0.5% (8.8% and 8.9% air void content and 0.84 r/R value for both). Despite the low stiffness of mixes WM_A1_5% and WM_A2_5%, they have better compactability and lower water sensitivity compared to WM_A1_0.5% and WM_A2_0.5%. From Figure 3 and Table 4 results, comparison can be made between mixes WM_A1_0.5%, WM_A2_0.5%, WM_ref and HM_ref. The Compression strength for non immersed specimens (R) are similar for these mixes, while the compression strengths of WM_A1_0.5%, WM_A2_0.5%, WM_ref immersed samples are lower than HM_ref. Despite the presence of additives the r/R values of WM_A1_0.5% and WM_A2_0.5%, are lower even though the compaction is similar to HM_ref. However the water sensitivity parameter (r/R) shows that WM_A1_0.5% and WM_A2_0.5% improve the water-resistance compare to WM_ref result. The lower r/R value is obtained for WM_ref which has the higher air void content. This shows the importance of incorporating the additives in the warm mixes.
Table 4: Stripping test results and air void content
WM_A1_5% WM_A1_0.5% WM_A2_5% WM_A2_0.5% WM_ref HM_ref
r/R 0.92 0.84 0.90 0.84 0.82 0.95
Air void content
(%) 7.30 8.80 7.00 8.90 9.60 8.9
Several studies have shown that mix properties such as complex modulus depend on the bitumen properties. In the next section, we will study the properties of the bitumen extracted from studied mixes to find the manufacturing process effects or the additive effects on bitumen properties.
Figure 3: Stripping test results
6. Binder rheology
Bitumen was extracted from mixes and subjected to complex modulus, penetration and softening point ring and ball tests.
6.1 Binder complex modulus
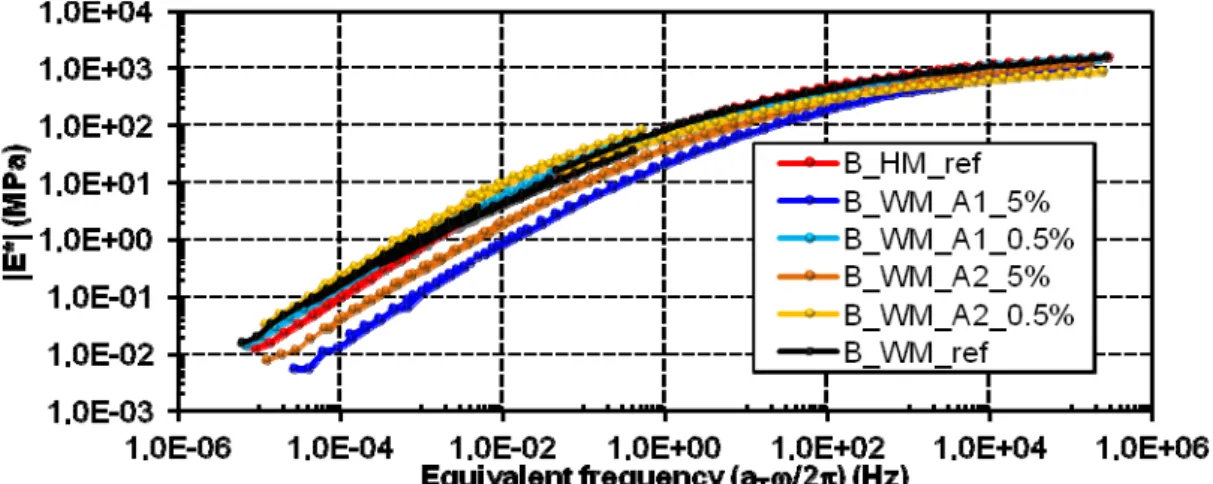
Binder complex modulus tests were performed with a DMA 450 (Metravib apparatus) over a frequency range from 1 to 125 Hz. From -20 to 30°C, traction/compression test was conducted on cylindrical samples. From 30°C to 60°C, the test consisted of annular shearing of hollow cylindrical samples. The tests were conducted in the small strain domain (for strain amplitudes below 10-2 for bitumen) where the bitumen behavior can be considered as linear; therefore, Linear Viscoelastic (LVE) theory can be applied [4]. The resulting master curves for pure and doped bitumen extracted from mixes are shown in Figure 4. This figure reveals that the B_HM_ref manufactured at 160°C has similar complex modulus compared to binders extracted from WMA (B_WM_ref, B_WM_A1_0.5%, and _WM_A2_0.5%) in which the aggregate coating is carried out at 150°C before the wet sand addition. Comparing the binders B_WM_A1_5% and WM_A2_5% with binders B_WM_A1_0.5%, and B_WM_A2_0.5%, extracted from mixes manufactured at 150°C, their complex modulus difference could be explained by the additive A1 and A2 content. These additives are less viscous compared to pure bitumen and lead to decrease the binder viscosity.
From Figures 2 and 4, we can confirm that stiffer binder leads to stiffer mix. It could be noted that additive effects are more noticeable on the complex modulus results than on fatigue results.
6.2 Binders penetration (pen) and softening point (TBA)
In addition to binders complex modulus study which does not shows differences between some binders, the Penetration and softening point test were performed. It is known that asphalt mix manufacturing leads to bitumen ageing which can be evaluated by the penetration test or by the softening point results analysis. The bitumen ageing due to the manufacturing reduces the bitumen penetration due to the oxidation. These phenomena are especially significant when the bitumen is spread in a thin film around the aggregates during manufacturing. It also depends on the manufacturing time. The penetration and softening point test results are shown in Figure 5.
Figure 4: Master curves at Ts=15°C pure and doped bitumen extracted from mixes Softening point
Penetration
Figure 5: Pure and doped extracted bitumen properties
Firstly, it was noted that the bitumen B_HM_ref, B_WM_ref, B_WM_A2_0.5% have low penetration values compared to the original non-aged bitumen and inversely higher softening point values that reflect the ageing effect due to mixes manufacturing. Bitumens B_WM_A1_5%, B_WM_A1_0.5% and B_WM_A2_5% have higher penetration values or lower softening point values than the original bitumen, mainly due to the additives A1 and A2. It was also observed that, at 0.5% the additive A1 softened bitumen unlike additive A2. In a second step, it was found that, bitumen B_HM_ref, B_WM_A2_0.5% and B_WM_ref have low penetration values. In addition, in warm mix asphalt, the mixing time is four minutes against two minutes in the HM_ref. Wet sand addition in warm mix leads to bitumen foaming which increases its specific surface in contact to the oxygen in the air causing more ageing. Bitumen B_WM_A1_0.5%, B_WM_A1_5%, B_WM_A2_5%, have high penetration values because of the additives A1 (0.5% and 5%) and A2 addition (5%). This shows that the mixing time and bitumen foaming cause higher bitumen ageing.
In a third step, from B_WM_A1_5% and B_WM_A2_5%, and from B_WM_A1_0.5% and B_WM_A2_0.5%, that increasing additives content causes significant bitumen softening. This explains the lower complex modulus values observed in the previous section. A comparison of the bitumen B_WM_A1_5% and B_WM_A2_5%, with B_WM_A1_0.5% and B_WM_A2_0.5%, shows that additive A1 causes more softering than additive A2.
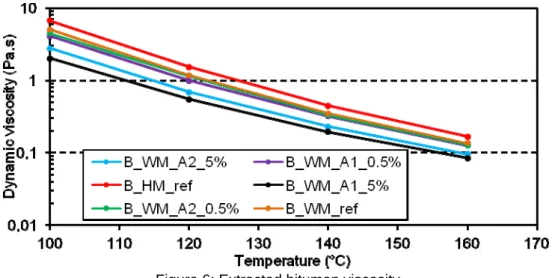
The annular pumping test conducted with the METRAVIB apparatus shows that additives A1 and A2 have modified the extracted binder viscosity during and after the manufacturing as shown in Figure 6. Lower viscosities were obtained for additives A1 at 5%.
Figure 6: Extracted bitumen viscosity
In warm mixes, aggregate temperatures are reduced significantly from 160°C to 100°C. This temperature reduction induced bitumen cooling when it comes into contact with the aggregate. The consequence is the bitumen viscosity increasing. This increase of viscosity does not guarantee good bonding with the aggregates because the binder does not penetrate easily into the aggregate roughness to preserve the mixture against water damage. As mentioned previously, mechanical Pull-off tests are often conducted to investigate the adhesion properties between bitumen and aggregate at room temperature. But, this test does not always ensure adhesive failure. It is therefore difficult to study the bonding defects at the bitumen and aggregate interface. The objective of the next section of our study is to propose a new method to assess the bonding quality between bitumen and aggregate in the asphalt mixture manufacturing condition when both bitumen and aggregate are heated and to study the wettability of doped bitumen at low bitumen and aggregate contact temperatures. Such the Pull-off test, this new method does not yet allow correlations between the bonding quality and the stiffness or the fatigue test of the mixture.
7. Coating quality measurement
7.1 Test principle and experimental device
The purpose of this study is to investigate the bonding quality when hot bitumen is put into contact with hot or warm aggregate during the mixing operation of asphalt mix manufacturing. In the manufacturing of warm mixes, bitumen is generally heated to 160°C while aggregates are heated to a temperature range between 100°C and 150°C. This induced a low cooling rate of bitumen during the aggregate coating. The bitumen cooling leads to its viscosity increasing and can limit its penetration into the aggregate microcavities. The consequence of bad aggregate coating is water sensitivity of the pavement at room temperature. Water is known to delaminate the bitumen and aggregate interface. So, it is important to ensure good bonding between the bitumen and aggregates during mixing operations at high temperature. However, until now, no experiment has measured the bonding quality during the manufacturing step. The experiment performed here allowed to study bonding quality in the manufacturing step.
The bitumen used in this study has the following characteristics: 35 dmm pen grade and softening point of 53.6 °C.
The aggregate substrate (gneiss substrate) consisted of a cylinder cored with 52mm height and 70mm diameter from a block. Its base surface roughness was characterized by an optical profilometer. The arithmetic average of the absolute value of the measured profile height deviation (Ra) was 75µm. Four micro-thermocouples, constituted of wires of 80µm diameter, were placed in the aggregate along its vertical axis. For an accurate implementation of the wires and no disturbance of the heat flux, the substrate was cut along an axial symmetric plane, in two parts. On one of these parts and at different depths from the surface, each wire was soldered on its end on the center line and placed in a thin parallel groove to the aggregate surface to minimize the heat drain. The exact positions of the sensor junctions according to the surface are given in Table 5. They were measured by an optical profilometer before the two parts were precisely re-assembled.
Table 5: Roughness and thermocouples position with respect to the contact interface TC1 TC2 TC3 TC4 Ra
1.48mm 2.91mm 4.39 mm 9.4 mm 75.3 µm
The bitumen specimen thickness is measured before each experiment and depending on the bitumen sample. The thickness of the bitumen specimen is equal to the position of the thermocouple TC5 from the interface.
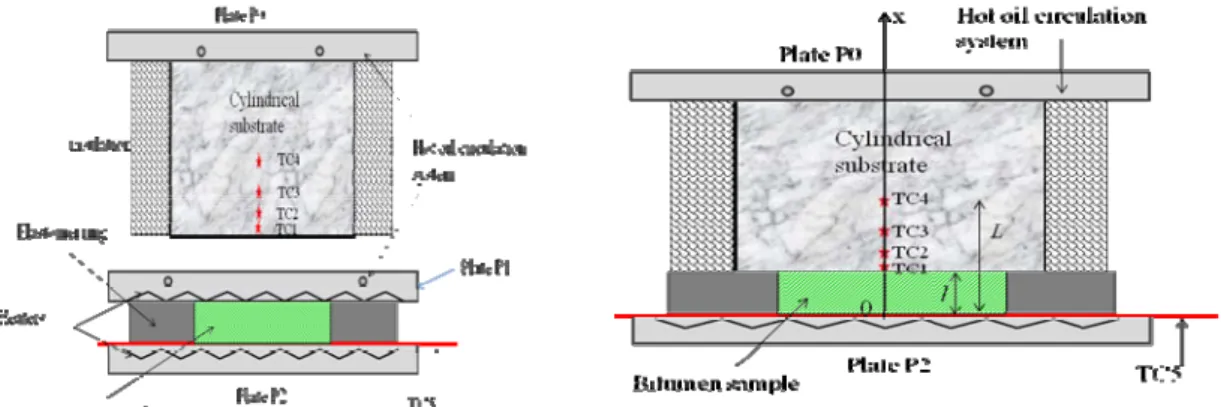
The aggregate substrate sample described previously was insulated and fixed to plate P0 as shown in Figure 7. This plate was equipped with a hot oil circulating system. Then, the top side of the aggregate substrate is heated by the plate P0. Plate P1 is placed at the bottom of the substrate. The upper side of this plate P1 contains the same hot oil circulation system as plate P0. This allows heating of the bottom side of the substrate to ensure uniform temperature T1 in the substrate. The bottom side of plate P1 is equipped with a heater that allows heating of the upper side of the bitumen to temperature T2. A plate P2 located at the bottom of the bitumen sample, and equipped with heaters, ensures the bitumen bottom side heating and achieves uniform temperature T2. The bitumen sample was placed previously in an elastomer ring. When all temperatures are uniform in each sample, plate P1 is removed and the substrate is suddenly put into contact with the hot bitumen sample. After contact establishment, a heat flux flows through the interface. A better thermal contact leads to a greater important heat flux flowing through the interface. The bitumen interface temperature decreases whereas the substrate interface temperature increases. Because of the imperfect contact due to the air trapped in the roughness of the substrate and the heat flux constriction, the bitumen interface temperature is different to the substrate interface temperature. We can then define the thermal contact resistance (TCR) as the temperature difference at the interface over the heat flux at the interface. A small value of TCR means good contact between bitumen and aggregate.
Figure 7: Schematic view of the experimental system before and after contact establishment (respectively left and right)
All the experimental tests were carried out using the following conditions: holding pressure: 0.5 MPa, bitumen temperature: always higher than substrate temperature in asphalt manufacturing conditions, contact duration: 60s.
The samples were initially heated to the required temperatures. Afterwards, the aggregate was put suddenly into contact with the hot bitumen. The temperature evolution was measured by the sensors located in the substrate and at the bitumen bottom. The surface temperatures and heat flux assessment lead to a non-linear inverse heat conduction problem (IHCP) due to the variations of the thermal properties with temperature shown in table 2. For the non-linear case, the unknowns interfacial temperatures Tss(l,t), Tb(l,t) and the interfacial heat flux ϕ(t) need to be determined from the following mathematical formulation of the direct problem in the bitumen and substrate regions between sensors TC5 and TC4 [5].
( ) ( )
(
)
( ) ( ) ² , ² , x t x T t t x T T C T b b b b p ∂ ∂ = ∂ ∂ λ ρ ,0<x<l, f t t< < 0 (1) ( ) ( ) t x t x T l x b b ϕ λ = ∂ ∂ − = , , 0<t<tf (2) ( ) ( ) t x t x T l x g g ϕ λ = ∂ ∂ − = , , 0<t<tf (3) ( ) ( )(
)
( ) ( ) ² , ² , x t x T t t x T T C T g g g g p ∂ ∂ = ∂ ∂ λ ρ , l<x<L, f t t< < 0 (4)(
x t)
T t T =0, = 0( )
f t t< < 0 , (5)(
x Lt)
T t T = , = L( )
f t t , 0< < (6)( ) ( )
x Fx T ,0= , 0≤x≤L (7) ( ) ( )( ) ( ) t t l T t l T t TCR b g ϕ , , − = (8)Where ϕ(t) is the heat flux density through the interface expressed in Wm-2, and TCR the thermal contact resistance expressed in Km²W-1. The boundaries conditions T0(t) and TL(t) are the temperature history measured by the sensors TC4 and TC5. Classical Beck’s method [6] was used to assess the TCR.
7.2 Results and discussion
7.2.1. Effect of component temperatures
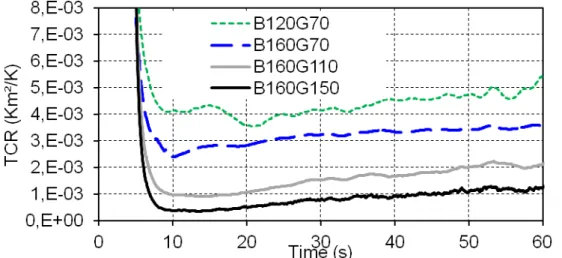
The study of the bonding quality was carried out for several heating cases. The substrate temperature was varied from 70°C to 150°C and the bitumen temperature from 120°C to 160°C. Figure 8 shows the TCR results computed by the Beck’s direct TCR identification method. For simplicity of figures the following notation was chosen: BiGj. This mean that the bitumen (B) was heated to temperature i and the granular substrate (G) was heat to temperature j. According to Figure. 8, it can be noted that the increase of the component temperatures induces a decrease of the TCR value. Higher values of TCR are obtained for B120G70. In this case the bitumen is more viscous and cannot penetrate into the micro-roughness of the aggregate. The smaller values of the TCR are obtained for B160G150. In this case bitumen is very liquid with low viscosity and this ensures good wettability of the rough surface of the substrate. In the cases which the substrate temperature is greater or equal to 110°C, the intantaneousTCR values are not very different. However after a long time these values become different due probably to the difference of the thickness of entrapped air. In these experimental tests, the temperatures of some warm mixes are reproduced. We note that, the reduction of the temperature in the warm mixes can induce a loss of bonding quality.
As explained previously, the TCR is assumed to be established when the bitumen surface temperature is constant.
i Figure 8: Effect of components temperature on TCR results
7.2.2. Effect of additives
In warm asphalt mix manufacturing, road companies generally add some additives to the hot bitumen before putting it into contact with aggregates. The additives role is to reduce bitumen viscosity and / or to improve bitumen spreading over the aggregates. Our study proposes to study the effects of some common additives (A1 and A2) by TCR measurement. These additives are mixed with bitumen before putting the bitumen in the elastomer ring. They are totally soluble in the bitumen. The effects of the additives in terms TCR are shown in Figure 9.
Figure 9: Effect of additives on TCR results
The effect of additives was studied for substrate temperature 150°C and bitumen temperature 160°C. For additive A2 no significant reduction of TCR was be noted compared to the case B160G150 without additive. Additive A2 modifies the bitumen viscosity even at 1% but its effect was not found in our study. In contrast, the additive A1 reduces the TCR value. This additive is known to highly modify the viscosity (see Figure 6), adhesion properties and the mechanical properties of bitumen. The presence of additive A1 at the interface contributes to
improve the heat transfer rate by minimizing the effect of numerous microcavities filled by air. We should mention that TCR values depend on the roughness of the substrate surface and do not take into account the dynamics of the mixing operation. However, this experimental test has the benefic to assess the bonding quality at the manufacturing period.
8. Conclusions
This study consists of two main parts. The first focues on the mechanical performance of WMA with doped bitumen in comparison with a reference HMA and the second is dedicated to the role of the manufacturing temperature on the bitumen and aggregates bonding quality and the additives contribution to bonding quality.
The prime objective was to show the effect of additives and the process on the mechanical behavior in order to compare WMA to HMA. The complex modulus and stripping test have highlighted differences between hot and warm mixes. Poor mechanical performance were noted for warm mixes with 5% additive contrary to warm mixes with 0.5% additive according to the standards. Reference warm mix has also exhibited good mechanical performance. Fatigue test results are good even if they are similar and do not allow differentiating between warm mixes.
The second objective is to present and new coating quality measurement test. The experiments were conducted by varying bitumen and aggregate substrate temperature. The results show that the increase of one of the components induces a decrease of the thermal contact resistance and good bonding in the asphalt manufacturing operation. We also studied the influence of some additives A1 and A2 used for WMA manufacturing processes. The results show that additive A1 improves the coating quality by reducing the TCR value. For additive A2, no significant effect was observed. The TCR results show the importance of heating the components to ensure good bonding of the bitumen to the aggregate in WMA processes.
According to these results, the TCR device could be used to assess and select additive (nature and quantity) to manufacture bituminous mixture regarding influence parameters such as manufacturing temperature and aggregate origin.
9. References
1. Canestrari, F., Cardone, F., Graziani, A., Santagata, F.A. and Bahia, H.U., “Adhesive and cohesive properties of asphalt-aggregate systems subject to moisture damage”, Int J. Road Materials and Pavement design EATA (2010) 11-32.
2. Beduneau, E., Gaudefroy, V., Olard, F., and de la Roche, C. “Enrobés à chauds et semi-tièdes EBT: évaluation performantielle d’une grave-bitume“ RGRA n° 880,(2009) 67-75. [In french]
3. Le Goff, R., Poutot, G., Delaunay, D., Fulchiron, R., and Koscher, E., Study and modeling of heat transfer during the solidification of semi-crystalline polymer, R, Int. J.
Heat and Mass Transfer, N°48 pages 5417-5430, 2005.
4. Ferry, J. D., “Viscoelasticity of polymers” John Wiley and Sons, Inc., (1961).
5. Somé. S.C., Gaudefroy, V., and Delaunay, D., « Méthode thermique d’évaluation de la qualité du collage bitume sur granulat par mesure de la résistance thermique de contact dans les conditions de fabrication d’enrobé bitumineux » Congrès Français de Mécanique, Besançon, France (2011). [In french]
6. Beck, J., Blackwell, B., Charles, R. S., Clair, J., “Inverse Heat Conduction: Ill-posed problems”. Wiley Interscience, (1985).