HAL Id: hal-02159772
https://hal.archives-ouvertes.fr/hal-02159772
Submitted on 19 Jun 2019HAL is a multi-disciplinary open access
archive for the deposit and dissemination of sci-entific research documents, whether they are pub-lished or not. The documents may come from teaching and research institutions in France or abroad, or from public or private research centers.
L’archive ouverte pluridisciplinaire HAL, est destinée au dépôt et à la diffusion de documents scientifiques de niveau recherche, publiés ou non, émanant des établissements d’enseignement et de recherche français ou étrangers, des laboratoires publics ou privés.
Electrochemical behavior of electrode materials (nickel
and stainless steels) for sudomotor dysfunction
applications : a review
Fethi Bedioui, Virginie Lair, Sophie Griveau, Armelle Ringuedé, José Zagal,
Michel Cassir
To cite this version:
Fethi Bedioui, Virginie Lair, Sophie Griveau, Armelle Ringuedé, José Zagal, et al.. Electrochemical behavior of electrode materials (nickel and stainless steels) for sudomotor dysfunction applications : a review. Electroanalysis, Wiley-VCH Verlag, 2018, 30 (11), pp.2525-2534. �10.1002/elan.201800439�. �hal-02159772�
Electrochemical behavior of electrode materials (nickel and
stainless steels) for sudomotor dysfunction applications : a
review
F. Bediouia* , V. Lairb, S. Griveaua, A. Ringuedéb, J.H. Zagalc, M. Cassirb
a Chimie ParisTech, PSL Research University, CNRS, INSERM, Université Paris Descartes, Unité de Technologies Chimiques
et Biologiques pour la Santé, 75005 Paris, France
b Chimie Paristech, PSL Research University, CNRS, Institut de Recherche de Chimie de Paris, 75005 Paris , France
c Laboratorio de Electrocatálisis, Departamento de Química de los Materiales, Facultad de Química y Biología, Universidad de
Santiago de Chile, Alameda 3363, Estación Central, Santiago, Chile * [email protected]
Received: ((will be filled in by the editorial sttaff))
Accepted: ((will be filled in by the editorial sttaff))
Abstract
This is an overview of the electrochemical characterization of nickel and stainless steel as electrodes in medical devices for the early diagnosis of small fiber neuropathy that originates from type-2 diabetes or cystic fibrosis. The electrical current responses obtained during the clinical tests are related to the amount of chloride present on the sweat. Stainless steel electrodes are now used to replace nickel because this later not only presents problems with chloride sensitivity but its contact with skin can cause possible allergic reactions for some patients. For the above reasons, several types of stainless steels were studied. It was shown that some of them perform well and have lower costs than Ni electrodes. We discuss the state of the art of the electrochemical studies conducted with nickel and steels under physiological or biomimetic conditions and discuss the advantages of a particular steel over the others depending on the conditions, especially chloride concentration.
Keywords: nickel, stainless steel, sudomotor dysfynctions, electrochemical conductance, sweat, medical application DOI: 10.1002/elan.((will be filled in by the editorial sttaff))
1. Introduction
Main Diabetes and cardiovascular diseases have increased significantly over the past 20 years. For instance, in the case of type-2 diabetes, over 130,000 cases were estimated in children between 0 and 14 years in 2013 [1]. In the same year, the International Diabetes Federation Atlas revealed that the proportion of undiagnosed diabetes ranged from 20 to 61% [2-7]. Undiagnosed diabetes is considered to account for 40–50% of all kind of diabetes in Europe. Peripheral neuropathy is a frequent complication of diabetes. Such kind of dysfunction is attributed to small fiber neuropathies, that develop early in patients with diabetes [8]. Sweat glands are innervated by small sympathetic fibers and the assessment of sudomotor function has been proposed for evaluating the distribution and severity of these disturbances [9].
Dysfunction of small fiber neuropathy (SFN) can result in autonomic symptoms, sensory symptoms, or a
combination of both. SFN with mixed involvement of both sensory and autonomic fibers is the most common form, affecting millions of individuals worldwide and contributing significantly to morbidity [10-15]. Among the several causes, cardiovascular autonomic neuropathy caused by diabetes mellitus is a common disorder of SFN [14]. It is present in up to 90% of patients with type 1 and 20 -73% of patients with type 2 diabetes mellitus [14], depending on the diagnostic test. Established objective autonomic function tests are available for the evaluation of sudomotor function among which the quantitative sudomotor axon test, the sympathetic skin response and the thermoregulatory sweat test [16]. When cardiovascular autonomic failure is suspected in addition to sudomotor dysfunction, cardiovascular autonomic testing is recommended. Additional methods for evaluating SFN include skin biopsy for the quantification of epidermal nerve fiber density [15] and sudomotor (sweat gland) nerve fiber density [17]. The main difficulty
2
of these techniques arises from the fact that most functional tests quantify the end-organ effect of the autonomic input but not the autonomic nerve function per se.*
Electrochemical skin conductance (ESC) was recently introduced as a simple electrophysiological method for the functional evaluation of sweat glands and related sudomotor/small fiber dysfunction [18-20]. In a recent review, Nowak reported on a systematic analysis of the input of the ESC based sensing devices « Sudoscan » and « EZSCAN » developed by Impeto Medical LTD which have been introduced as a simple noninvasive and fast method for the detection of sudomotor dysfunction [21]. The review summarized and appraised researches using ESC measurements for sudomotor evaluation in adults. The main advantages and drawbacks of ESC versus established tests for evaluating sudomotor/small fiber function were reported to be used as evidence to inform future guidelines on the assessment of sudomotor function. It clearly appears the fact that ESC measurements expand the arsenal of available tests for the evaluation of sudomotor dysfunction. *
The rationale and methodology involving ESC is explained in detail in the review by Nowak [21]. In brief, the measurement of ESC is an active electrophysiological method based on two physical principles [18, 20] : (i) low-voltage electrical activation of sweat glands and (ii) reverse iontophoresis to capture the flow of chloride ions produced by activated sweat glands. ESC measures the flow of chloride ions induced by electric current according to a theoretical model that can be summarized as follow: (i) electric current directly stimulates the sudomotor fibers, innervating the sweat glands ; (ii) subsequently, the glands produce sweat, which contains of chloride ions and (iii) the chloride ions are consumed at the anode, mimicking the corrosion process using principles of reverse electrophoresis. In the present case, chloride ions driven by the electric current can move in an electric field via the sweat adduct pores. *
During ESC measurements, patients place both palms and soles on large-area stainless-steel electrodes. An incremental low direct voltage (< 4 V) is applied for 15 s. The voltage applied on skin electrodes generates a current between the anode and the cathode that is measured. For example, the right-foot electrode is used as an anode, and a voltage of 1 V is applied for 1 s. This induces a voltage on the cathode, i.e., the left-foot electrode, and some small current travels through the body towards the cathode. The voltage occurring on the cathode is measured using a voltmeter, and the current between the electrodes is measured using a Wheatstone bridge. The voltage applied on the anode is then increased to 1.2 V for over 1 s, and a new measurement is performed. The voltage continues to be increased in increments of 0.2 V per second until a
maximum voltage of 3.8 V is reached (15 steps in all). The same 15 incremental increases in voltage are applied on the left-foot electrode used as anode, while the right-foot electrode is used as cathode. Finally, the same 15 steps are applied twice on the hand electrodes, with each electrode used alternately as an anode or a cathode.*
In vitro electrochemical studies were conducted to evaluate the nickel and several stainless-steel electrodes behavior in sweat-mimicking solutions. The results showed that the concentration of chloride had a strong influence on the anodic potential [22-27]. In this review we summarize the different studies reporting on the electrochemical analysis of the electrode materials used for the EZSCAN and SUDOSCAN devices.
2. The case of nickel electrodes
In the EZSCAN device the electrodes are made of nickel, which is a key parameter of the device because of its sensitivity to sweat composition. The nickel electrodes play alternately the role of anode and cathode, which do not undergo any specific pretreatment before each measurement. Thus, the analysis of the temporal evolution of the physico-chemical properties of nickel is of prime importance to ensure the good performance of the biomedical device. Although the electrochemical properties of nickel have been widely examined, through the analysis of its corrosion in aqueous acid or alkaline solution, very few studies have been dedicated to the specific assessment of its behavior in physiological solutions. Ayoub et al. [22,23] thoroughly explored the electrochemical behavior of nickel electrodes (i) in a three-electrode set-up combining a nickel counter-three-electrode and a nickel pseudo-reference electrode in order to mimic the whole Ni electrode configuration of the EZSCAN device, (ii) in synthetic buffered phosphate and carbonate solutions (CBS) in which the pH and the concentrations of chloride, lactate and urea were varied to mimic the behavior of the electrodes in contact with sweat and (iii) in different potential windows to evaluate the aging of the electrodes and assess the means of restoring fresh surfaces. These studies constitute a sound approach aimed at understanding the chemical key parameters controlling the origin of the onset signals delivered during the clinical tests, in terms of electrochemical reactions, and ensure their reproducibility.
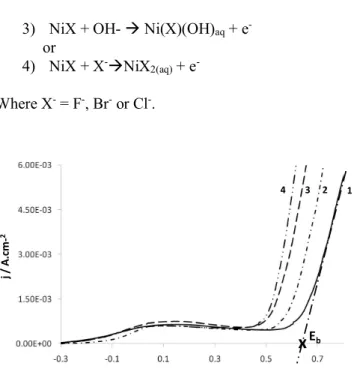
Figure 1 shows the positive potential going direction of the cyclic voltammograms (potential scan rate starts at - 0.3 V vs SCE) recorded on Ni in CBS (36 mM, pH 7) in the presence of different concentrations of chloride ions (30, 60, 90 and 120mM) [23]. In all cases, a nickel oxidation process occurs at low anodic potentials leading to the formation of an oxide film composed probably by an inner NiO layer and an outer Ni(OH)2 layer [23]. At higher
anodic potentials, the Cl- attacks lead to the breakdown of
the oxide film and then causes a local dissolution of Ni. It can be noticed also that the breakdown potential Eb shifts
towards more negative potentials when increasing the chloride ion concentration. This is due to an increase in the concentration ratios [Cl-]/[OH-] or [Cl-]/[HCO
3-] that
favors the adsorption of Cl- and weakens the passive layer,
leading to its breakdown at lower potential values [23]. Nguyen and Foley [28] and Galvele [29 J have proposed a mechanism for the breakdown of metal passivity by aggressive anions (as chloride) in several steps: (i) preferential competitive adsorption of aggressive anions over species as H2O or OH-; (ii) halide anions penetration
through the oxide layer possibly through cracks (flaws) and binding to metal sites; (iii) halide ions diffuse through the metal oxide lattice and bind to metal sites; iv) aggressive anions strongly adsorb on the oxide film and peptize it. According to this model, the following mechanism was proposed [30, 31]:
1) Ni + X- ⥨ Ni(X-) ads
2) Ni(X-)
ads ⥨ NiX + e
-3) NiX + OH- à Ni(X)(OH)aq + e
or
4) NiX + X-àNiX 2(aq) + e
-Where X- = F-, Br- or Cl-.
Fig.1. Cyclic voltammograms of Ni electrode in aerated CBS (36 mM, pH 7) in presence of NaCl (curve 1: 30 mM; curve 2: 60 mM; curve 3: 90 mM and curve 4: 120 mM). Only the forward scans are shown. Scan rate = 100mV/s. Adapted from [23] As mentioned above, the electrodes in the EZSCAN technology play alternately the role of anode and cathode and they do not undergo a specific pretreatment before each measurement. This led to analyze the technical conditions allowing reproducibility of the clinical tests,
notably the influence of the cathodic part of the voltammogram on the anodic one.
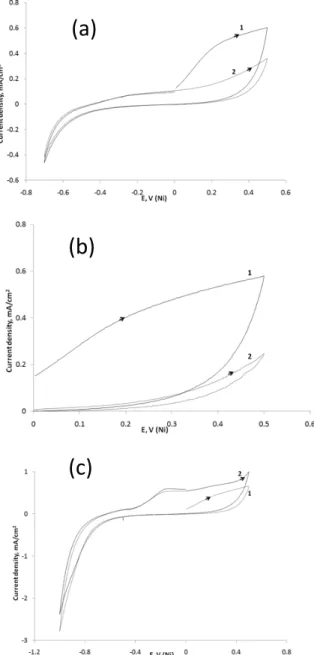
Figure 2 shows the influence of scanning the electrode potential in the negative direction on the cyclic voltammograms in aerated CBS (36 mM) in presence of Cl- (36 mM). The most important phenomenon that should
be emphasized here is that the negative potential going direction scan allows providing a renewed “fresh” nickel surface. Indeed, the negative potential going direction was investigated in aerated CBS (36 mM; pH = 6.5) containing Cl- (36 mM) by recording two consecutive scans in three
different potential ranges as follows: 0 → 0.5 → 0 → 0.5 V (Figure 2a); 0 → 0.5 → -0.7 → 0 → 0.5 V (Figure 2b) and 0 → 0.5 → -1 → 0 → 0.5 V (Figure 2c). It clearly appears that the first potential sweep affects strongly the subsequent second voltammogram: no observation of anodic plateau current, related to the formation of the passive layer, was effective during the second successive scan if the negative potential going direction was reversed before reaching – 1 V. This means that the dissolution of the passive layer occurs only if the potential scan was extended down to – 1 V. In fact, this process merges also with the reduction of the protons from water (2H+ + 2e ->
H2). Indeed, it is quite evident that upon scanning the
potential towards E < -0.8 V, a large cathodic current appears (Figure 2c). The cathodic reaction that renews the electrode surface can be attributed to the reduction of NiCO3 and/or Ni(OH)2, as mentioned above and already
suggested [32-35]. This allows defining the experimental conditions where the Ni electrode can be freshly renewed. For example, in the case of CBS (36 mM; pH = 6) in presence of Cl- (36 mM) and lactate (40 mM), it was found
that a renewed Ni electrode can be restored upon one scan of the electrode potential as follows 0 → 0.6 → -1 → 0 → 0.6 V, at a scan rate of 100 mV/s.
In order to get a deeper insight on the electrochemical behavior of Ni electrodes and the associated surface modifications of the passive film, after ageing with an increasing number of current-potential cycles in neutral media mimicking sweat composition (i.e. clinical tests), XPS and ToF-SIMS analyses were also performed. Ayoub et al. [24] thoroughly characterized model surfaces of Ni electrodes, after ageing these materials with repeated cyclic voltammograms in carbonate buffer solutions. The solution contained the components of sweat, and the potential scan was conducted at different potential ranges : (i) in a restricted anodic potential range (-0.3 V to 0.5 V and return to -0.3 V), (ii) in a negative extended potential range (-0.3 to 0.5 V and return to -1 V) and (iii) in a larger potential range (-0.3 V to 1 V and return to -1 V), in order to reach anodic potentials higher than the breakdown potential leading to a localized dissolution of nickel. The obtained results allowed concluding that, during the clinical tests, an increase in the thickness of the oxide film
E, VSCE j / A. cm -2
x
Eb 1 2 3 44
may take place at the surface of the nickel electrodes with increasing the number of measurements. However, if one takes into account the obtained in vitro electrochemical results in experimental conditions that are much more aggressive (accelerated ageing) than the clinical conditions, then it is possible to consider that during a large number of clinical tests the electrodes tend to keep similar performances. Nevertheless, it was very difficult to estimate the time-life of the electrodes.
Fig. 2. Successive cyclic voltammograms of Ni electrode in CBS (pH = 6.5) in presence of 36 mM NaCl at different potential range (a): 0 → 0.5 → 0 → 0.5V; (b); 0 → 0.5 → -0.7 → 0 → 0.5 V; (c) and 0 → 0.5 → -1 → 0 → 0.5 V. Curves 1: 1st scan;
curves 2 : 2nd scan. Scan rate = 100 mv/s. Adapted from [22]
Further XPS analyses were also performed to assess the surface modifications of Ni materials, by sweeping
towards highly anodic potential of 1 V where pitting corrosion of nickel occurs. This situation may occur during real clinical tests when facing unusual conditions. Figure 3a presents an optical view of the pitted sample. XPS data revealed that the effect of changing the anodic potential on the total corrosion layer thickness was not very significant, but the NiO thickness obtained after treatment at 1.0 V has increased, compared to the case of an anodic potential of 0.5 V. The predominant role of the anodic potential on the oxide thickness is also confirmed by the results obtained after treatment at a solution concentration of 36 mM NaCl. Due to the lack of significant information about the surface chloride from XPS measurements, additional analysis was performed by ToF-SIMS, the detection limit of which being much lower (about ppb to ppm, depending on the ion yield). Summarizing this study, it appeared that below pitting potentials, surface chloride was hardly detected by XPS, and the surface composition of the nickel samples was similar after treatments in chloride or chloride-free buffered solutions. In a larger potential range enabling to reach anodic potentials higher than the breakdown potentials, localized dissolution of nickel was observed. The highly chemically sensitive ToF-SIMS surface characterization pointed that the surface concentration of adsorbed chloride was higher in pits than elsewhere on the surface sample. Thus, the combination of electrochemical measurements and surface characterizations gave fruitful complementary results on the surface behavior of nickel electrodes, polarized in corrosive conditions. These systematic observations, in different potential ranges, show that alternating the polarity of electrodes ensures the reproducibility of measurements for a large number of clinical tests and explain why, during the routine use of such biomedical set-ups, the metal/sweat interaction may reduce the lifetime of the anodic and/or cathodic electrodes.
Fig. 3. One-cycle experiment of a Ni electrode immersed in carbonate buffer saline solution (pH 6.4), in presence of 120 mM NaCl, in the potential range of -0.3 V ® 1.0 V ® -0.3 V, (a) optical image, (b) Cl 2p core level peak region (XPS). Adapted from [24]
(a)
(b)
(c)
Author's personal copy
H.Ayoubetal./AppliedSurfaceScience258 (2012) 2724–2731 2729 Table3
NiOandNi(OH)2layerthicknessescalculatedfromXPSNi2p3/2corelevelpeakdecompositionsaftercyclingtoanodicpotentials(NaCl,carbonatebuffersalinesolution,pH
6.4). Rangeofpotentials (1anodiccycle) NiOequivalent thickness(nm) Ni(OH)2equivalent thickness(nm) Passivelayer thickness(nm) −0.3V→0.5V→−0.3V 120mMNaCl 0.5±0.1 0.8±0.1 1.3±0.2 −0.3V→1.0V→−0.3V 120mMNaCl 0.9±0.1 0.7±0.1 1.6±0.2 −0.3V→1.0V→−0.3V 36mMNaCl 0.9±0.1 0.5±0.1 1.4±0.2
Fig.5.One-cycleexperimentofaNielectrodeimmersedincarbonatebuffersalinesolution(pH6.4),inpresenceof120mMNaCl,inthepotentialrangeof −0.3V→1.0V→−0.3V,(a)opticalimage,(b)Cl2pXPScorelevelpeakregion.
corrosionfilm.Athighanodicpotentials,alargeanodiccurrent
relatedtothelocaldissolutionofNifollowingtheCl−attackis
observed[3].Fig.4alsoshowsthebreakdownpotential(Eb=0.55V)
oftheNianode.
Anewseriesofone-voltammetriccycleexperimentswasalso
performedbychangingtheanodicpotentialto1.0Vinsteadof0.5V,
ina120mMNaClbuffersolution(and36mMNaClforanother
experiment),andthesamplesurfaceswerecharacterizedbyXPS.
Fig.6.(a)ToF-SIMSspectra(negativeionmode)ofaNisampleimmersedincarbonatebuffersalinesolution(pH6.4),inpresenceof120mMNaCl,aftersweepingthe potentialintherange:−0.3V→1.0V→−0.3V.(b)Peakintensitycomparison,afternormalisationtothesameanalysisarea,inside(thinline,40×40!m2spotsize)and outsideapit(boldline,100×100!m2spotsize).
3. The case of stainless steel electrodes
In the SUDOSCAN device, the electrodes are made of stainless steels. Indeed, skin contact with nickel used in the EZSCAN may result in possible allergic reactions for some patients. This led to study the replacement of nickel electrodes by another material and several stainless steels were examined as potential substitute material, already used in surgical instruments for example and cheaper than nickel. Several studies have been conducted to assess the electrochemical behavior of stainless steels in neutral or slightly acid and alkaline solutions [36-49], but very few studies have been devoted to the specific assessment of their behavior in physiological or biomimetic solutions [50-52]. Furthermore, there are few published studies related to deeper insight on the effect of some sweat parameters (as urea and lactate) on the electrochemical behavior of stainless steels. Ayoub et al. [25] implemented the electrochemical studies of stainless steel 304L with additional analysis in synthetic buffer carbonate solutions (CBS), in which the pH and the concentrations of chloride, lactate and urea were modified in order to mimic the behavior of the electrodes in contact with sweat. The electrochemical measurements were performed in a three-electrode set up combining a stainless steel 304L counter electrode in order to mimic the two active electrodes configuration (the same material is used for the anode and the cathode) of the SUDOSCANTM device. The authors
studied the influence of pH, chloride ions, carbonate buffer concentration and the presence of urea and lactate. In most cases, within the expected concentration range in sweat at rest, it was shown that the concentration of Cl- is high
enough to cause the breakdown of the passive film formed on the surface of SS 304L. Furthermore, the breakdown potential Eb of SS 304L is highly affected by the variation
of Cl- concentration (Figure 4). It was also shown that the
variation of pH, buffer concentration and lactate concentration affect the electrochemical behavior of SS 304L by displacing Eb towards less or higher anodic
potentials. As the variation range of these parameters in sweat is low compared to that of Cl-, and as the breakdown
potential is highly shifted by varying Cl- concentration, the
currents obtained during the clinical tests are likely to be controlled by the variation of Cl- concentration. These
results tend to prove that SS 304L is suitable to the SUDOSCANTM application due to its high capacity to
detect the deviation in the ionic balance and notably the deviation in Cl- concentration; thus, allowing the clinical
assessment of sudomotor dysfunction observed in early diabetes stages. Furthermore, when comparing the electrochemical behavior of SS 304L to that of nickel, it clearly appears that the sensitivity of SS 304L to the variation of Cl- concentration, the main parameter of
sweat, is much higher than that of nickel electrode
confirming that it is a potential substitute material for nickel.
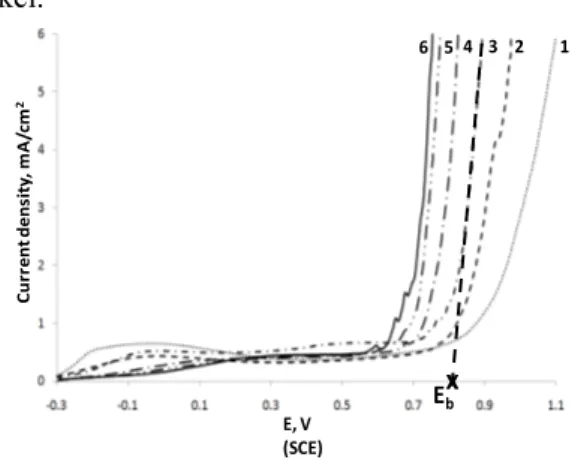
Fig. 4. Cyclic voltammograms of SS 304L electrode in aerated carbonate solutions (36 mM) in presence of 120 mM NaCl (curve 1: pH = 2; curve 2: pH = 4; curve 3: pH = 12; curve 4: pH = 6; curve 6: pH 7 and curve 6: pH 8). Scan rate = 100 mV/s. Only the forward scans are shown. Adapted from [25]
Despite stainless steel 304L affords excellent characteristics, it is interesting to screen other biocompatible stainless steels to get improved sensitivity for the medical device. In a recent work, Calmet et al. [26] have thus chosen different biocompatible stainless steels, more precisely AISI 304L, AISI 430, AISI 430T and D2205 and analyzed their electrochemical behaviors in comparison to that of nickel. The steels were selected on the basis of their known biocompatibility and on their different chemical composition and microstructure. AISI 304L and D2205 present different levels of nickel, AISI 304L being austenitic and D2205 duplex, while AISI 430 and 430T are ferritic (exempt of nickel). The resistance of such materials at the pitting corrosion in sweat mimicking electrolyte, at pH 7, was investigated. The corrosion behavior of these materials was studied in carbonate buffer at physiological pH (pH=7) containing NaCl at different concentrations, ranging . from 36 to 120 mM, which corresponds to the concentration found in natural sweat [23].
Figure 5 shows the typical polarization curve (j-E) obtained on AISI 304L electrode, in absence and in presence of chloride. In absence of NaCl (curve 1), the shape of the curve presents two main features: an oxidation peak around 0.75 V and a sharp rise at 1.1 V. The peak around 0.75 V was attributed to trans-passivity process associated to the chromium oxidation of the passive layer, and the second process at 1.1 V is linked to oxygen evolution process. An extra test at a lower chloride content (5 mM) was performed (curve 2) and the electrochemical behavior is similar to that in absence of chloride ions. However, when the chloride concentration increases up to values close to the lower sweat content of chloride ions (36
1 2 3 4 5 6 Cu rr en tde ns it y, m A /cm 2 E, V (SCE) Ebx
6
mM), a clear increase in current density is observed and attributed to a pitting corrosion process. The Eb appears at
0.75 V just in range of the transpassivity process of the Cr passive layer, indicating that the passive layer developed is more susceptible to pitting corrosion. As it can be observed on this figure, when the chloride content increases (60 and 120 mM, curves 4 and 5, respectively) Eb decreases as expected.
Fig. 5. (a) Polarization curve on austenitic stainless steel in presence of NaCl. The straight line corresponds to the forward scan and the dotted line to the backward scan. (b) Evolution of polarization curve obtained at AISI 304L in carbonate buffer solution (pH=7, 25°C) with increased amount of NaCl: (1) 0 mM (2) 5 mM (3) 36 mM (4) 60 mM and (5) 120 mM. Scan rate: 1 mV/s. Adapted from [26]
Similar experiments were performed with the different steels. A summary of the corrosion parameters for nickel (used as reference material), AISI 304L and AISI 430 are presented in Table 1 (= Table 2 of [26]). The ferritic steel AISI 430T, presents the lower values of Eb at a chloride
content of 36 mM, indicating the high sensibility of this steel. However, the reproducibility in Eb values was poor
and present high dispersion (in the order of ± 300mV), which makes this steel unsuitable for the use as biomedical sensor. The electrochemical tests performed with duplex steel D2205 obtained in presence or in absence of chloride ions (from 36 to 120 mM) did not show any pitting corrosion process in all the chloride range studied. Thus, D2205 is not suitable as “chloride sensor” due to the absence of sensitivity to the sweat chloride range. However, the ferritic steel AISI 430 presents pitting
corrosion process in the range of chloride studied with good reproducibility.
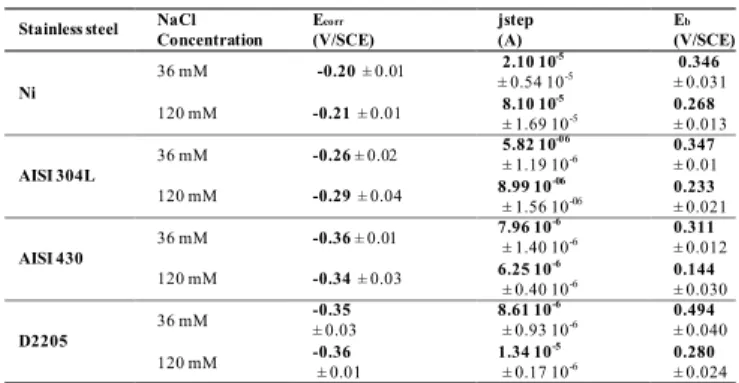
The Ecorr values are very close at both concentrations (»
-0.3 V/SCE), whatever the electrode material. The current at the passivity plateau (jstep)at 36 mM of chloride is lower
than that observed in the solution with 120 mM NaCl for both Ni and AISI 304L. A lower jstep is indicative of a more
protective passive layer. It can be noticed that the passivity plateau current obtained on stainless steels (AISI 304L and AISI 430) is almost identical at both 36 and 120 mM NaCl concentrations. The value of Eb is shifted to lower values
with the increase in chloride concentration, whatever the stainless steel. Indeed, as expected, the pitting corrosion potential decreases with the increase in chloride concentration. These results are in concordance with those reported in the literature on the corrosion of low nickel content stainless steels by several studies that also showed that the extent of the passive range decreased with the addition of chloride ions [25, 37, 53].
Table 1. Values of Ecorr, Jstep, and Eb on Ni, AISI 304 L; AISI 430
in carbonated buffer solution (pH=7, 25°C) in 36 and 120 mM chloride (mean value ± RSD). (Results deduced from polarization curves at 1 mV/s). Adapted from [26]
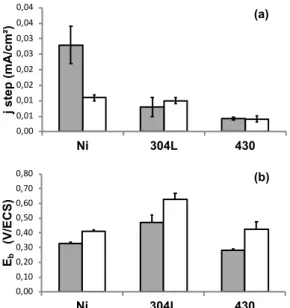
The histograms of Figure 6 show the variation of jstep and
Eb as a function of electrode materials and NaCl
concentration (Ecorr was not presented, because no
significant variations were observed in the concentration range studied). jstep (Figure 6a) was lower on stainless
steels than on nickel, showing that on stainless steels the passive layer is more protective than on pure nickel in the experimental conditions of this study. On nickel, jstep
decreases with increasing NaCl concentrations, while no variations in jstep were observed on AISI 430.
The results concerning Eb are summarized on Figure 6b.
Eb decreases with the increase in NaCl concentration
whatever the electrode material. Since the alloys show about the same Ecorr value, a higher Eb value is indicative
of a higher resistance to pitting corrosion. The value of Eb
depends on the chemical composition of the sample. The largest Eb values at 120 mM and 36 mM of NaCl were
5 4 3 2 1 E (V vs SCE) j(A c m -2) Ecorr Eb Eprot jstep E (V) log ½j ½A cm -2 (a) (b)
Stainless steel NaCl Concentration Ecorr (V/SCE) jstep (A) Eb (V/SCE) Eprot (V/SCE) Ni 36 mM -0.20 ± 0.01 2.10 10± 0.54 10-5 -5 0.346 ± 0.031 0.0285 ± 0.0500 120 mM -0.21 ± 0.01 8.10 10 ± 1.69 10-5-5 0.268 ± 0.013 -0.0670 ± 0.087 AISI 304L 36 mM -0.26 ± 0.02 5.82 10 -06 ± 1.19 10-6 0.347 ± 0.01 -0.101 ± 0.025 120 mM -0.29 ± 0.04 8.99 10 ± 1.56 10-06-06 0.233 ± 0.021 -0.0398 ± 0.0203 AISI 430 36 mM -0.36 ± 0.01 7.96 10 -6 ± 1.40 10-6 0.311 ± 0.012 -0.237 ± 0.039 120 mM -0.34 ± 0.03 6.25 10-6 ± 0.40 10-6 0.144 ± 0.030 -0.238 ± 0.044 D2205 36 mM -0.35 ± 0.03 8.61 10 ± 0.93 10-6-6 0.494 ± 0.040 -0.027 ± 0.005 120 mM -0.36 ± 0.01 1.34 10 ± 0.17 10-5-6 0.280 ± 0.024 -0.0648 ± 0.0191
obtained for AISI 304 L and the smallest for AISI 430. It is noticeable that the sample with the most resistant passive film layer is AISI 430, but it is the less resistant to pitting corrosion.
The most important feature for our study and medical applications is that the pitting potential varies significantly with chloride concentration, and that the pitting phenomenon occurs at lower potentials meaning that lower energy is required. The obtained results show that most of the corrosion parameters depend on chloride concentration. In the literature, it is generally accepted that, for a given material, Eb in the presence of halides (i.e.
chloride ion) evolves as a function of the halide concentration ([X−]), according to the following equation:
Eb = A + B log([X−] [25]), where A and B are constants
depending on the stainless-steel composition [54]. In order to verify if such linear correlation was obtained, a study of Eb with NaCl concentration was performed for both AISI
304L and AISI 430, in the physiological concentration range, i.e. 36 to 120 mM.
Fig. 6. (a) Histogram showing the evolution of jstep as a function
of the material electrode and NaCl concentration. Grey: 120 mM, white : 36 mM. (b) Histogram showing the evolution of Epit as a function of the electrode material and NaCl
concentration. Grey: 120 mM, white : 36 mM. Adapted from [26]
Figure 7 shows the evolution of Eb with the log of chloride
concentration. These curves confirm the linearity between Eb and log[Cl-] for AISI 304L and AISI 430 in a
carbonated solution. The slopes are similar for both steels, showing that AISI 430 is as sensitive towards chloride ions as AISI 304 L.
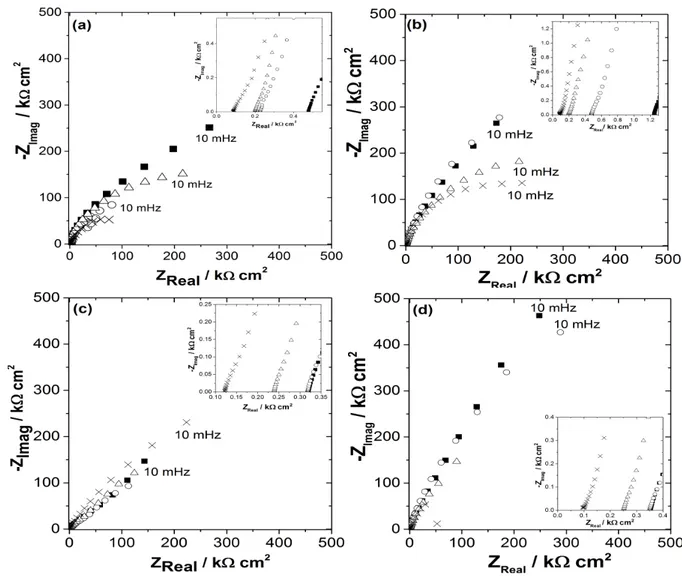
Finally, impedance electrochemical spectroscopy, combined with surface analysis, was used to compare in
details the oxide film properties of AISI 430 with respect to AISI 304L, in a sweat mimicking electrolyte at physiological pH (pH 6.5). The electrochemical impedance responses of SS AISI 304L and SS AISI 430 exposed to a buffered carbonate solution (pH= 6.5) as a function of sodium chloride concentration were obtained at two different potentials: open circuit potential OCP vs SCE and passive potential such as shown in the Nyquist diagrams presented in Fig. 8 (= Fig. 2 of [27]). These diagrams can be attributed to a film made of wüstite (FeO), magnetite (Fe3O4) and hematite (Fe2O3) [55] formed on the stainless-steel surfaces [38]. Higher values of impedance are observed for AISI 430 with respect to AISI 304L in the passive potential zone, which might indicate the formation of a more protective film. When comparing the diagrams obtained at OCP and in the passive zone, a significant increase in the impedance values can be noted; this resistive effect is easily explained by the accelerated formation of the oxide film. In the case of AISI 430, the impedance values tend to decrease slightly with the concentration of chlorides indicating an attenuation of the passive effect. Conversely, for AISI 304L, when increasing the concentration of chlorides, a re-passivation of the surface is likely to occur.
Fig. 7. Pitting potential (Epit) as a function of the log of chloride
concentration for (a) AISI 304L and (b) AISI 430 in a carbonated solution (pH=7, 25°C). Adapted from [26]
AISI 304L and AISI 430 have a rather similar electrochemical behavior in the conditions used in SUDOSCAN technology, but some interesting features can be noted in favor of AISI 430. In particular, EIS analysis reveals that the modulus of the impedance at HF range is slightly higher for AISI 430 than AISI 304L, which may be related to a more protective character and/or thicker oxide layer formed on the surface. Furthermore, EIS analysis shows that the modulus of the impedance at LF range is more sensitive to chloride concentration for AISI 430 than AISI 304L. C∞ values obtained from Cole-Cole representations reveal no significant differences at
0,00 0,01 0,01 0,02 0,02 0,03 0,03 0,04 0,04 Ni 304L 430 j step (mA/cm²) 0,00 0,10 0,20 0,30 0,40 0,50 0,60 0,70 0,80 Ni 304L 430 Eb (V/ECS) (a) (b) y = -0,2659x + 0,8397 R² = 0,9906 y = -0,3014x + 1,0975 R² = 0,9991 0,1 0,2 0,3 0,4 0,5 0,6 0,7 0,8 1,5 1,7 1,9 2,1 Eb (V/SCE) log([NaCl] – mmol L-1)
8
Fig. 8. Nyquist plots of (a,b) AISI 304L and (c,d) AISI 430 at (a,b) open circuit potential and (c,d) passive potential zone in a buffered carbonate solution (pH= 6.5) as a function of the log of chloride concentration: (■) 0 mM, (○) 20 mM, (D) 60 mM and (x) 120 mM. Scan rate: 20 mV/s. Adapted from [27]
open circuit potential. However, in passivity zone, the values obtained for AISI 430 are significantly lower than for AISI 304L and more sensitive to the variation of chloride concentrations.
3. Conclusion
The response of Ni electrodes is different from that of stainless steels which seems to be more adequate for measurements done under real conditions. For example, the sensitivity of Ni electrodes to chloride is pH dependent. Reaction order in chloride ions changes from around 2, for pH 7, to around 1, for pH values between 6 and 5 indicating that measurements in sweat can lead to errors if
the pH of the samples varies in the range indicated. The higher order in chloride ions at neutral pH is surprising since at higher pH the activity of OH- ions is obviously
higher and OH- and Cl- compete for binding to Ni sites. In
real samples, when using Ni electrodes as sensors, small variations in pH are expected so this change in sensitivity can add significant errors in chloride determination. For this reason, stainless steel electrodes seem to be more adequate for chloride determination from sweat from patients. However, the corrosion parameters of different types of steels depend on chloride concentration. AISI 304L and AISI 430 present similar electrochemical behavior under the conditions used in Sudoscan technology. However some AISI 430 present some advantages. For example the EIS analysis indicates that the modulus of the impedance in the HF range is slightly higher for AISI 430 than that for AISI 304L, which seems to suggest a more protective character and/or thicker oxide layer formed on the surface. Furthermore, EIS analysis indicates that the modulus of the impedance in the LF
5
Figure 2-
Nyquist plots of (a,b) AISI 304L and (c,d) AISI 430 at (a,b) open circuit potential
and (c,d) passive potential zone
in a buffered carbonate solution (pH= 6.5)
as a function of
the log of chloride concentration
: (
■) 0 mM, (
○) 20 mM, ( ) 60 mM and (x) 120 mM.
Scan rate: 20 mV/s.
3.2.1. Open circuit potential condition (OCP)
Fig. 3 shows the Bode diagrams of AISI 304L and AISI 430
obtained at OCP
. For
all cases,
the capacitive behavior can be described by a one-time constant, attributed to the oxide film
formed on the surface, which might be made by an external and an inner oxide layer [17,18].
For all cases, no significant differences are observed in the modulus of the impedance (|Z|)
in the low (LF), between 10
-2and 10
-1Hz, and medium (MF) frequency (F), between 10
-1and 10 Hz. However, the |Z| at high (HF) frequency is modified by the chloride concentration,
which might be associated to a change in the electrolyte conductivity. The phase values ( )
range is more chloride-sensitive for AISI 430 than compared to 304L.
4. Acknowledgements
Financial support from the France-Chile ECOS-Sud program grant C14E03, Fondecyt 1181037 and Impeto Medical Inc. is acknowledged.
4. References & Notes
* the paragraphs preceding (*) are Reprinted by permission from Springer Nature [Clin Auton Res] [Electrochemical skin conductance: a systematic review, P. Novak], [2017]. [1] T. Tamayo, J. Rosenbauer, S. H. Wild, A. M. W. Spijkerman,
C. Baan, N. G. Forouhi, C. Herder, W. Rathmann, Diabetes Res. Clin. Pract. 2014, 103, 206.
[2] L. Gardete-Correia, J. M. Boavida, J. F. Raposo, A. C. Mesquita, C. Fona, R. Carvalho. S. Massano-Cardoso, Diabet. Med. 2010, 27, 879.
[3] Z. Metelko, I. Pavlic-Renar, T. Poljicanin, L. Szirovitza, S. Turek, Diabetes Res. Clin. Pract., 2008, 81, 263.
[4] I. Satman, B. Omer, Y. Tutuncu, S. Kalaca, S. Gedik, N. Dinccag, K. Karsidag. S. Genc, A. Telci, B. Canbaz, F. Turker, T. Yilmaz, B. Cakir, J. Tuomilehto, Eur. J. Epidemiol. 2013, 28, 169.
[5] F. Soriguer, A. Goday, A. Bosch-Comas, E. Bordiu, A. Calle-Pascual, R. Carmena, R. Casamitjana, L. Castaño, C. Castell, M. Catala ́, E. Delgado, J. Franch, S. Gaztambide, J. Girbe ́ s, R. Gomis, G. Gutiérrez, A. López-Alba, M. T. Martı nez-Larrad, E. Menéndez, I. Mora-Peces, E. Ortega, G. Pascual-Manich, G. M. Rojo-Martínez, M. Serrano-Rios, S. Valdés, J. A. Vázquez, J. Vendrell, Diabetologia, 2012, 55, 88. [6] E. van’t Riet, M. Alssema, J. M. Rijkelijkhuizen, P. J.
Kostense, G. Nijpels, J. M. Dekker, Diabetes Care, 2010, 33, 61
[7] W. Rathman, B. Haastert, A. Icks, H. Lo ̈wel, C. Meisinger, R. Holle, G. Giani Diabetologia, 2003, 46, 182
[8] S. Tesfaye, N. Chaturvedi, E. M. Simon, N. Engl. J. Med. 2005, 341–350. P. A. Low, Clin. Neurophysiol., 2004, 115, 1506.
[9] P. A. Low, Clin. Neurophysiol. 2004, 115, 1506.
[10] Hovaguimian A, Gibbons CH, Curr Pain Headache Rep., 2011, 15, 193.
[11] J.D. England, G.S. Gronseth, G. Franklin, Neurology, 2009, 72, 177.
[12] G. Lauria , S.T. Hsieh , O. Johansson , W.R. Kennedy , J.M.
Leger , S.I. Mellgren , M. Nolano, I.S. Merkies , M.
Polydefkis , A.G. Smith , C. Sommer , J. Valls-Solé ; European Federation of Neurological Societies; Peripheral Nerve Society, Eur J Neurol, 2010, 17, 903.
[13] M.J. Peters , M. Bakkers , I.S. Merkies , J.G.
Hoeijmakers , E.P. van Raak , C.G. Faber, Neurology, 2013, 81, 1356.
[14] G. Dimitropoulos, A. Tahrani, M.J. Stevens, World J Diabetes 2014, 5, 17.
[15] G. Devigili, V. Tugnoli, P. Penza, F. Camozzi, R. Lombardi, G. Melli, L. Broglio, E. Granieri, G. Lauria, Brain, 2008, 131, 1912.
[16] Autonomic Testing Policy v001.pdf. https://www.aan.com/ uploadedFiles/Website_Library_Assets/Documents/3.Practi ce_ Management/1.Reimbursement/1.Billing_and_Coding/5.Co ver- age_Policies/14%20Autonomic%20Testing%20Policy%20 v001. pdf Accessed 3/18/2017
[17] C.H. Gibbons, B.M. Illigens, N. Wang , R. Freeman, Neurology, 2009, 72, 1479.
[18] H. Ayoub, J.H. Calvet, V. Lair, S. Griveau, F. Bedioui, M. Cassir, ISBN 2012, 978-953-51-0851-1. http://dx.doi.org/10.5772/53965
[19] A. Vinik, M.L. Nevoret, C. Casellini, Front Endocrinol 2015, 6, 94.
[20] D. Huber, P. Brunswick, J.H. Calvet, D. Dusser, I. Fajac, J. Cyst. Fibros Off J. Eur. Cyst. Fibros., 2011, 10, 15.
[21] P. Nowak, Clin. Auton. Res. 2017, doi: 10.1007/s10286-017-0467-x
[22] H. Ayoub, S. Griveau, V. Lair, P. Brunswick, M. Cassir & F. Bedioui, Electroanalysis, 2010, 22, 2483.
[23] H. Ayoub, V. Lair, S. Griveau, P. Brunswick, J. H. Zagal, F. Bedioui, M. Cassir, Electroanalysis, 2012, 24, 386. [24] H. Ayoub, V. Lair, S. Griveau, A. Galtayries, P. Brunswick,
F. Bedioui, M. Cassir, Appl. Surf. Sci. , 2012, 258, 2724. [25] H. Ayoub, V. Lair, S. Griveau, P. Brunswick, F. Bedioui &
M. Cassir, Electroanalysis, 2012, 24, 1324.
[26] A. Calmet, A. Amar, S. Griveau, V. Lair, E. Sutter, F. J. Recio, P. Brunswick, F. Bedioui, M. Cassir, Electroanalysis, 2016, 28, 30.
[27] A. Calmet, N. Vejar, X. Gonzalez, M. Sancy, A. Ringuedé, V. Lair, S. Griveau, J.H. Zagal, F. Bedioui, M. Cassir, Electroanalysis, 2018, 30, 162.
[28] T. H. Nguyen, R. T. Foley, J. Electrochem. Soc., 1979, 126, 1855.
[29] J.R. Galvele, J. Electrochem. Soc., 1976, 123, 464. [30] E. E. Abd El Aal, Corros. Sci., 2003, 45, 759.
[31] Y. A. El Tantawy, F. M. El Kharafi, Electrochim. Acta, 1982, 27, 691.
[32] I. Milosev, T. Kosec , Electrochim. Acta, 2007, 52, 6799. [33] S. G. Real, M. R. Barbosa, J. R. Vilche, A. J. Arvia, J.
10
[34] B. MacDougall, M. Cohen, Electrochim. Act,a 1978, 23, 145.
[35] A. E. Bohé, J. R. Vilche, A. J. Arvia, J. Appl. Electrochem., 1990, 20, 418.
[36] M. Drogowska, H. Monard, L. Brossard, Appl. Electrochem. ,1996, 26, 217.
[37] A. Kocijan, C. Donik, M. Jenko, Corros. Sci., 2007, 49, 2083.
[38] M. Drogowska, H. Monard, J. Appl. Electrochem., 1997, 27, 169.
[39] K. V.S. Ramana, T. Anita, S. Mandal, S. Kaliappan, H. Shaikh, P. V. Sivaprasad, R. K. Dayal, H. S. Khatak, Mater. Des., 2009, 30, 3770.
[40] Z. B. Saleh, A. Shahryari, S. Omanovic, Thin Solid Films 2007, 515, 4727.
[41] T. L. Sudesh L. Wijesinghe, D. J. Blackwood, Corros. Sci. 2006, 253, 1006.
[42] R. Kasri, J. M. Olive, M. Puiggali, D. Desjardins, Corros. Sci., 1993, 35, 443.
[43] N. E. Hakiki, M. Da Cunha Belo, A. M. P. Simðes, M. G. S. Ferreira, J. Electrochem. Soc., 1998, 145, 3821.
[44] G. Lorang, M. Da Cunha Belo, A. M. P. Simðes, M. G. S. Ferreira, J. Electrochem. Soc., 1994, 141, 3347.
[45] N. Ramasubramanian, N. Preocanin, R. D. Davidson, J. Electrochem. Soc., 1985, 132, 793.
[46] R. Rabic, M. Metikos-Hukovic, J. Electroanal. Chem., 1993, 385, 143.
[47] G. S. Duffo, I. A. Maier, G. R. Galvele, Corros. Sci., 1988, 28, 1003.
[48] C. J. Semino, G. R. Galvele, Corros. Sci., 1976, 16, 297. [49] M. Kaneko, H. S. Isaacs, Corros. Sci., 2000, 42, 67. [50] I. Milosev, J.Appl. Electrochem., 2002, 32, 311.
[51] A. Kocijan, D. K. Merl, M. Jenko, Corros. Sci., 2011, 53, 776.
[52] M. Conradi, P. M. Schon, A. Kocijan, M. Jenko, G. Julius Vancso, Mater. Chem. Phys., 2011, 130, 708.
[53] S. Fajardo, D. M. Bastidas, M. Criado, J. M. Bastidas, Electrochim. Acta, 2014, 129, 160.
[54] K. Khalfallah, H. Ayoub, J. H. Calvet, X. Neveu, P. Brunswick, S. Griveau, V. Lair, M. Cassir, F. Bedioui, IEEE Sens. J., 2012, 12, 456.
[55] A. Alaoui Mouyad, M. E. Orazem, E. M. M. Sutter, B. Tribolllet, A. Koltov, Corros. Sci., 2014, 82, 362.